Can Treasury buybacks contain rising rate vol?
iFlow > Special Report

David Tam
Time to Read: 4 minutes
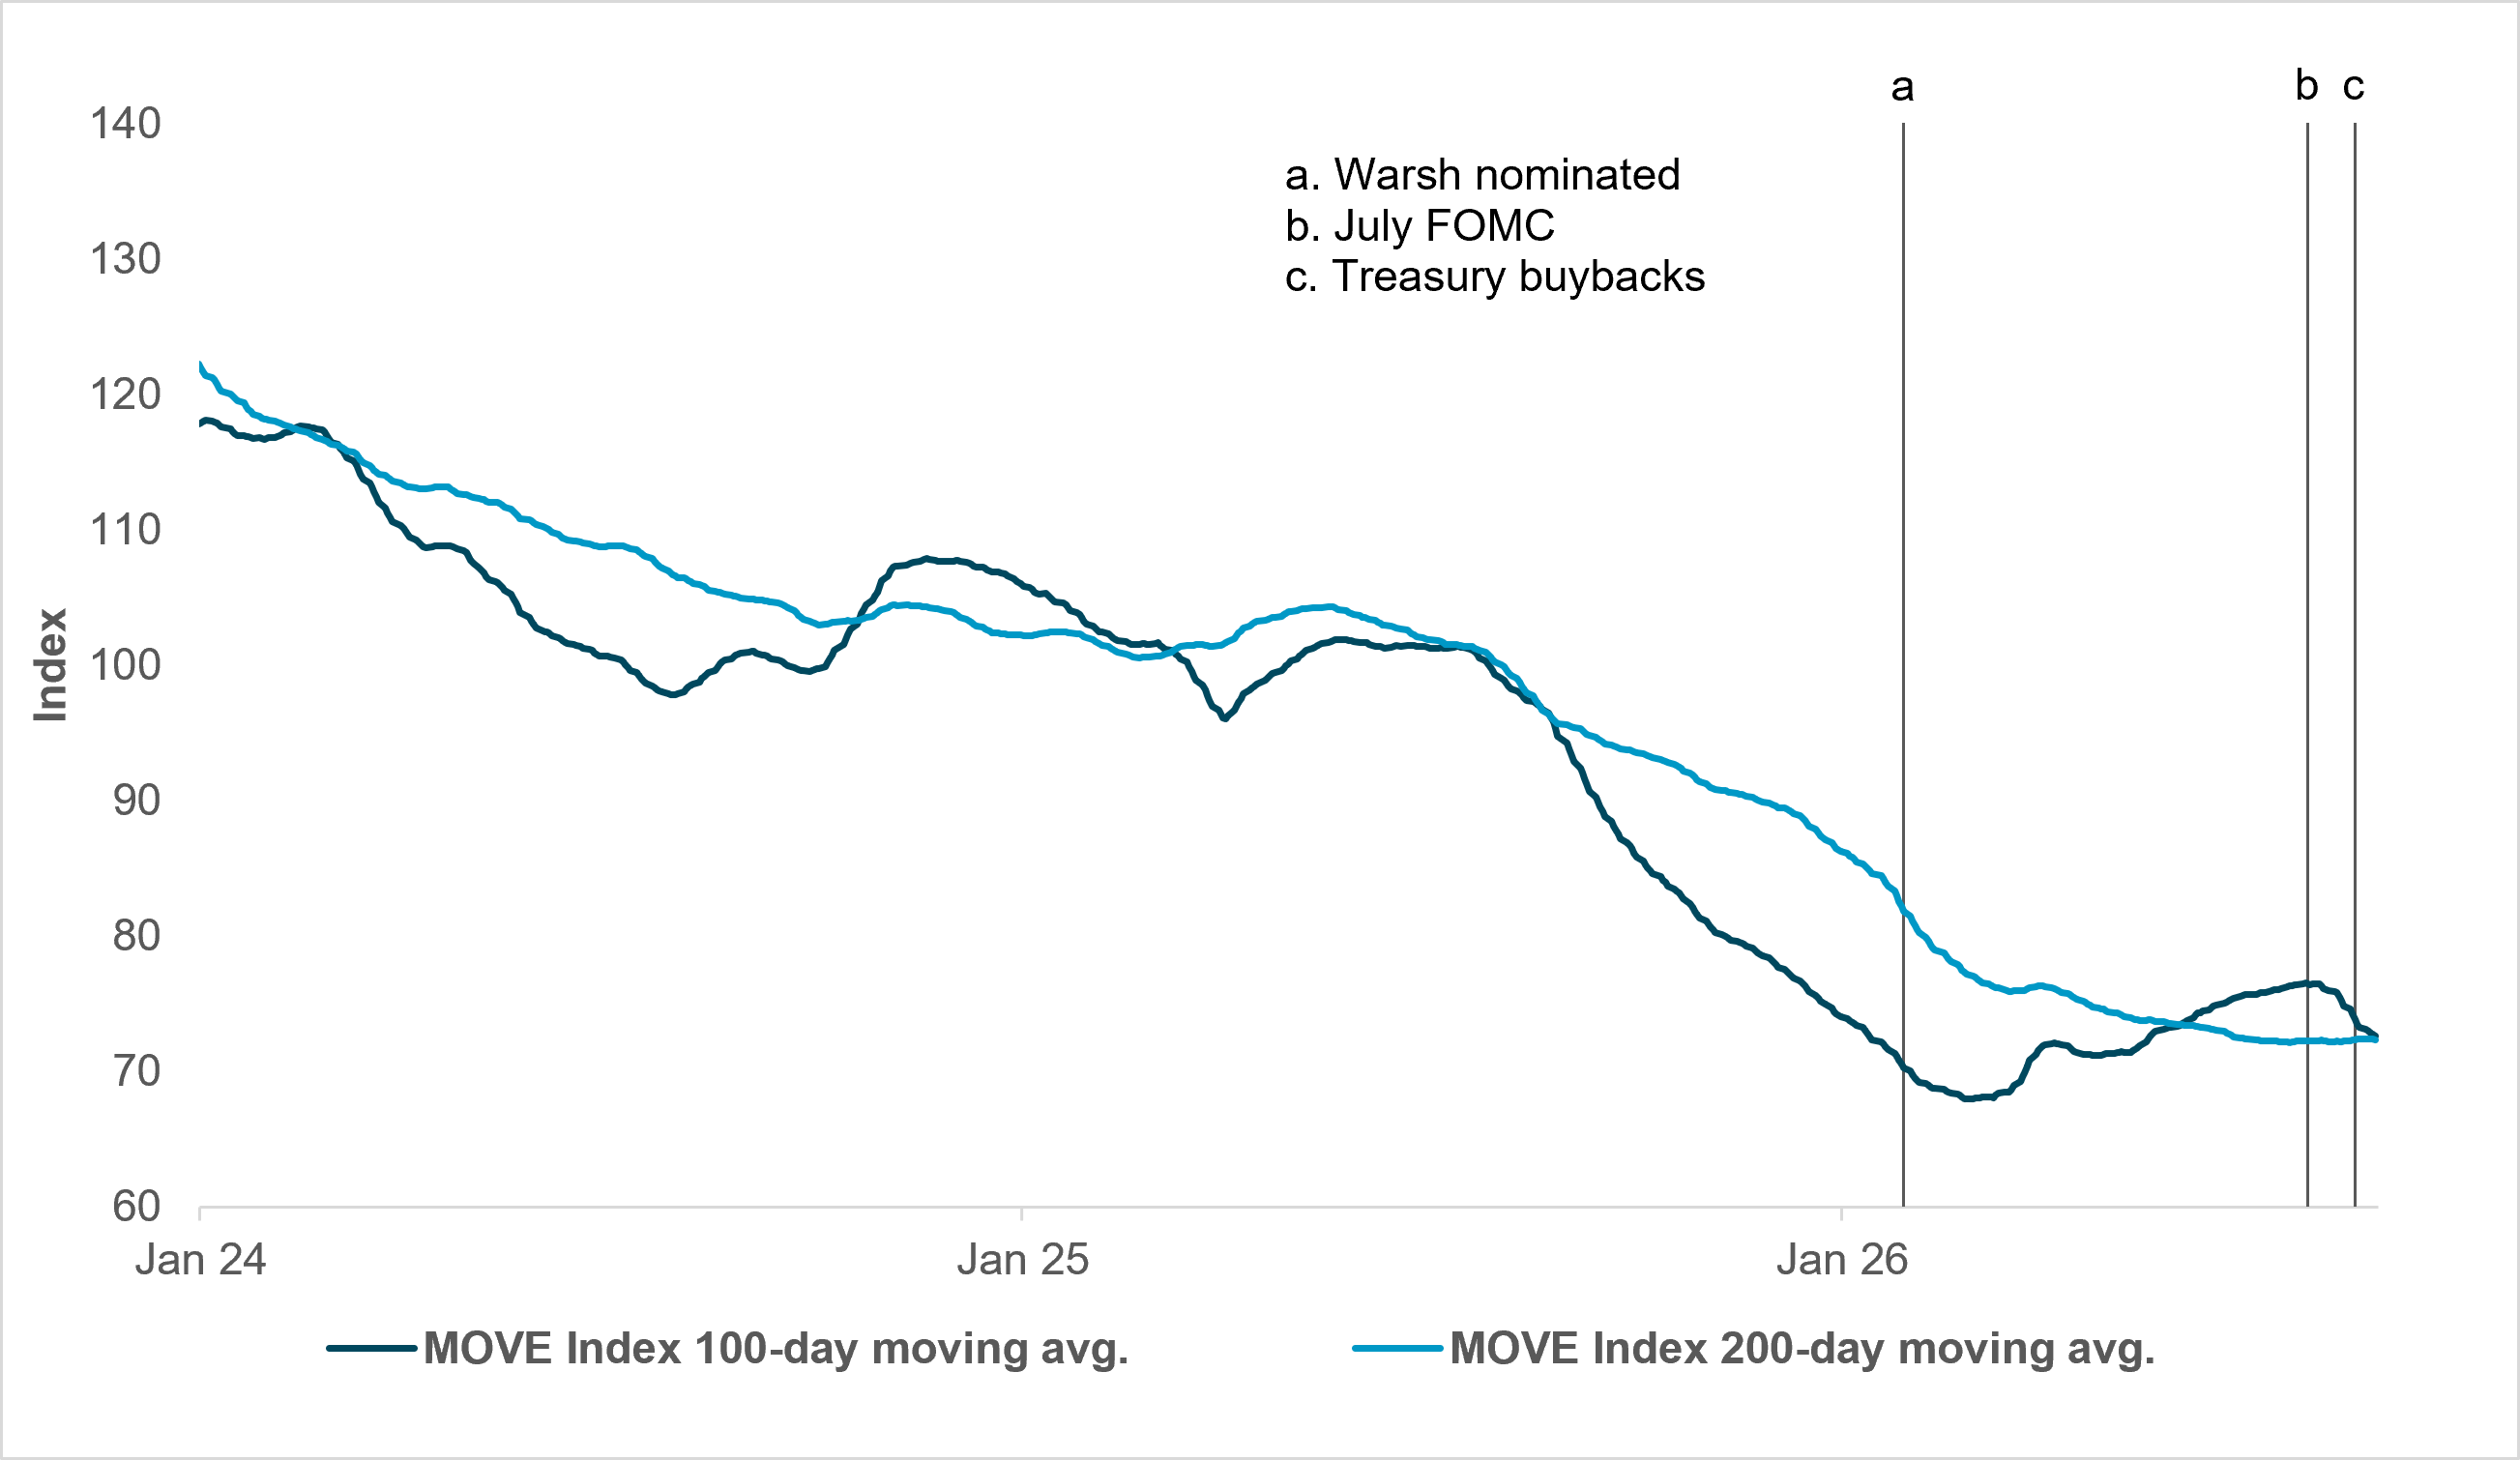
EXHIBIT #1: U.S. RATE VOL: UPWARD INFLECTION, THEN PLATEAU
Source: BNY Markets, Bloomberg
Rate vol will continue to rise: For much of the summer we made this case in a series of notes – on rate vol and portfolio risk, carry trade risk, FX currency risk, and long-end Treasury demand – that rate vol was inflecting higher and would continue to rise as a result of the Warsh-led Fed’s unwillingness to issue forward guidance. We argued that while Kevin Warsh’s approach was probably necessary to break with nearly 20 years of excessive central bank hand-holding, the immediate effect would also be greater front-end rate vol. Without more explicit Fed guidance, markets would have less confidence in the path of short rates, leading to more frequent and aggressive repricings.
Rate vol has leveled off since the July FOMC: (see tripwire b., Exhibit 1). Part of this likely reflects the market adapting to less Fed guidance and Warsh growing more comfortable offering limited direction (Exhibit 1, tripwire b). To this end, we feel Warsh was more direct about his views at Jackson Hole than at earlier press conferences.
More Fedspeak: After a lull in communication from Fed officials at the start of Warsh’s tenure – whether out of deference to the new Chair or because it was summer – other committee members have become more communicative, partially offsetting the effects of Warsh’s reticence. This is particularly true for regional Fed presidents.
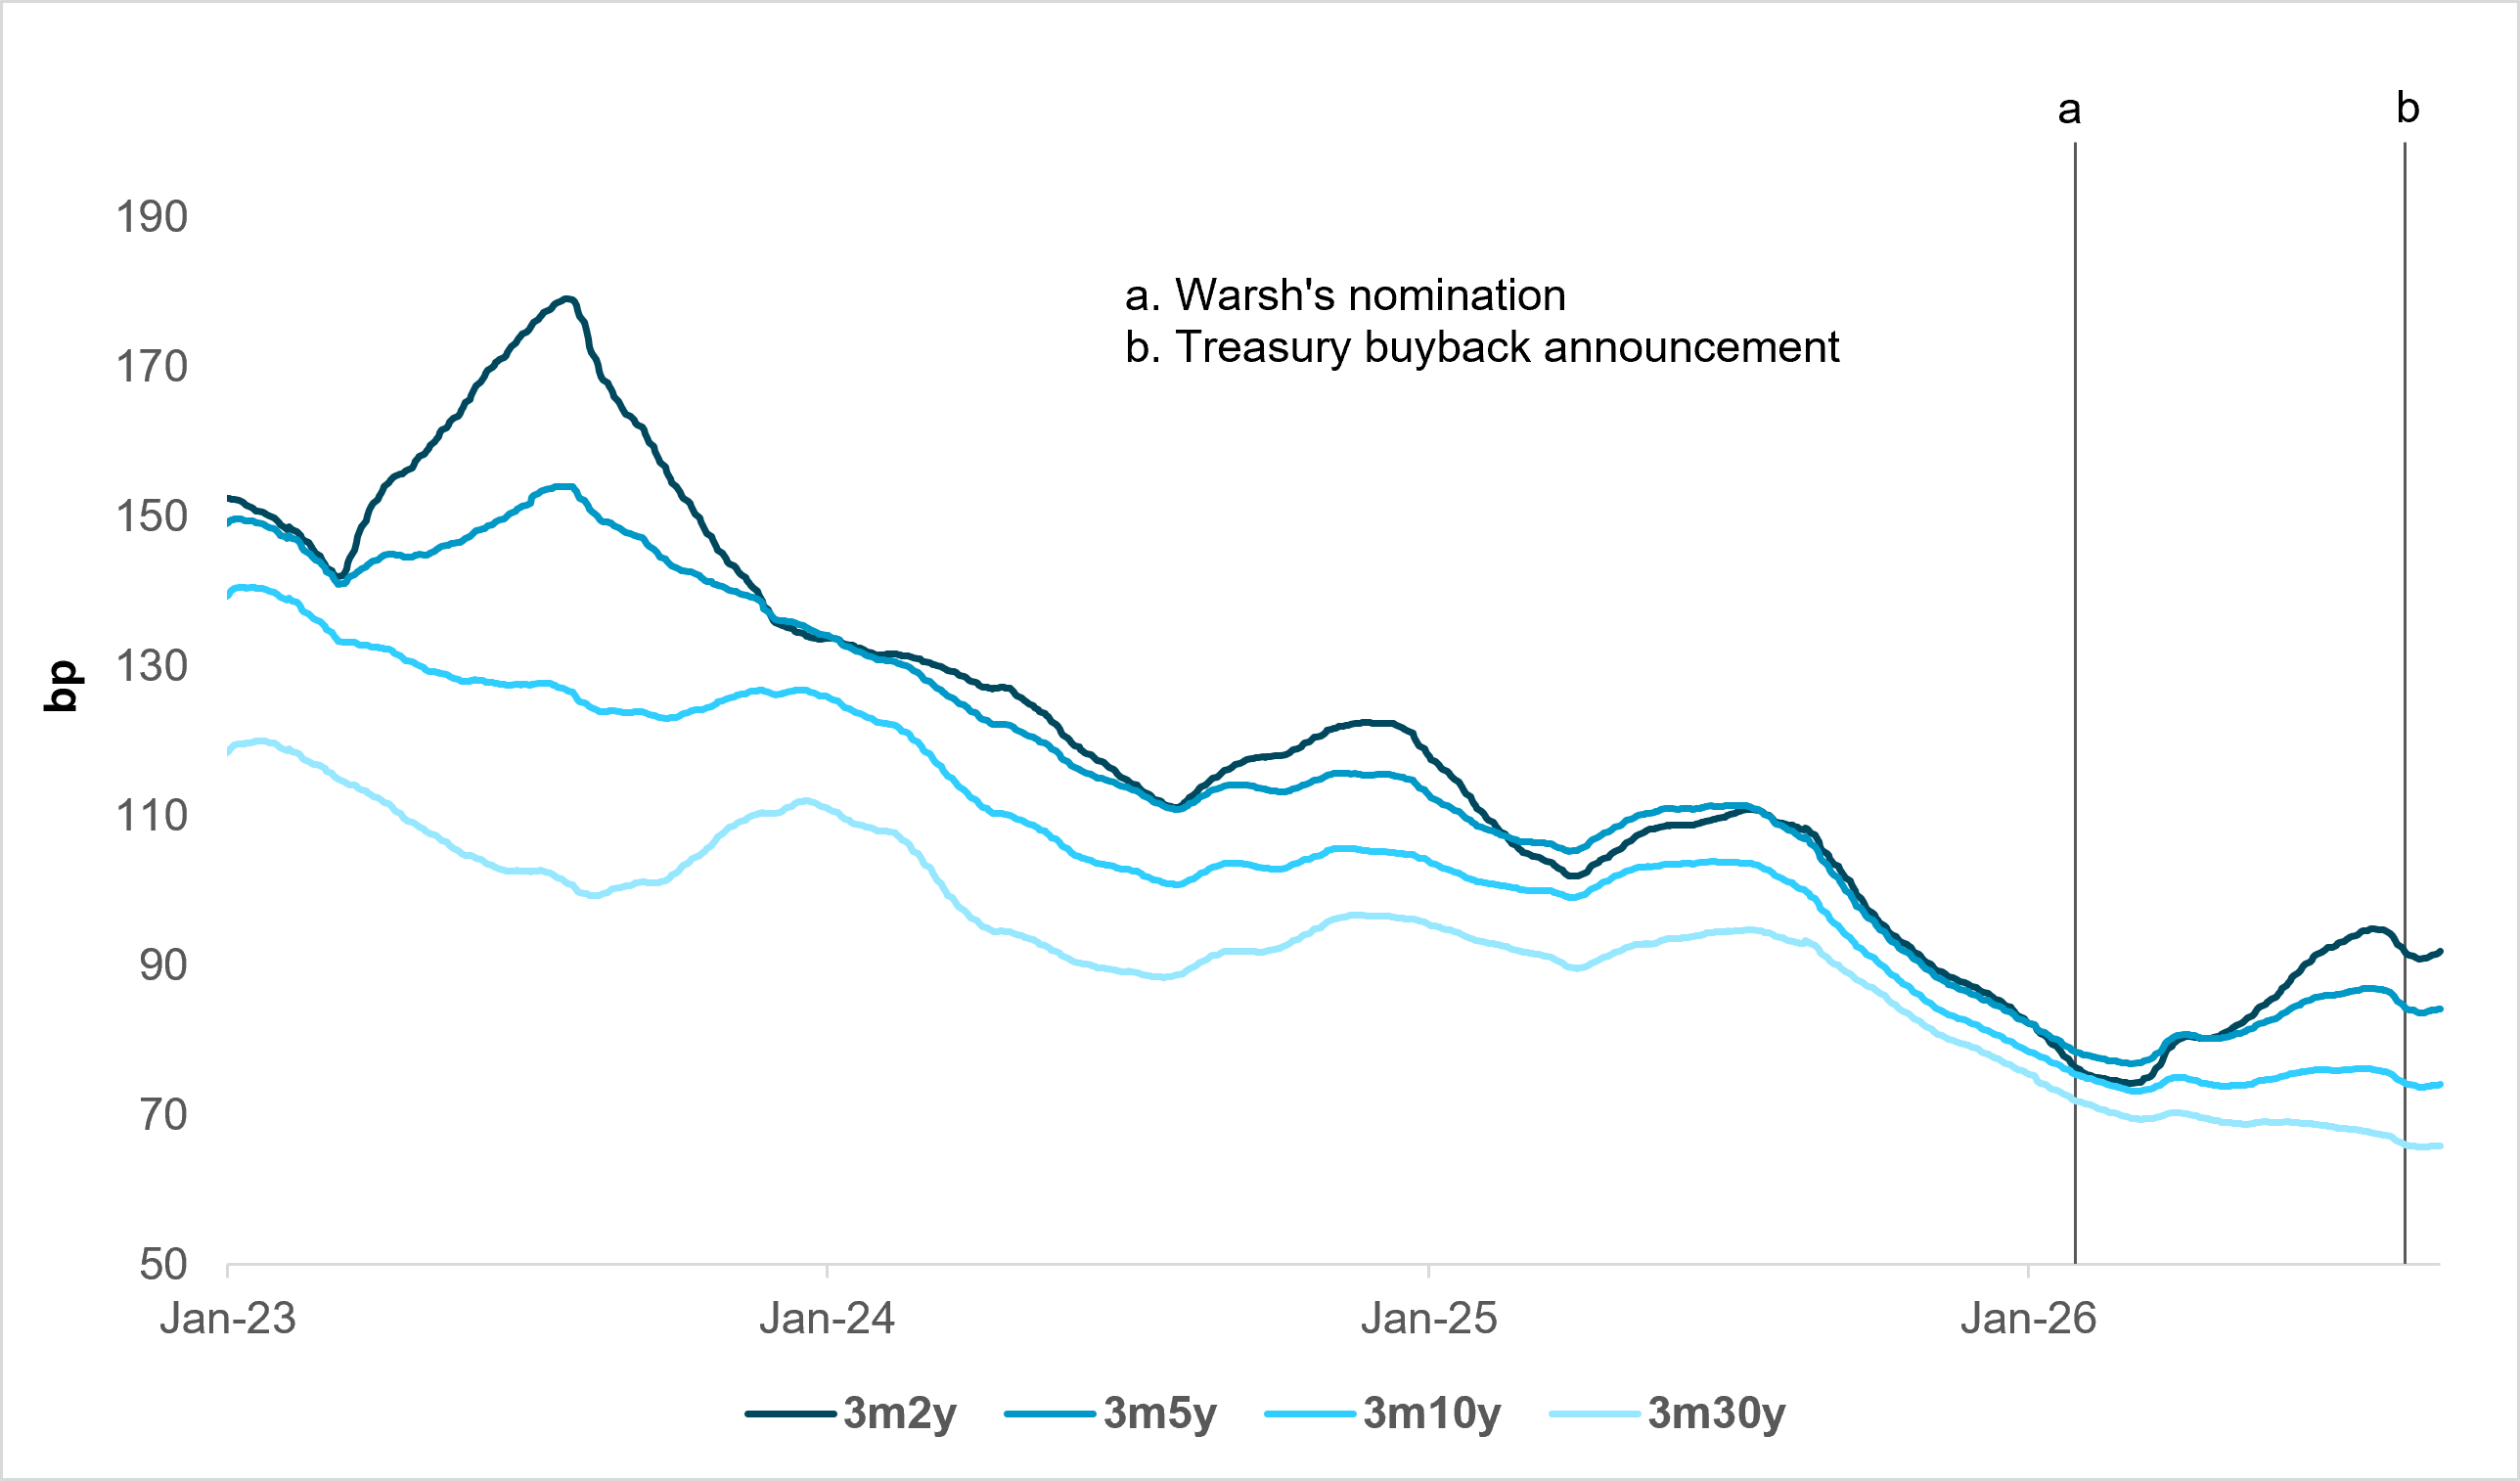
EXHIBIT #2: FRONT-END VOL RISES AS LONG-END VOL DECLINES
Source: BNY Markets, Bloomberg
Front-end vol rising: Three-month swaption implied volatility for a number of tenors (Exhibit 2) shows that rate vol has risen the most for the 2y tenor. While implied volatility is typically higher for shorter-duration tenors, the divergence between front-end and long-end vol since Warsh was nominated is striking. The 100-day moving averages of 3m2y and 3m5y implied vol have inflected upward as a result of less Fed communication and a greater reliance on data prints to shape the rate path. Together, these have increased near-term policy uncertainty.
Long-end vol falling: At the same time, the 100-day moving average of 3m30y swaption implied vol continues to fall while the 100-day moving average for 3m10y swaption implied vol has flattened. Amazingly, given the amount of rate vol suppression that the Fed imposed in 2020 and 2021, 3m30y implied vol reached its lowest post-COVID levels in late August 2026 and hasn’t meaningfully picked up this month.
Divergence reinforces our thesis: Exhibit 2 adds nuance to the Exhibit 1 story. The front end was the driver of rising rate vol while the long end has served as a rate vol anchor. For our analysis prior to this note, we have been using the 100- and 200-day moving averages of the MOVE Index. The MOVE Index is convenient and prevalent but insufficient alone for telling us where rate vol is localized.
Challenged narrative: As global long-end bond yields rose over the summer, a narrative has grown that long-end uncertainty has increased due to concerns of reaccelerating inflation or fiscal sustainability, growing competition for long-duration capital from hyperscaler issuance, or other issues. Yet Exhibit 2 shows that long-end implied vol has persistently declined throughout.
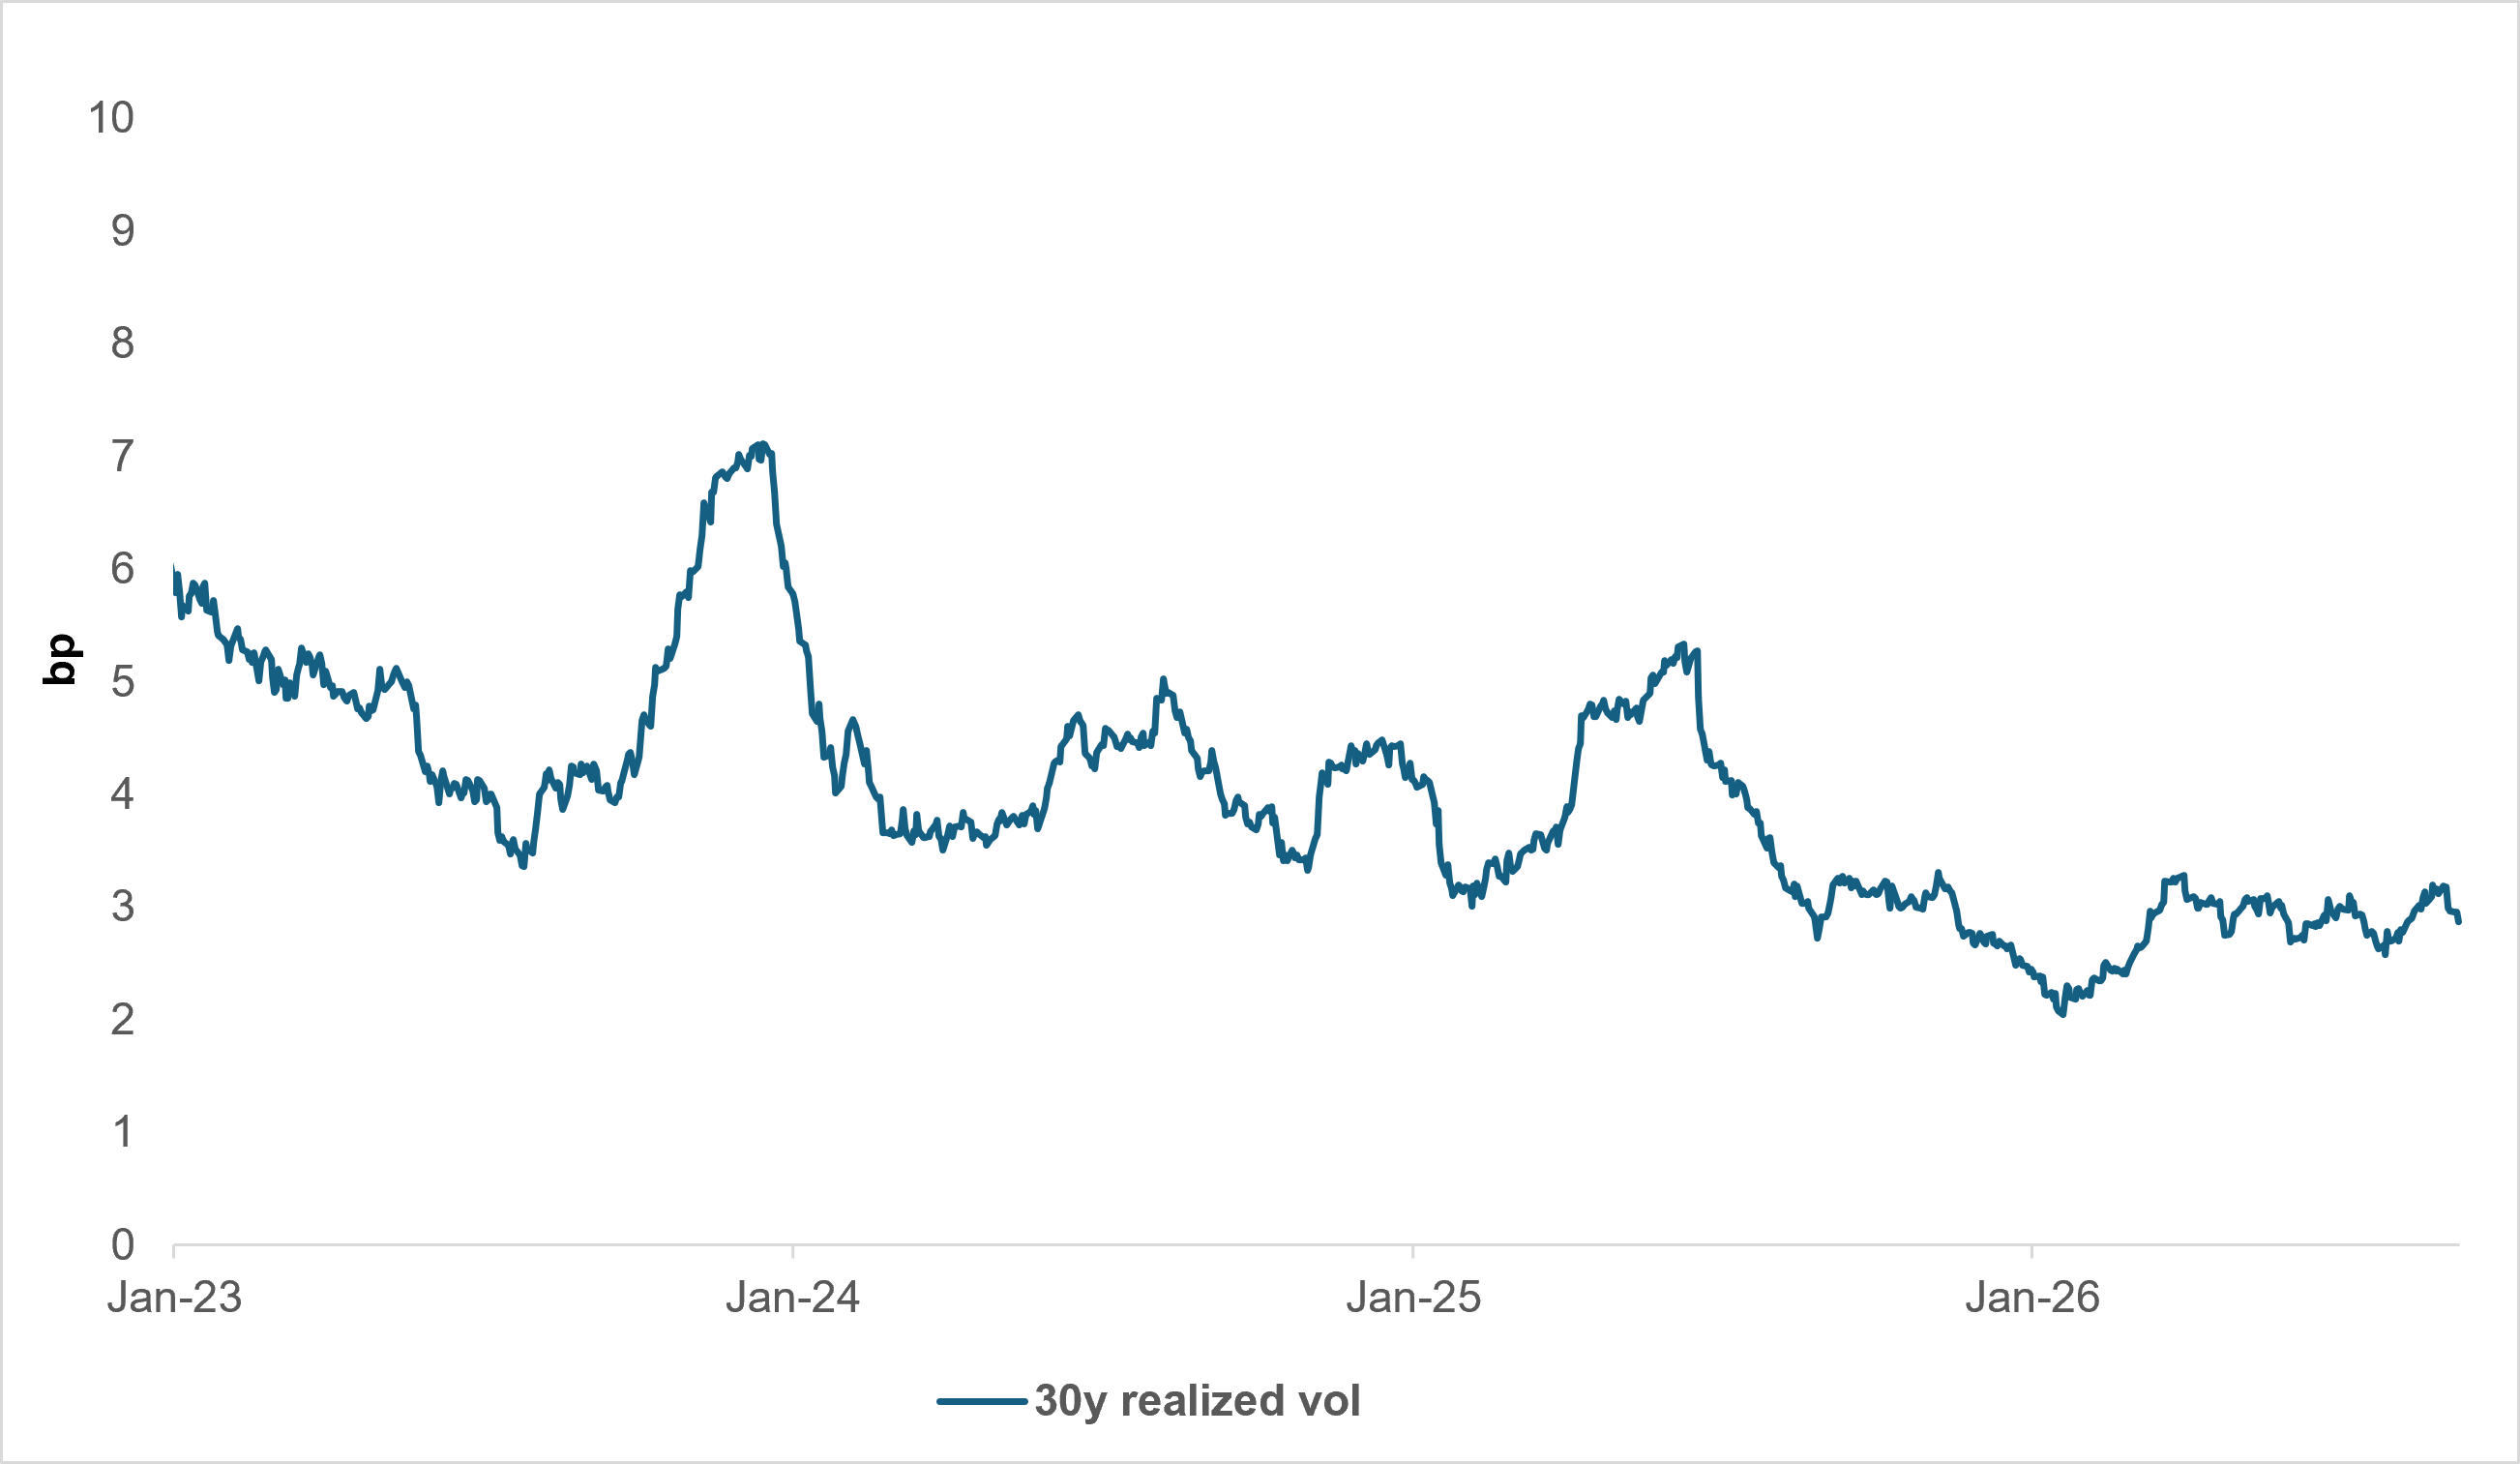
EXHIBIT #3: 30Y REALIZED VOL HAS DECLINED AND REMAINS RANGE-BOUND
Source: Bloomberg
Realized vol tells a similar story: Long-end realized vol has declined since 2023 and has been range-bound for much of the year as shown by Exhibit 3, which measures a 50-day moving average of the daily absolute value change to the 30y in basis points. Notably, implied vol has continued to decline even as realized vol has been range-bound.
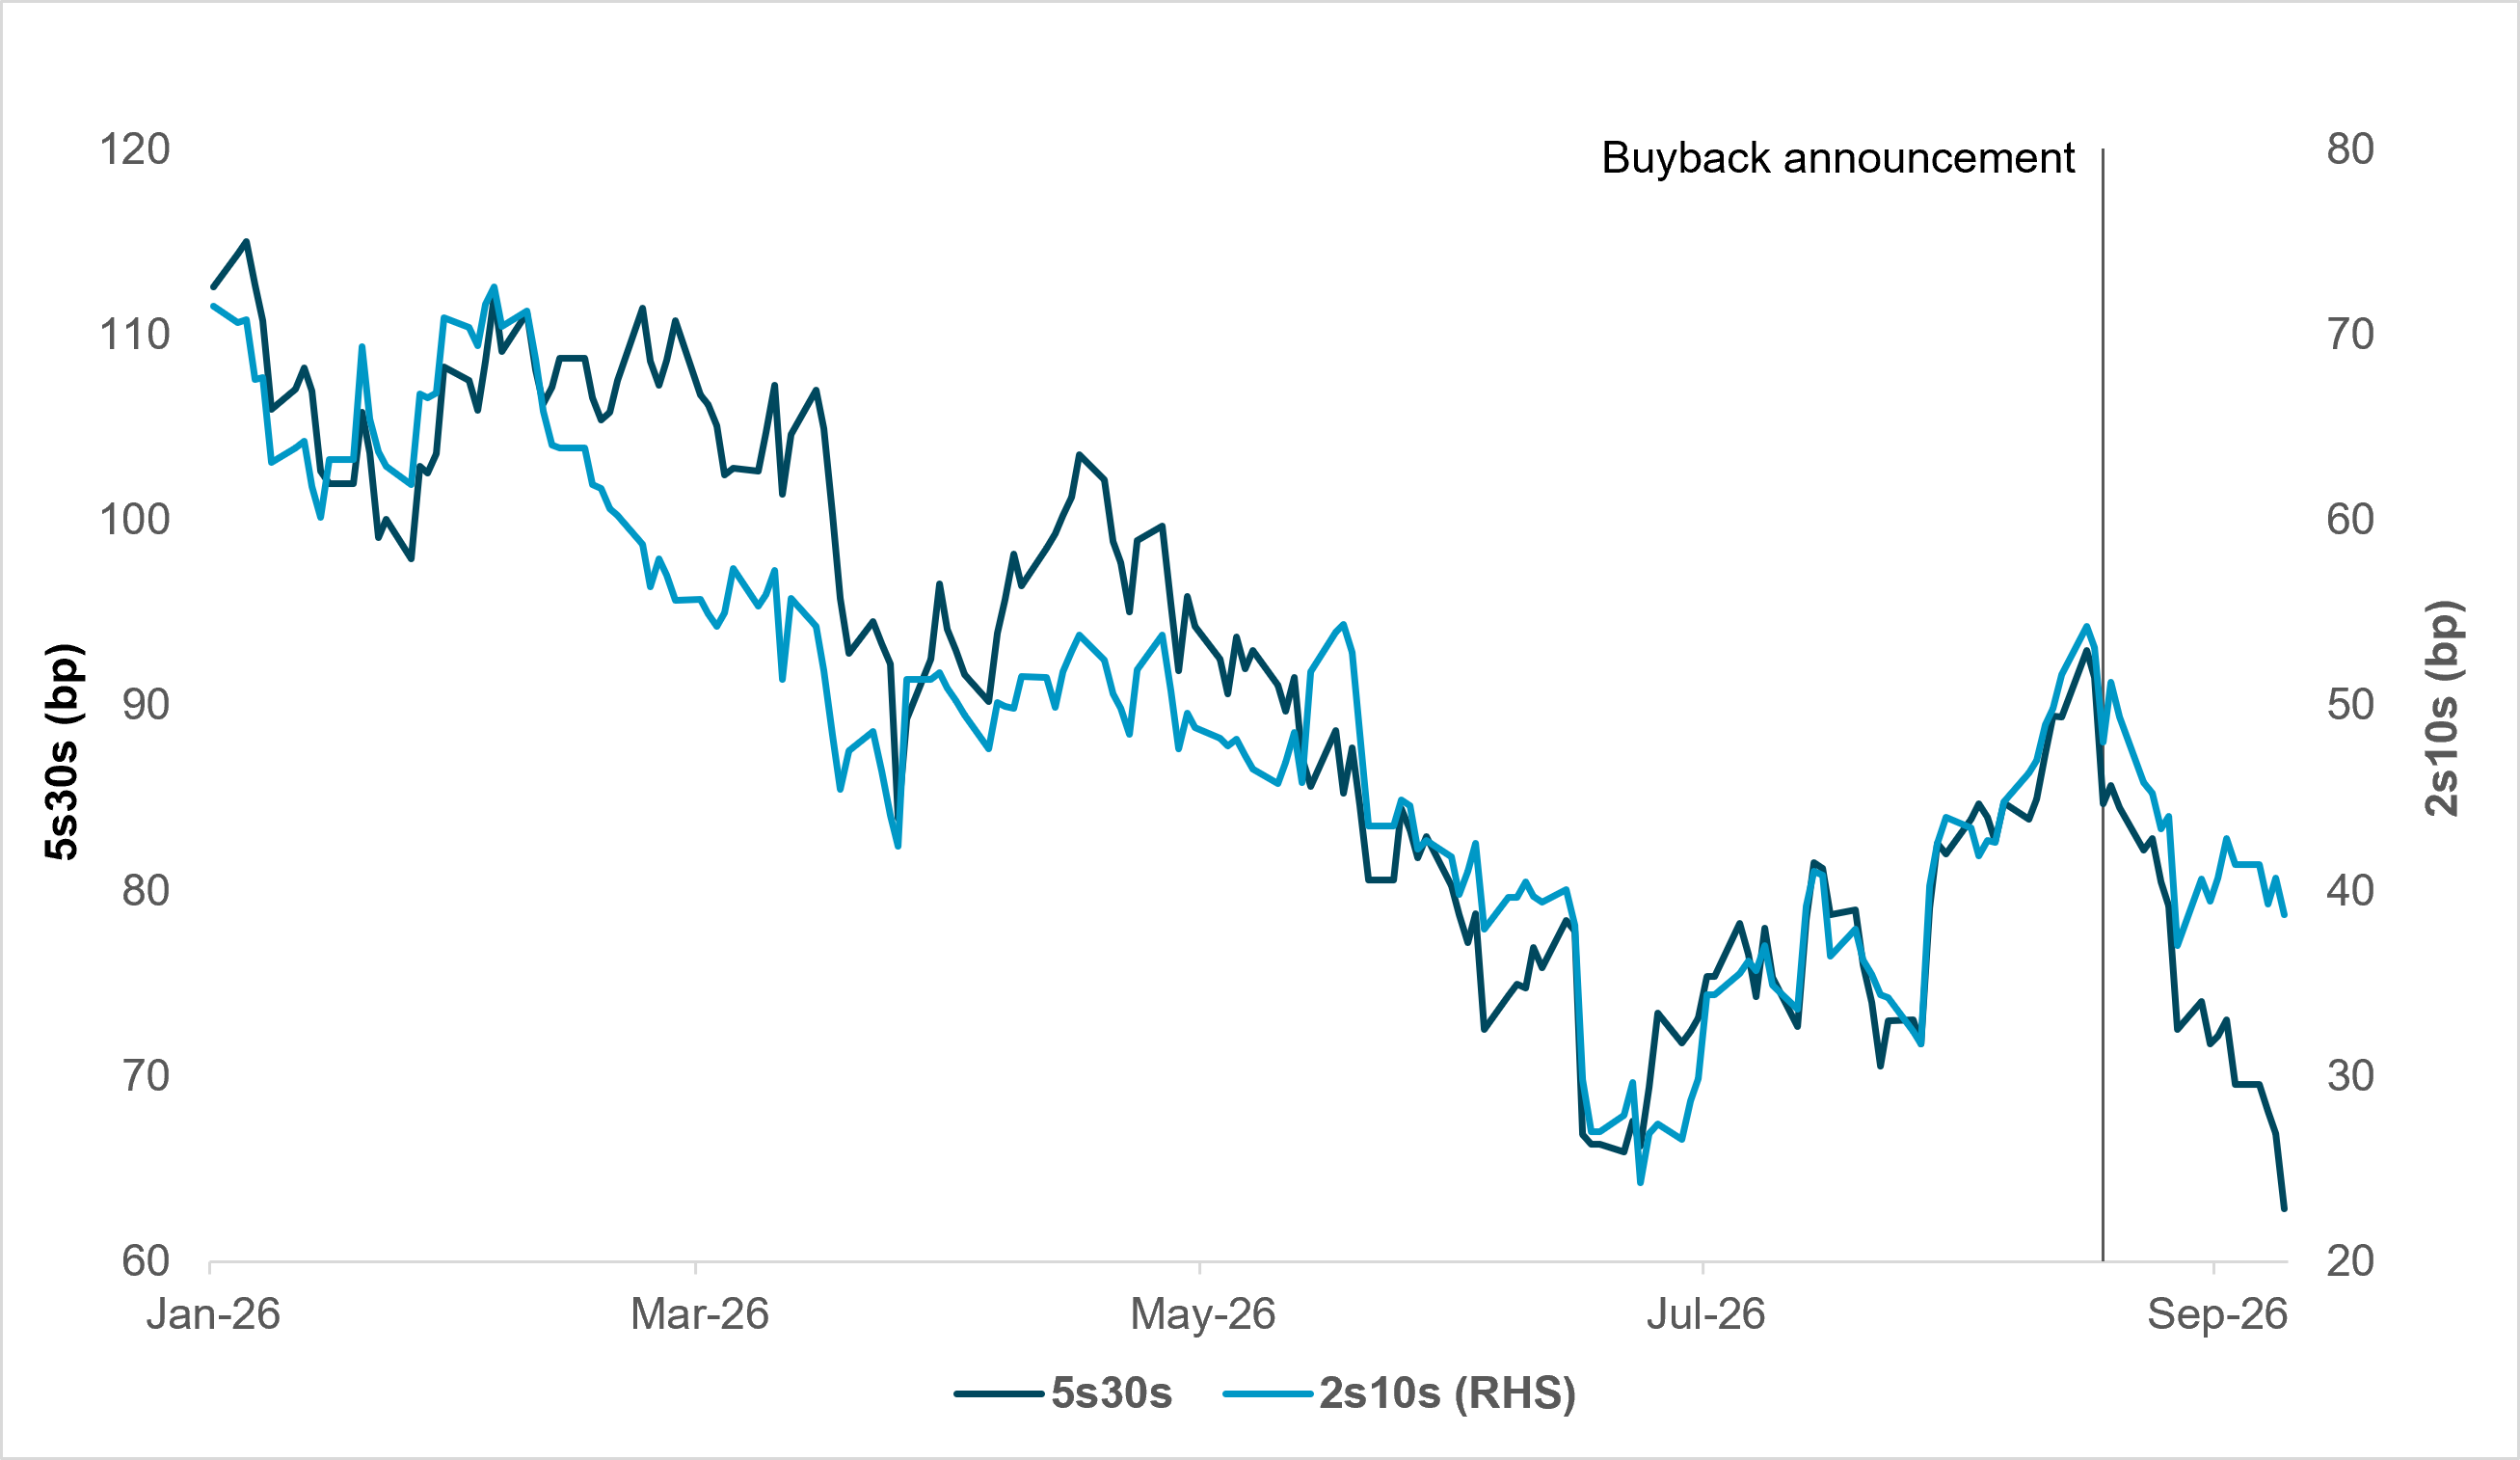
EXHIBIT #4: YIELD CURVE HAS FLATTENED SINCE BUYBACK ANNOUNCEMENT
Source: Bloomberg
The U.S. Treasury Department’s increased use of long-end buybacks appears at first to challenge our case that rate vol will continue to rise.
What the buybacks could accomplish: While containing long-end rate vol isn’t the primary motivation for the elevated buyback initiative, Treasury’s decision to increase long-end buybacks may reduce localized stress in the back end, improve liquidity, and temporarily compress term premium. Though this generally remains to be seen, as Exhibit 4 shows, the curve has flattened and term premium has come off modestly (though choppily) since the initial buyback announcement.
Dealer balance sheets: Liquidity may also improve if dealer balance sheets become less congested as a result of the buybacks. If sustained long-end selling pressure encounters dealer balance sheets that aren’t fully able to absorb the extra supply, price action could become disorderly, particularly around auctions. However much buybacks help, however, depends on the ultimate size of the program. While Treasury announced that the first buyback operation would be up to $6bn, it ultimately purchased less and hasn’t yet provided guidance on the size of subsequent operations, sticking to the original “at least $4bn” commitment.
What the buybacks won’t accomplish: Buybacks won’t address – nor are they designed to – the larger force driving rate vol: less clarity from the Fed. As a result, buybacks are more likely to reshape rate vol rather than fully suppress it.
Likely outcomes: Given that we expect long-end vol to continue to decline and front-end vol to be more dynamic, the most likely outcome is lower risk of a disorderly long-end selloff, but greater uncertainty related to curve shape, policy interpretation, and Treasury intervention expectations. The broader case for higher rate vol can remain intact regardless of whether long-end yields fall or rise more gradually.
Front-end vs. long-end vol: If buybacks are working, long-end vol should continue to ease relative to front-end vol. Compare front-end implied vol like 3m2y or 3m5y against long-end implied vol, most notably the 3m30y (Exhibit 2).
Curve volatility: Watch 5s30s and 2s10s (Exhibit 4). If outright 30y yields calm but the curve becomes less stable, that would support the idea that buybacks are reshaping vol rather than suppressing it outright.
MOVE Index: If the long-end settles somewhat but the broader MOVE index starts rising again (Exhibit 1), that would suggest the structural rate vol thesis remains intact.
Fed communication: If guidance remains sparse and markets continue to infer the policy path from volatile incoming data, the broader case for elevated rate vol should remain alive.