Hyperscaler issuance tests long-end UST demand
iFlow > Special Report

David Tam
Time to Read: 6 minutes
Crowding at the margin: Record issuance of long-duration IG credit by hyperscalers may be modestly affecting marginal investor demand for long-end U.S. Treasurys. Some demand indicators for long-end USTs have softened even as credit spreads stay extremely tight and IG issuance hits record highs. Metrics we use as directional proxies for marginal demand – such as bid-to-cover ratios for Treasury auctions and IG book coverage ratios – suggest that strong hyperscaler demand has coincided with some moderation in Treasury demand. Hyperscaler issuance patterns also indicate awareness of broader long-duration market capacity constraints.
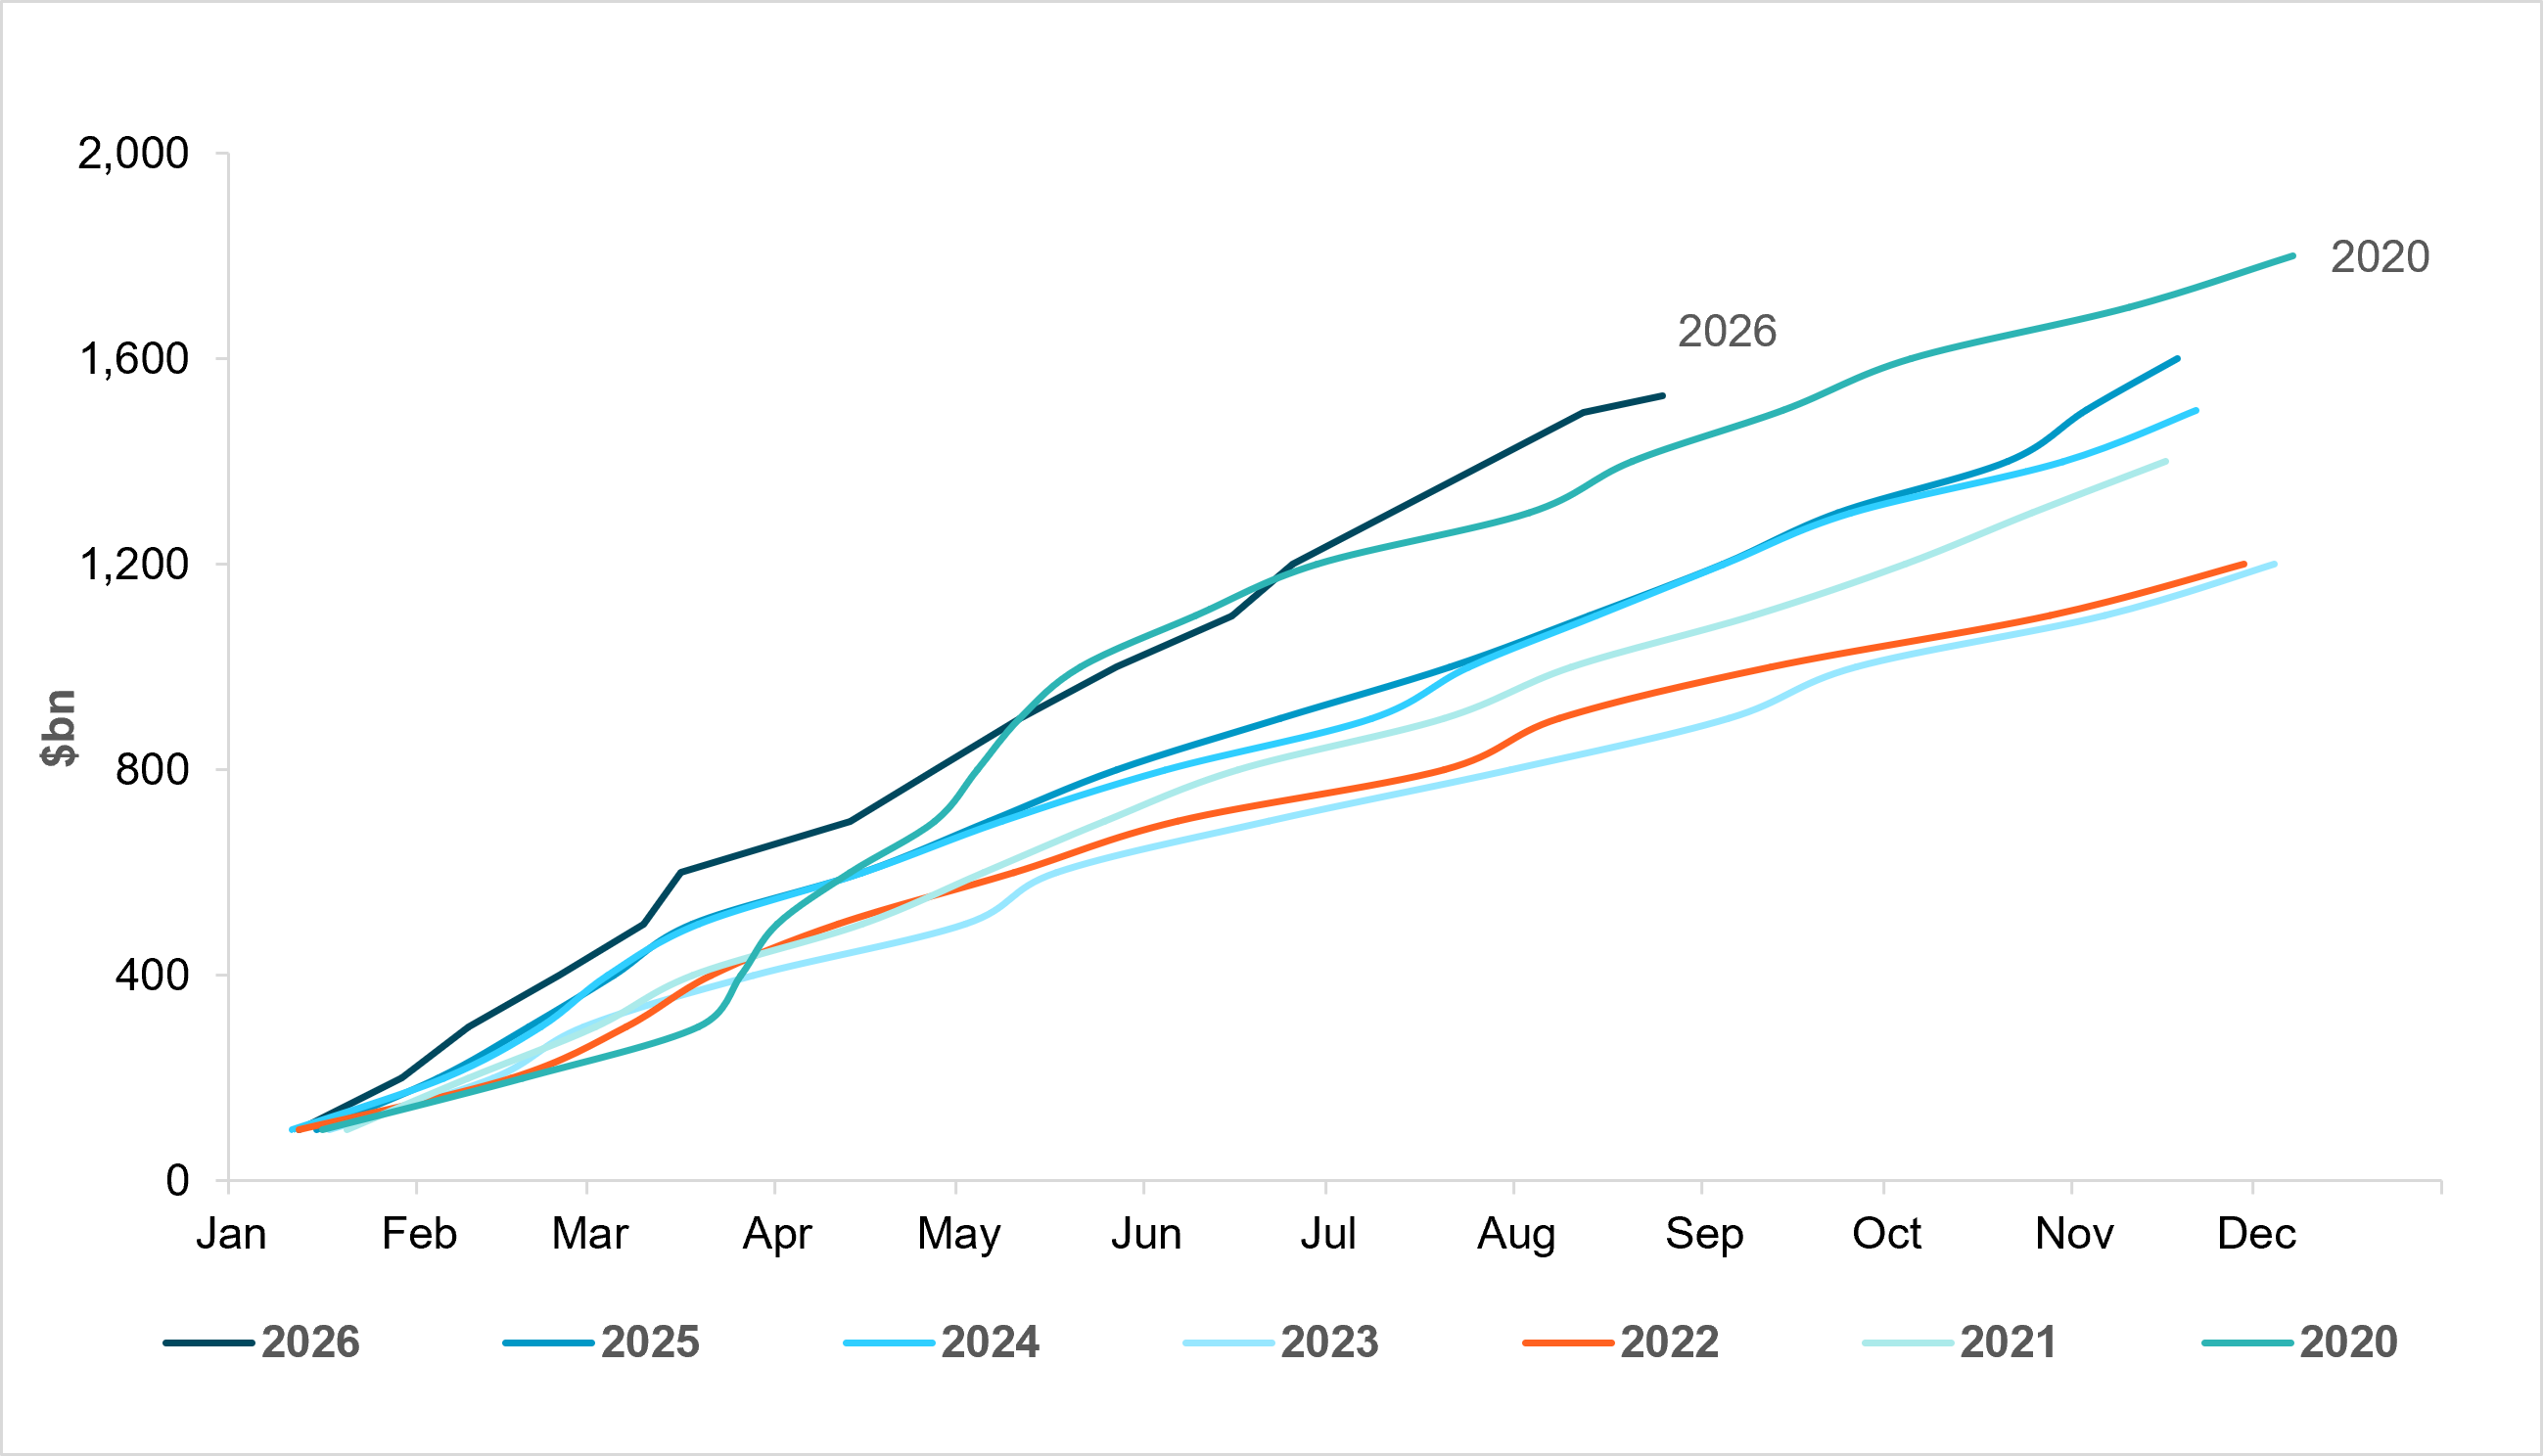
EXHIBIT #1: 2026 IG ISSUANCE IS GREATER THAN IN ANY YEAR ON RECORD
Source: BNY
Unprecedented IG issuance: Record IG issuance has been driven by hyperscaler issuance in the long end. Total IG issuance now exceeds $1.5tn, with hyperscalers representing over 12% of this figure. Their voracious cash demand to fund the AI capex buildout has pushed these price-insensitive borrowers to issue at longer-duration tenors to fully fund themselves. Their issuance is adding to an already heavy long-end supply backdrop alongside UST issuance.
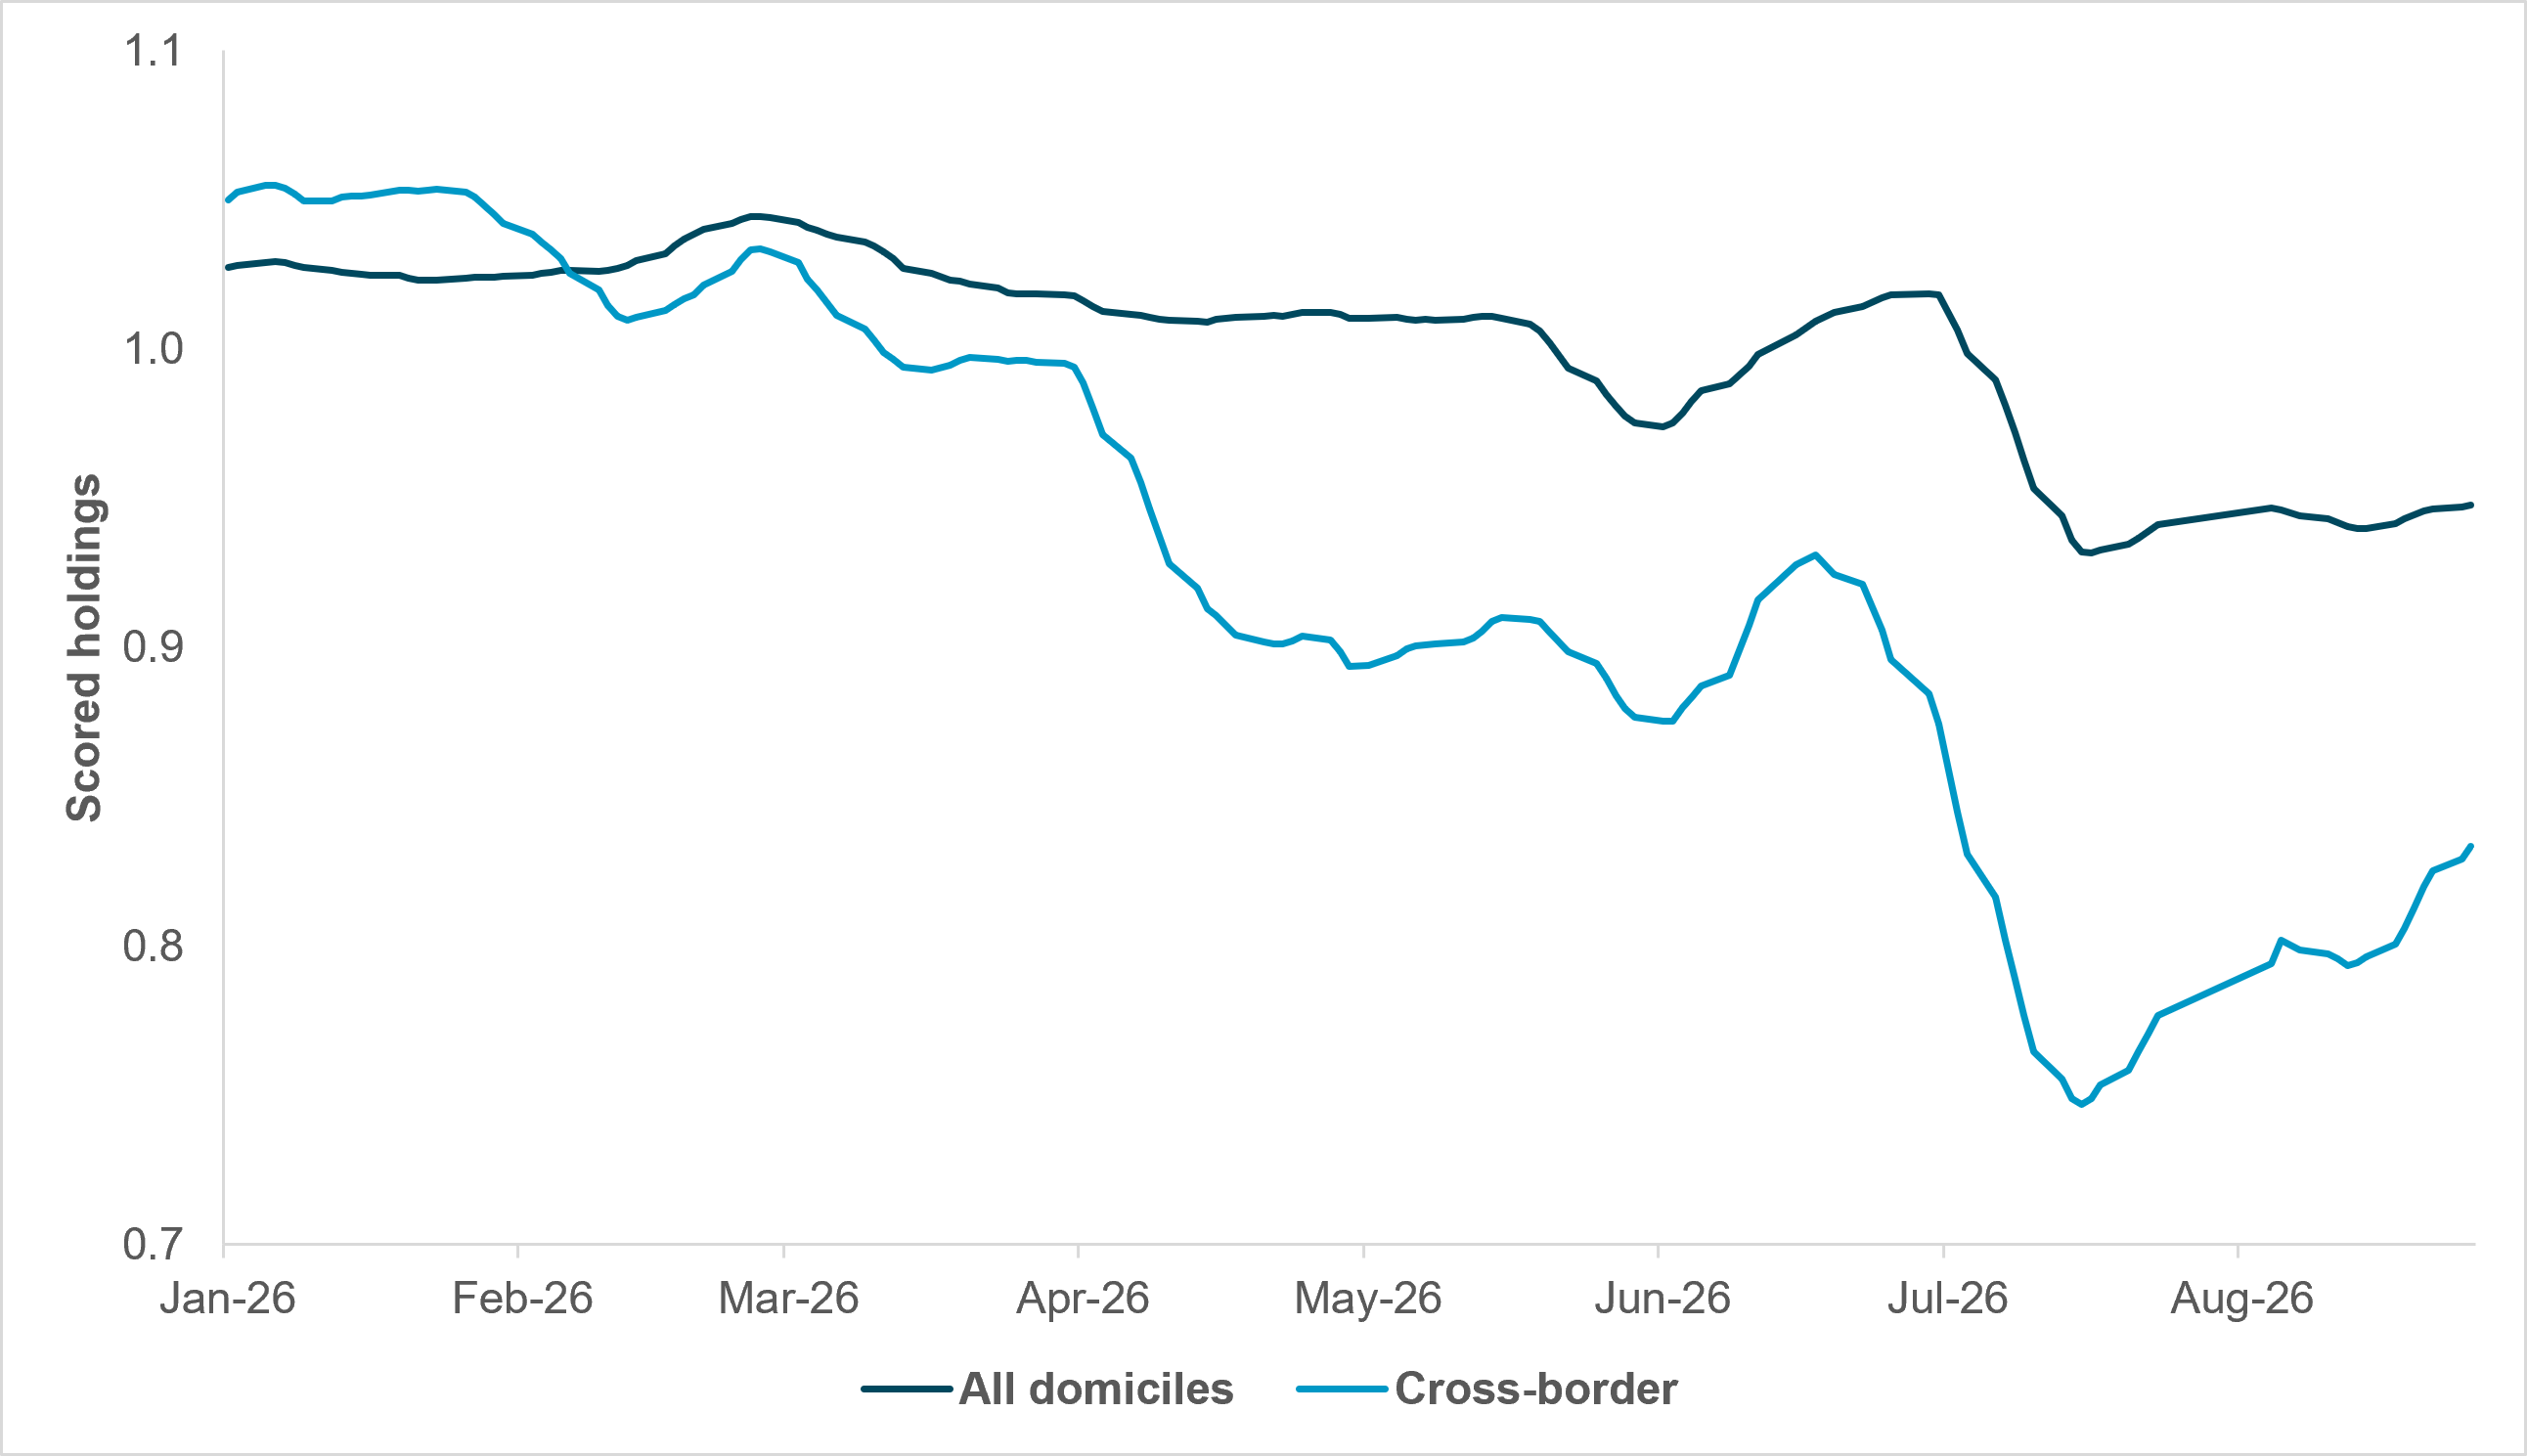
EXHIBIT #2: SCORED HOLDINGS OF LONG-END USTS HAVE DECLINED
Source: BNY
Cross-border holdings of Treasurys decline: After starting the year above their 12-month levels, scored holdings of long-end UST have declined as IG issuance surged. The bulk of the decline in scored holdings began in the middle of June and continued through the summer, as seen in Exhibit 2. In the late summer, UST holdings staged a bit of a comeback, driven by domestic investor holdings.
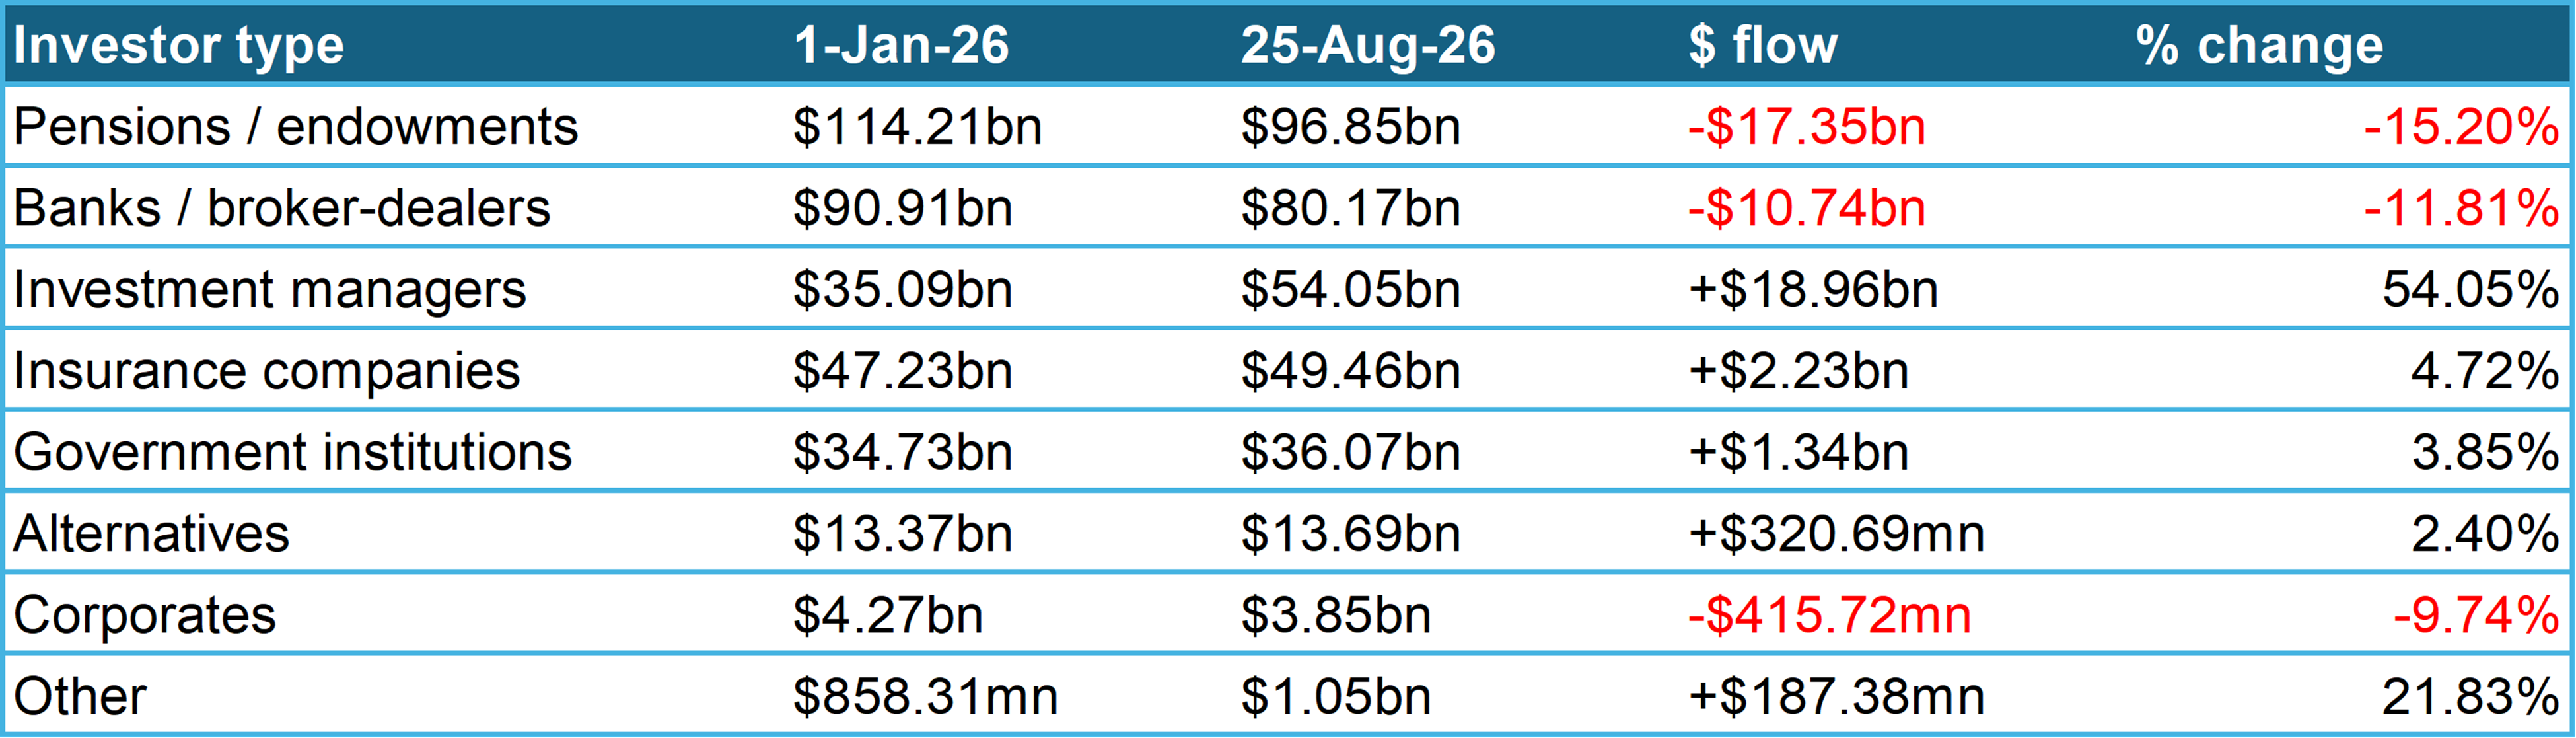
EXHIBIT #3: PENSIONS, ENDOWMENTS, AND OTHER ASSET OWNERS, BANKS, AND CORPORATES ARE REDUCING TREASURY HOLDINGS
Source: BNY
Reduced demand: The two largest segments of long-end Treasury holders – pensions, endowments, and other asset owners, and banks and broker-dealers – pared back their holdings in 2026. Corporates, which represent a much smaller share, also reduced their holdings.
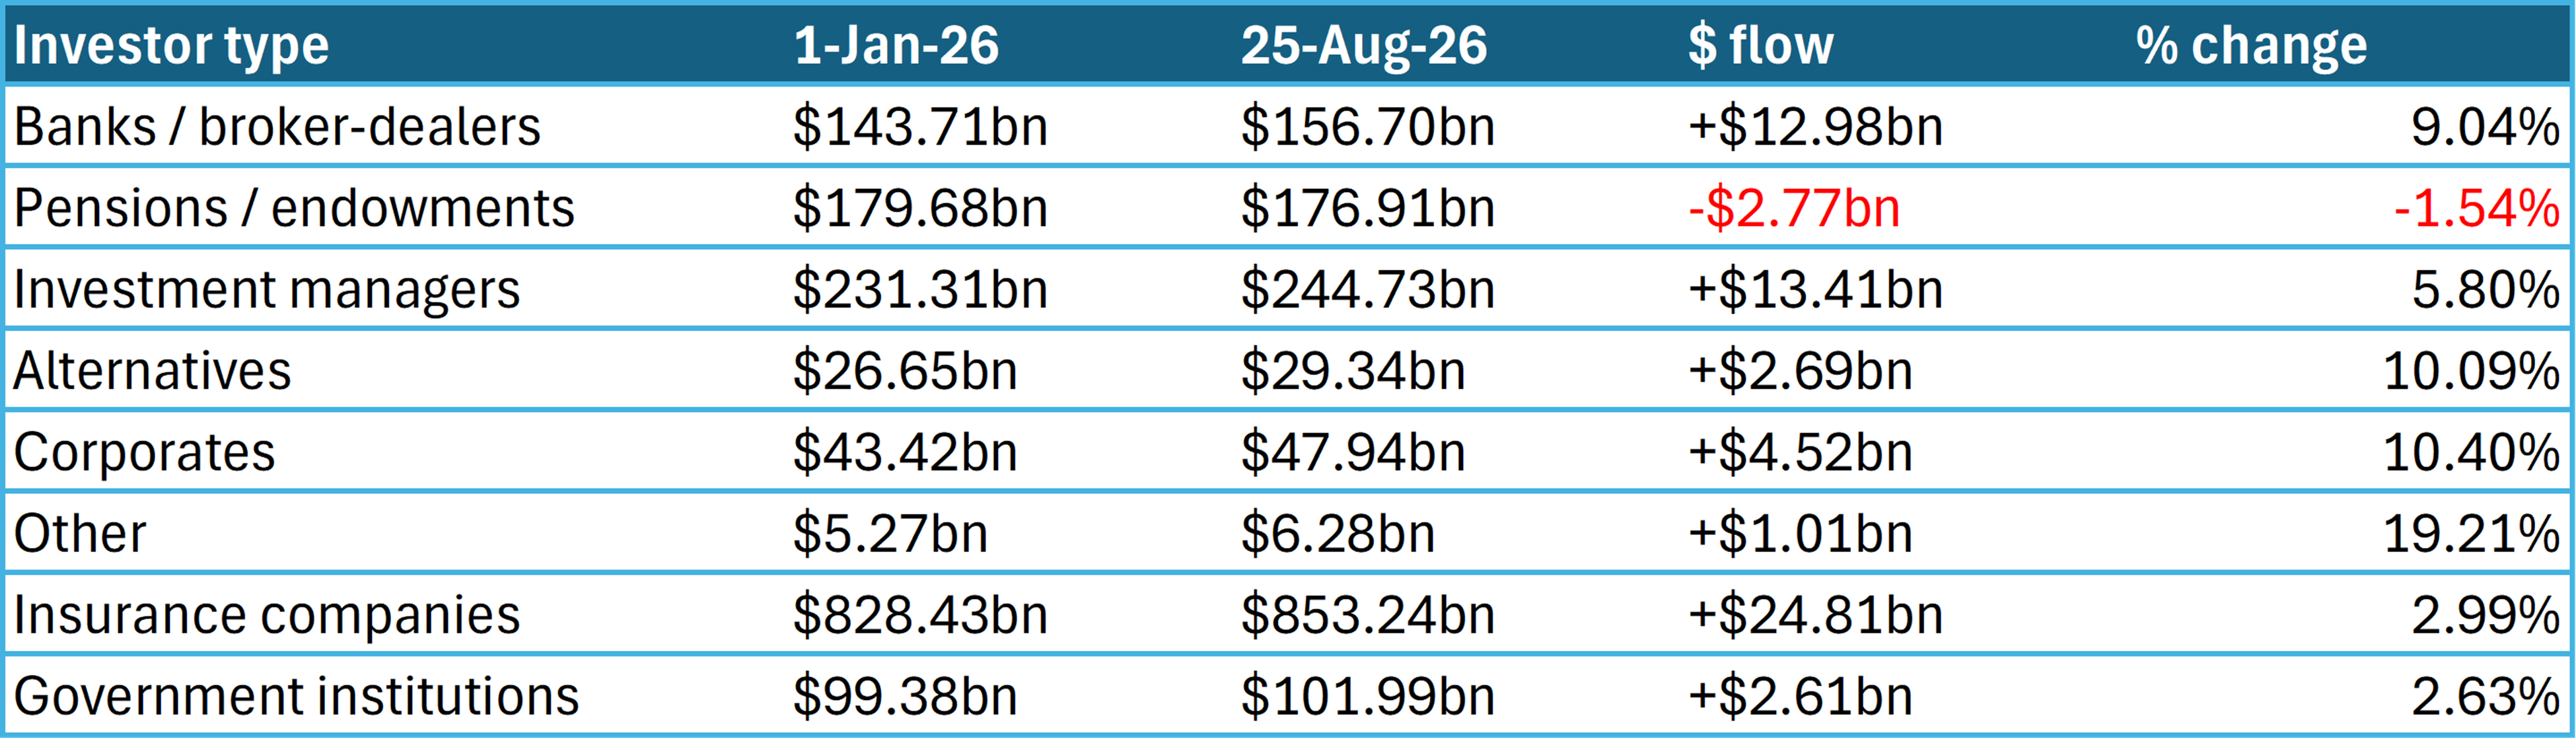
EXHIBIT #4: ALL BUT ONE INVESTOR CLASS HAVE INCREASED IG HOLDINGS
Source: BNY
Most investors increase credit holdings: By contrast, every investor class except pensions, endowments, and other asset owners increased IG credit holdings. Banks are a clear example: at the same time that they were reducing Treasury holdings by 12%, they increased IG credit holdings by 9%. These cross-currents suggest that investors are rotating on the margin from Treasurys to credit in the face of significant issuance and attractive yields.
Bank hedging dynamics: In the case of banks and broker-dealers, credit issuance will often cause them to mechanically sell Treasurys so that they remain duration neutral and capture the spread of credit over the Treasury of the same tenor.
Broader Treasury demand is still resilient: There is no broad cause for alarm yet. Other investor types continue to increase their Treasury holdings, most notably investment managers, who increased their holdings by over 50% off a relatively smaller base.
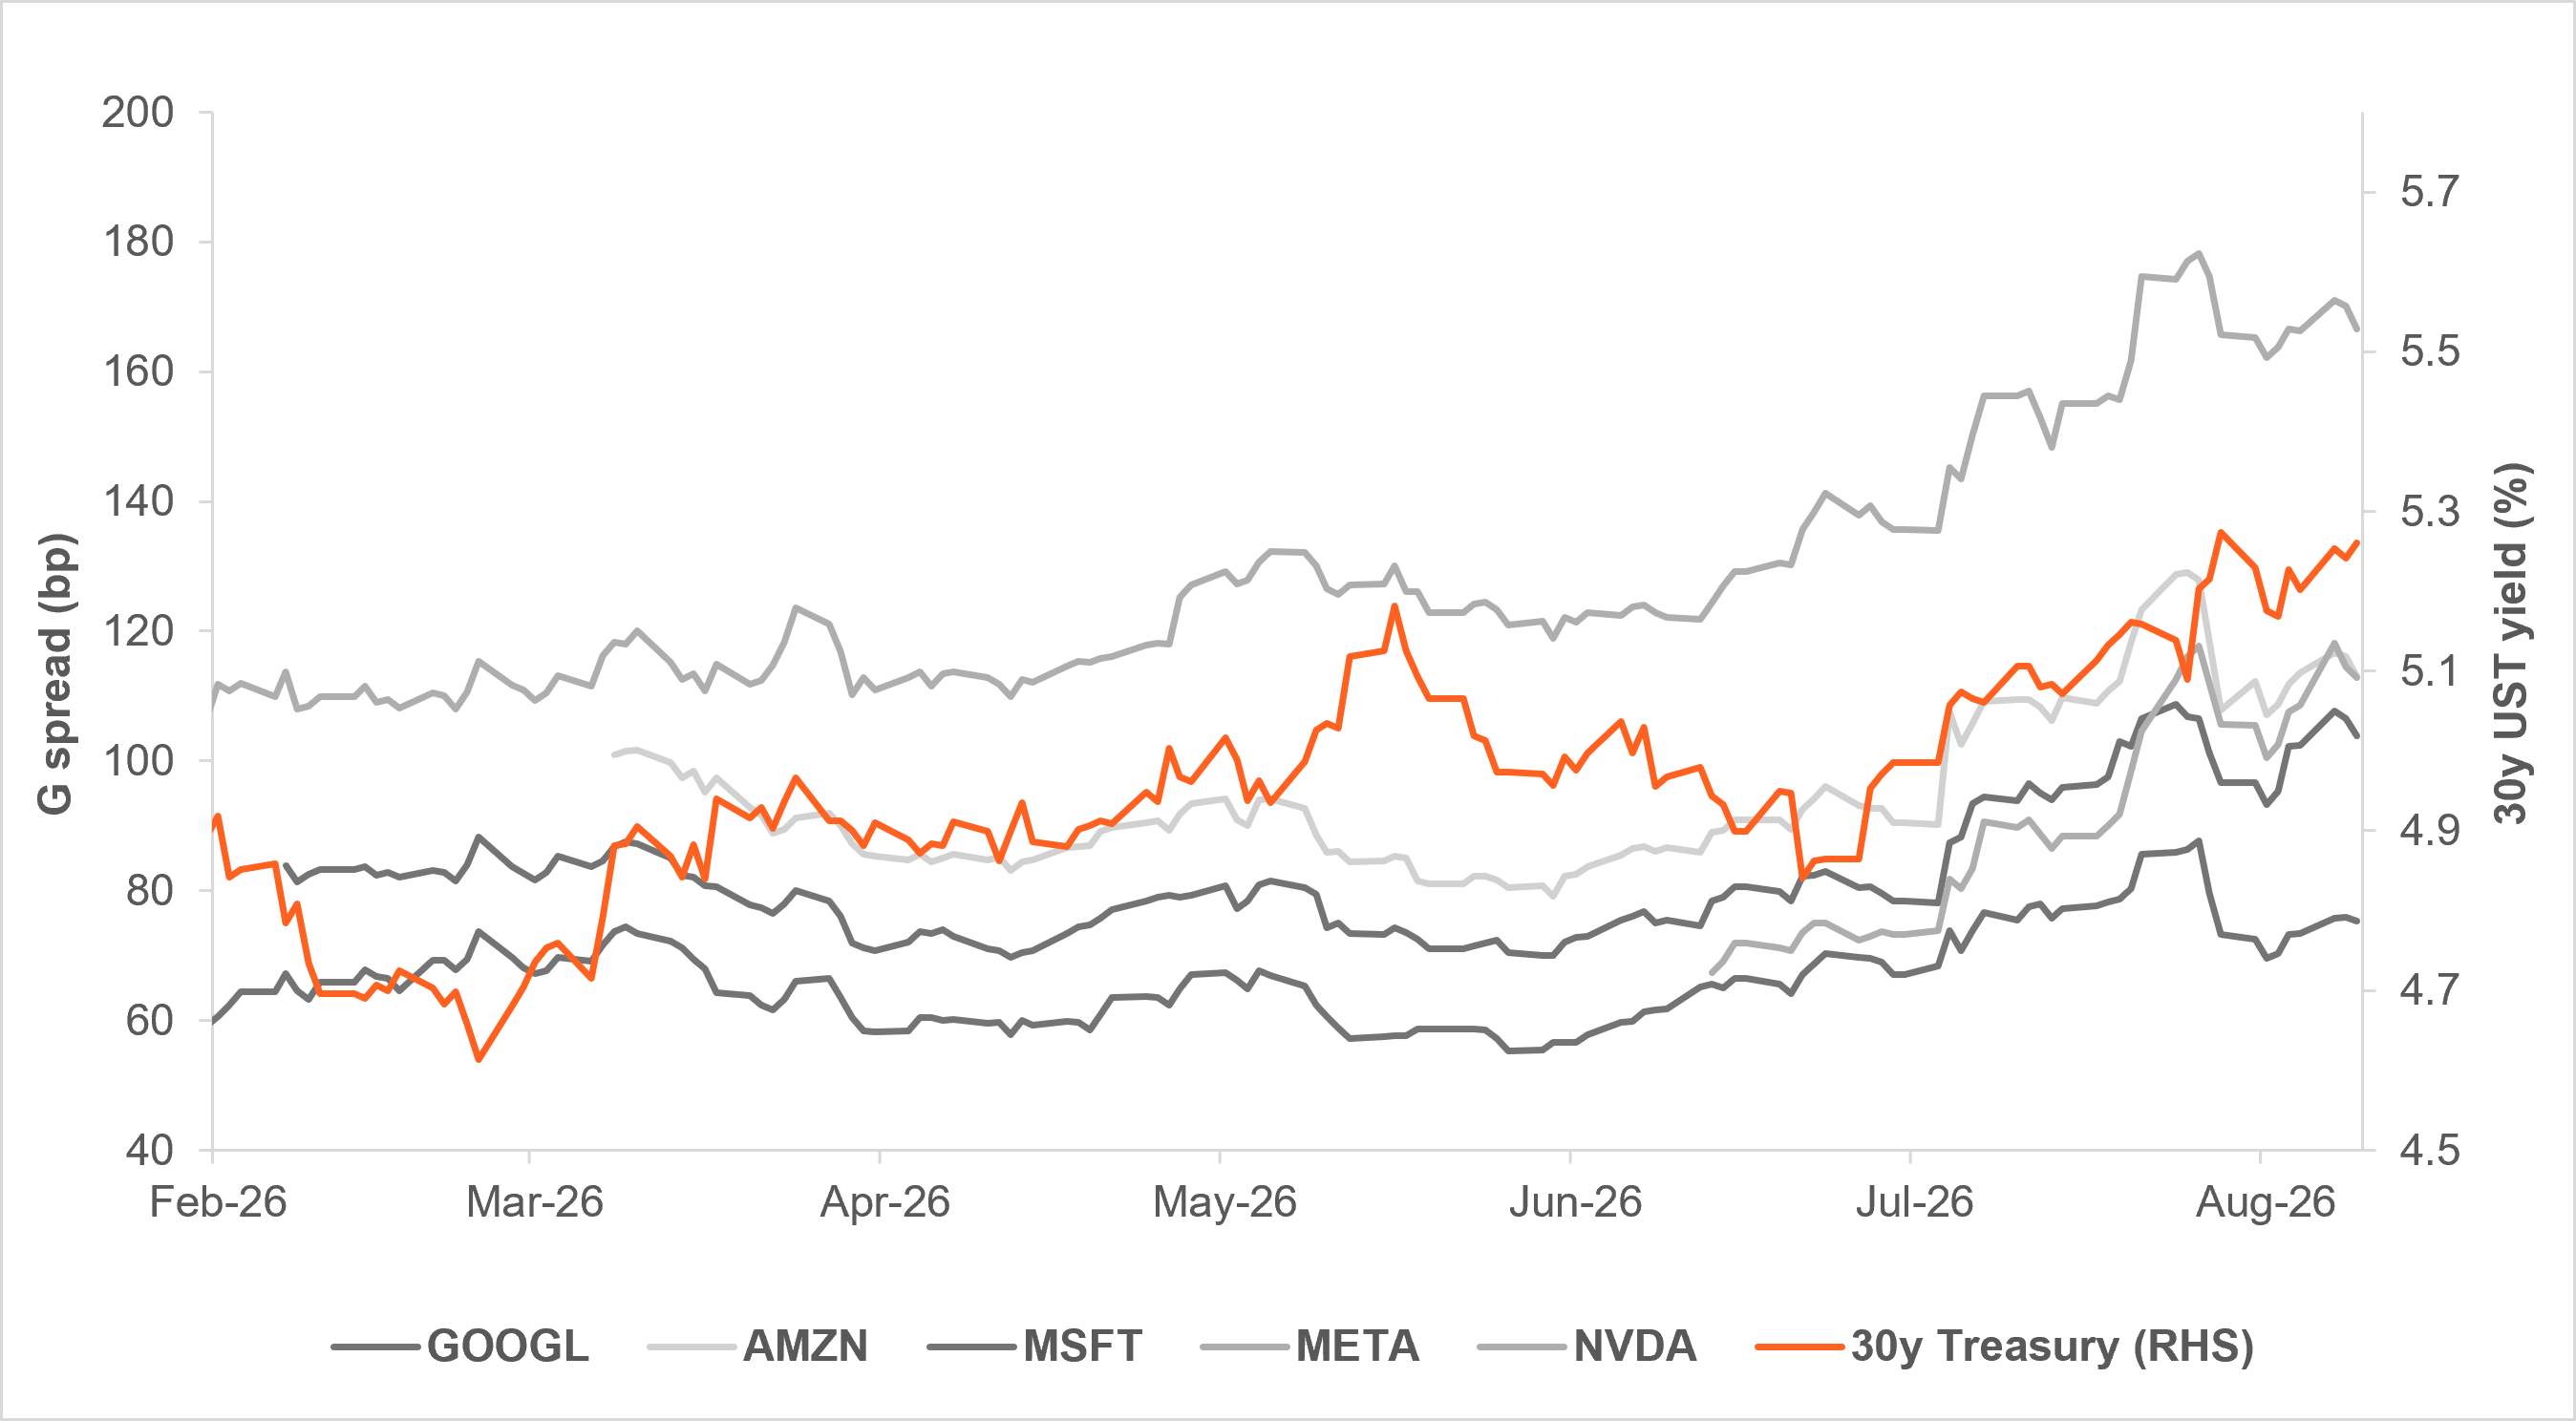
EXHIBIT #5: 30Y UST YIELDS ROSE, WHILE 30Y HYPERSCALER CREDIT SPREADS WIDENED
Source: Bloomberg
UST yield rose as credit spread widened: Starting in late June, around the same time long-end Treasury holdings started to decline, yields also moved higher and 30y hyperscaler credit spreads widened. As Exhibit 5 shows, the rise in yields and the widening in spreads moved in parallel, suggesting that even as the preferences of select investors shifted modestly toward credit, the yields they’re demanding on all long-duration papers are increasing.
Greater issuance, wider spreads: Typically, as anticipation for issuance grows, secondary market credit spreads from the same issuer will drift wider in sympathy. Given the seemingly unending stream of hyperscaler issuance through the year, it’s reasonable to think that some of the widening comes from investors expecting greater yield so that they’re not immediately burned by hyperscalers returning to market.
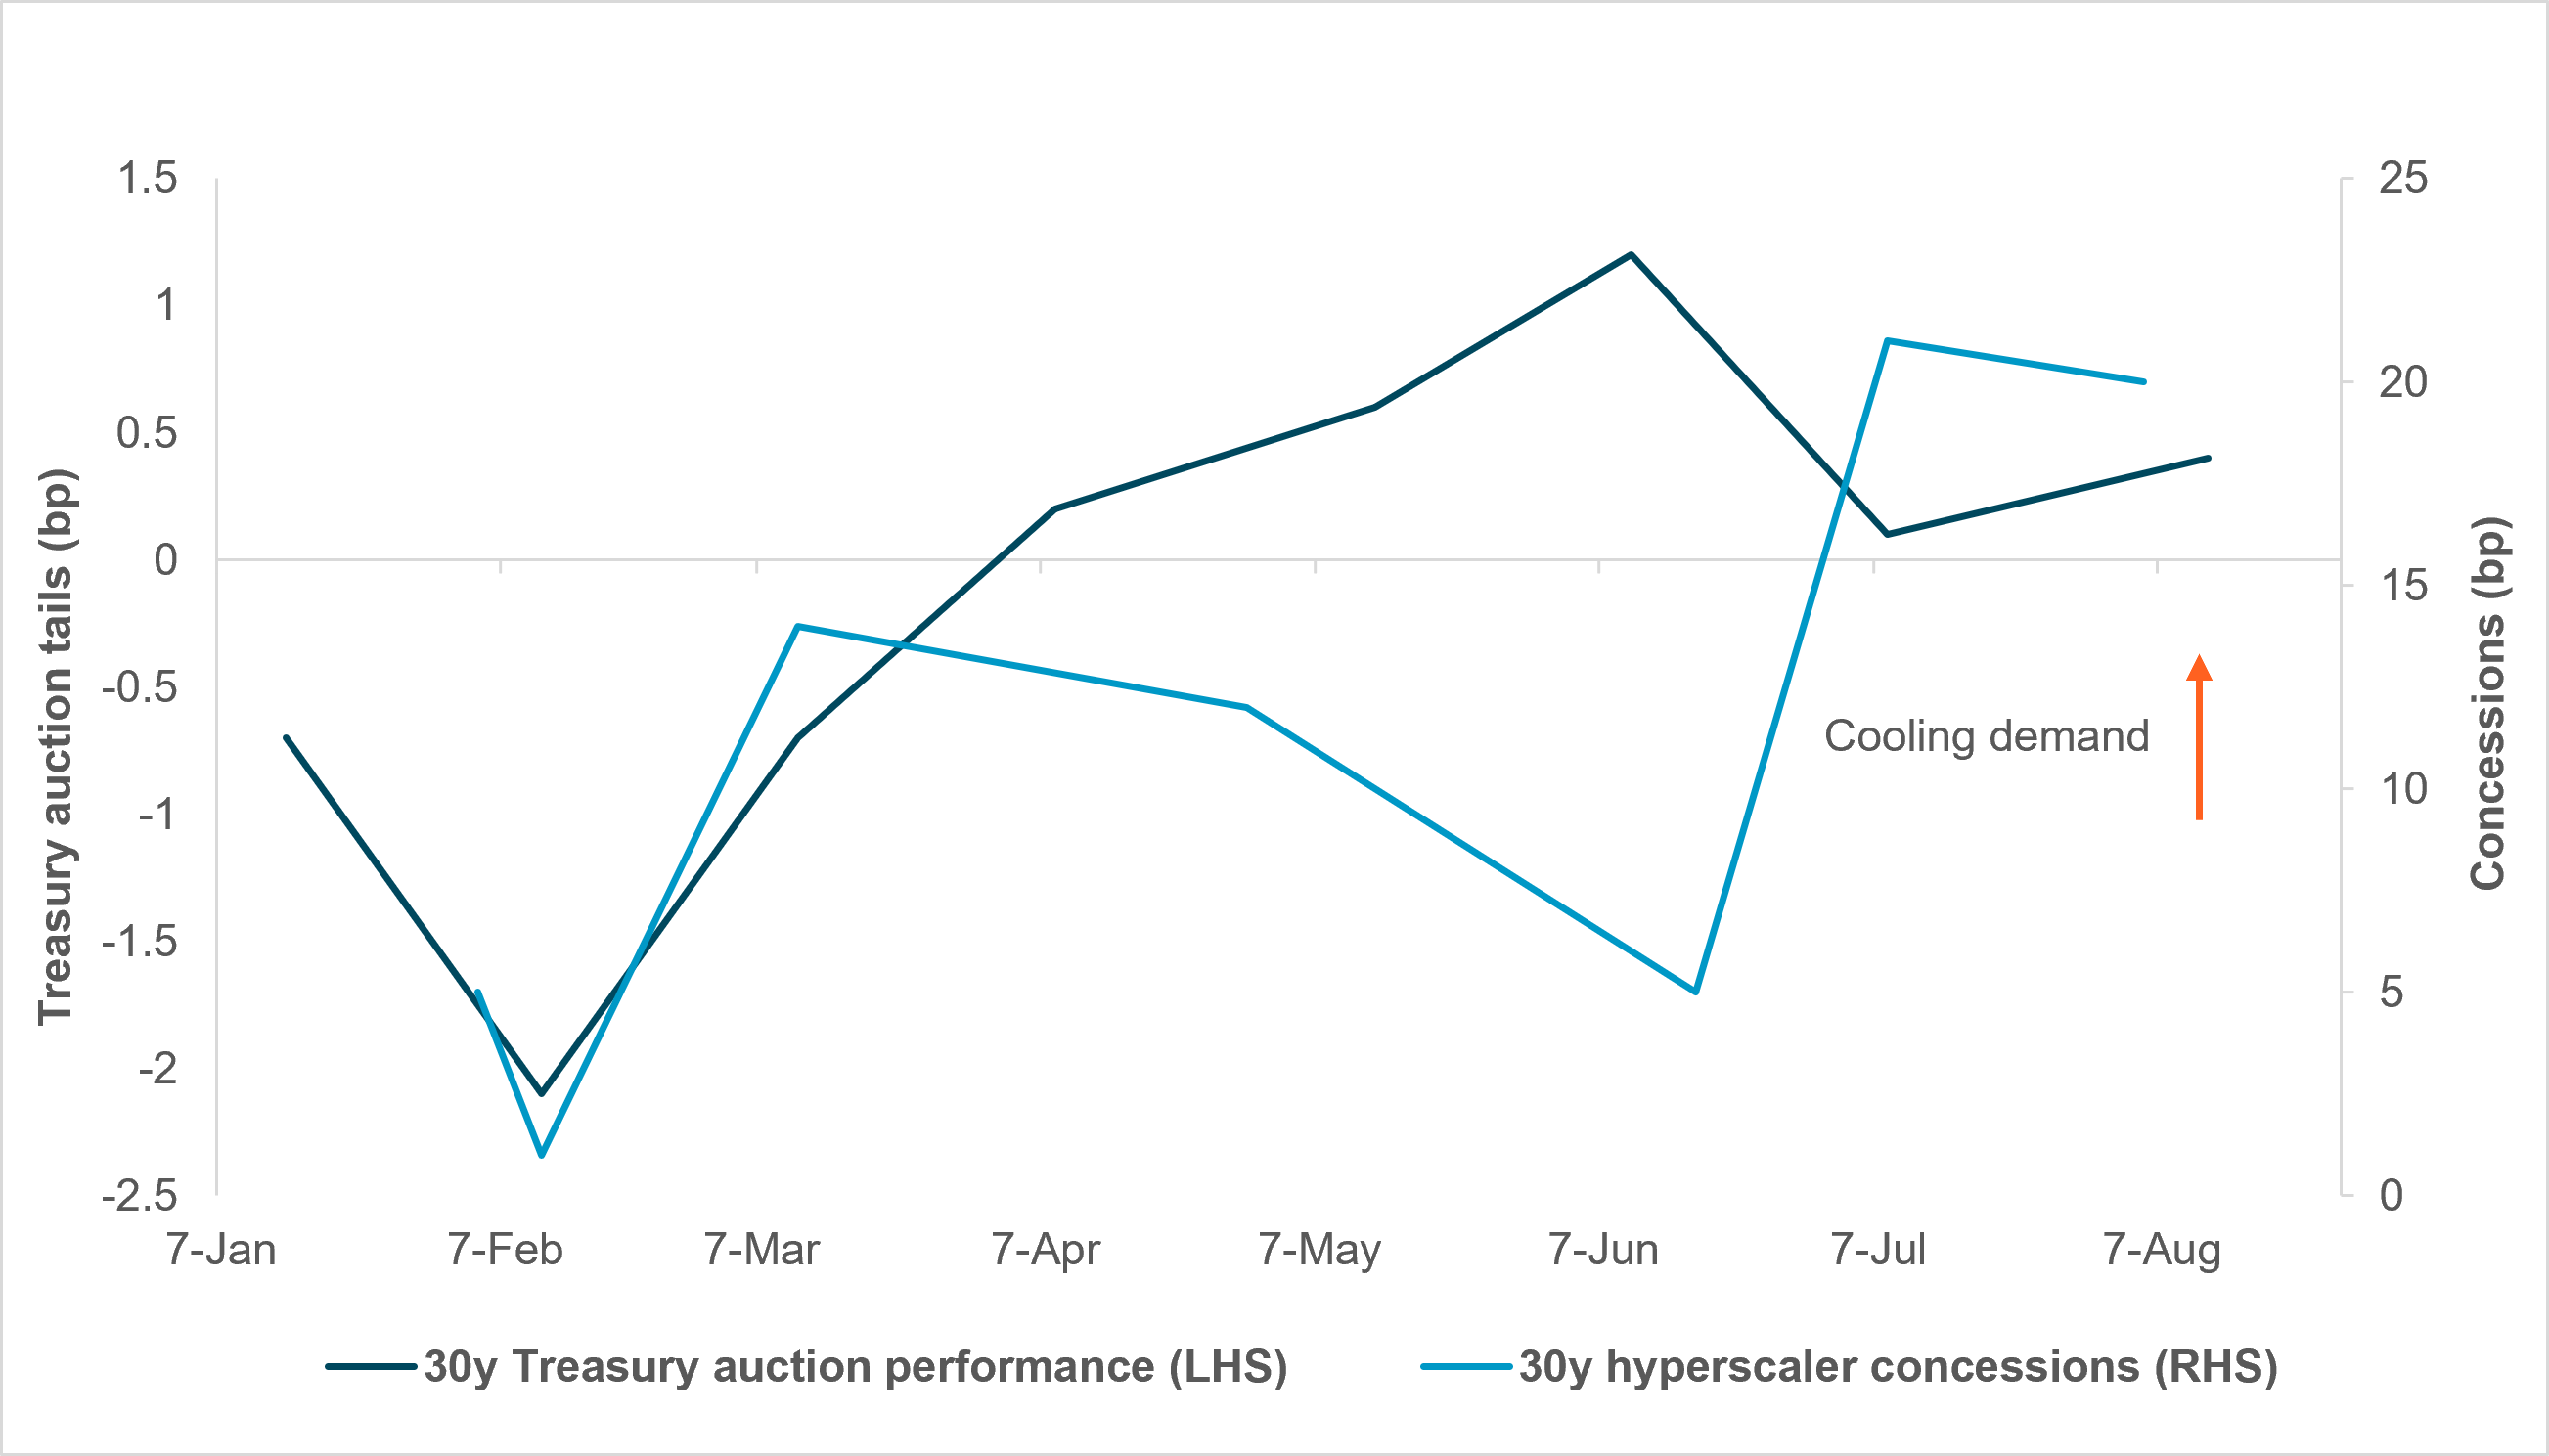
EXHIBIT #6: RISING AUCTION TAILS AND CONCESSIONS
Source: BNY, Bloomberg
Greater IG concessions: Reduced marginal demand for new long-duration paper also emerged over the summer. As the year progressed, concessions for hyperscalers’ newly issued, long-end credit rose meaningfully. As shown by the light blue line in Exhibit 6, Nvidia’s mid-June issuance only saw 5bp of concession, while Amazon’s early July and Google’s early August issuance both exceeded 20bp of concessions, the most meaningful levels among long-duration hyperscaler issuance in 2026.
Weaker auction results at the margin: A similar though less dramatic pattern has emerged in bid-to-cover ratios for 30y Treasury auctions. After showing significant demand in the beginning of the year with auctions stopping through when-issued levels, the 30y auctions have tailed when-issued levels since April.
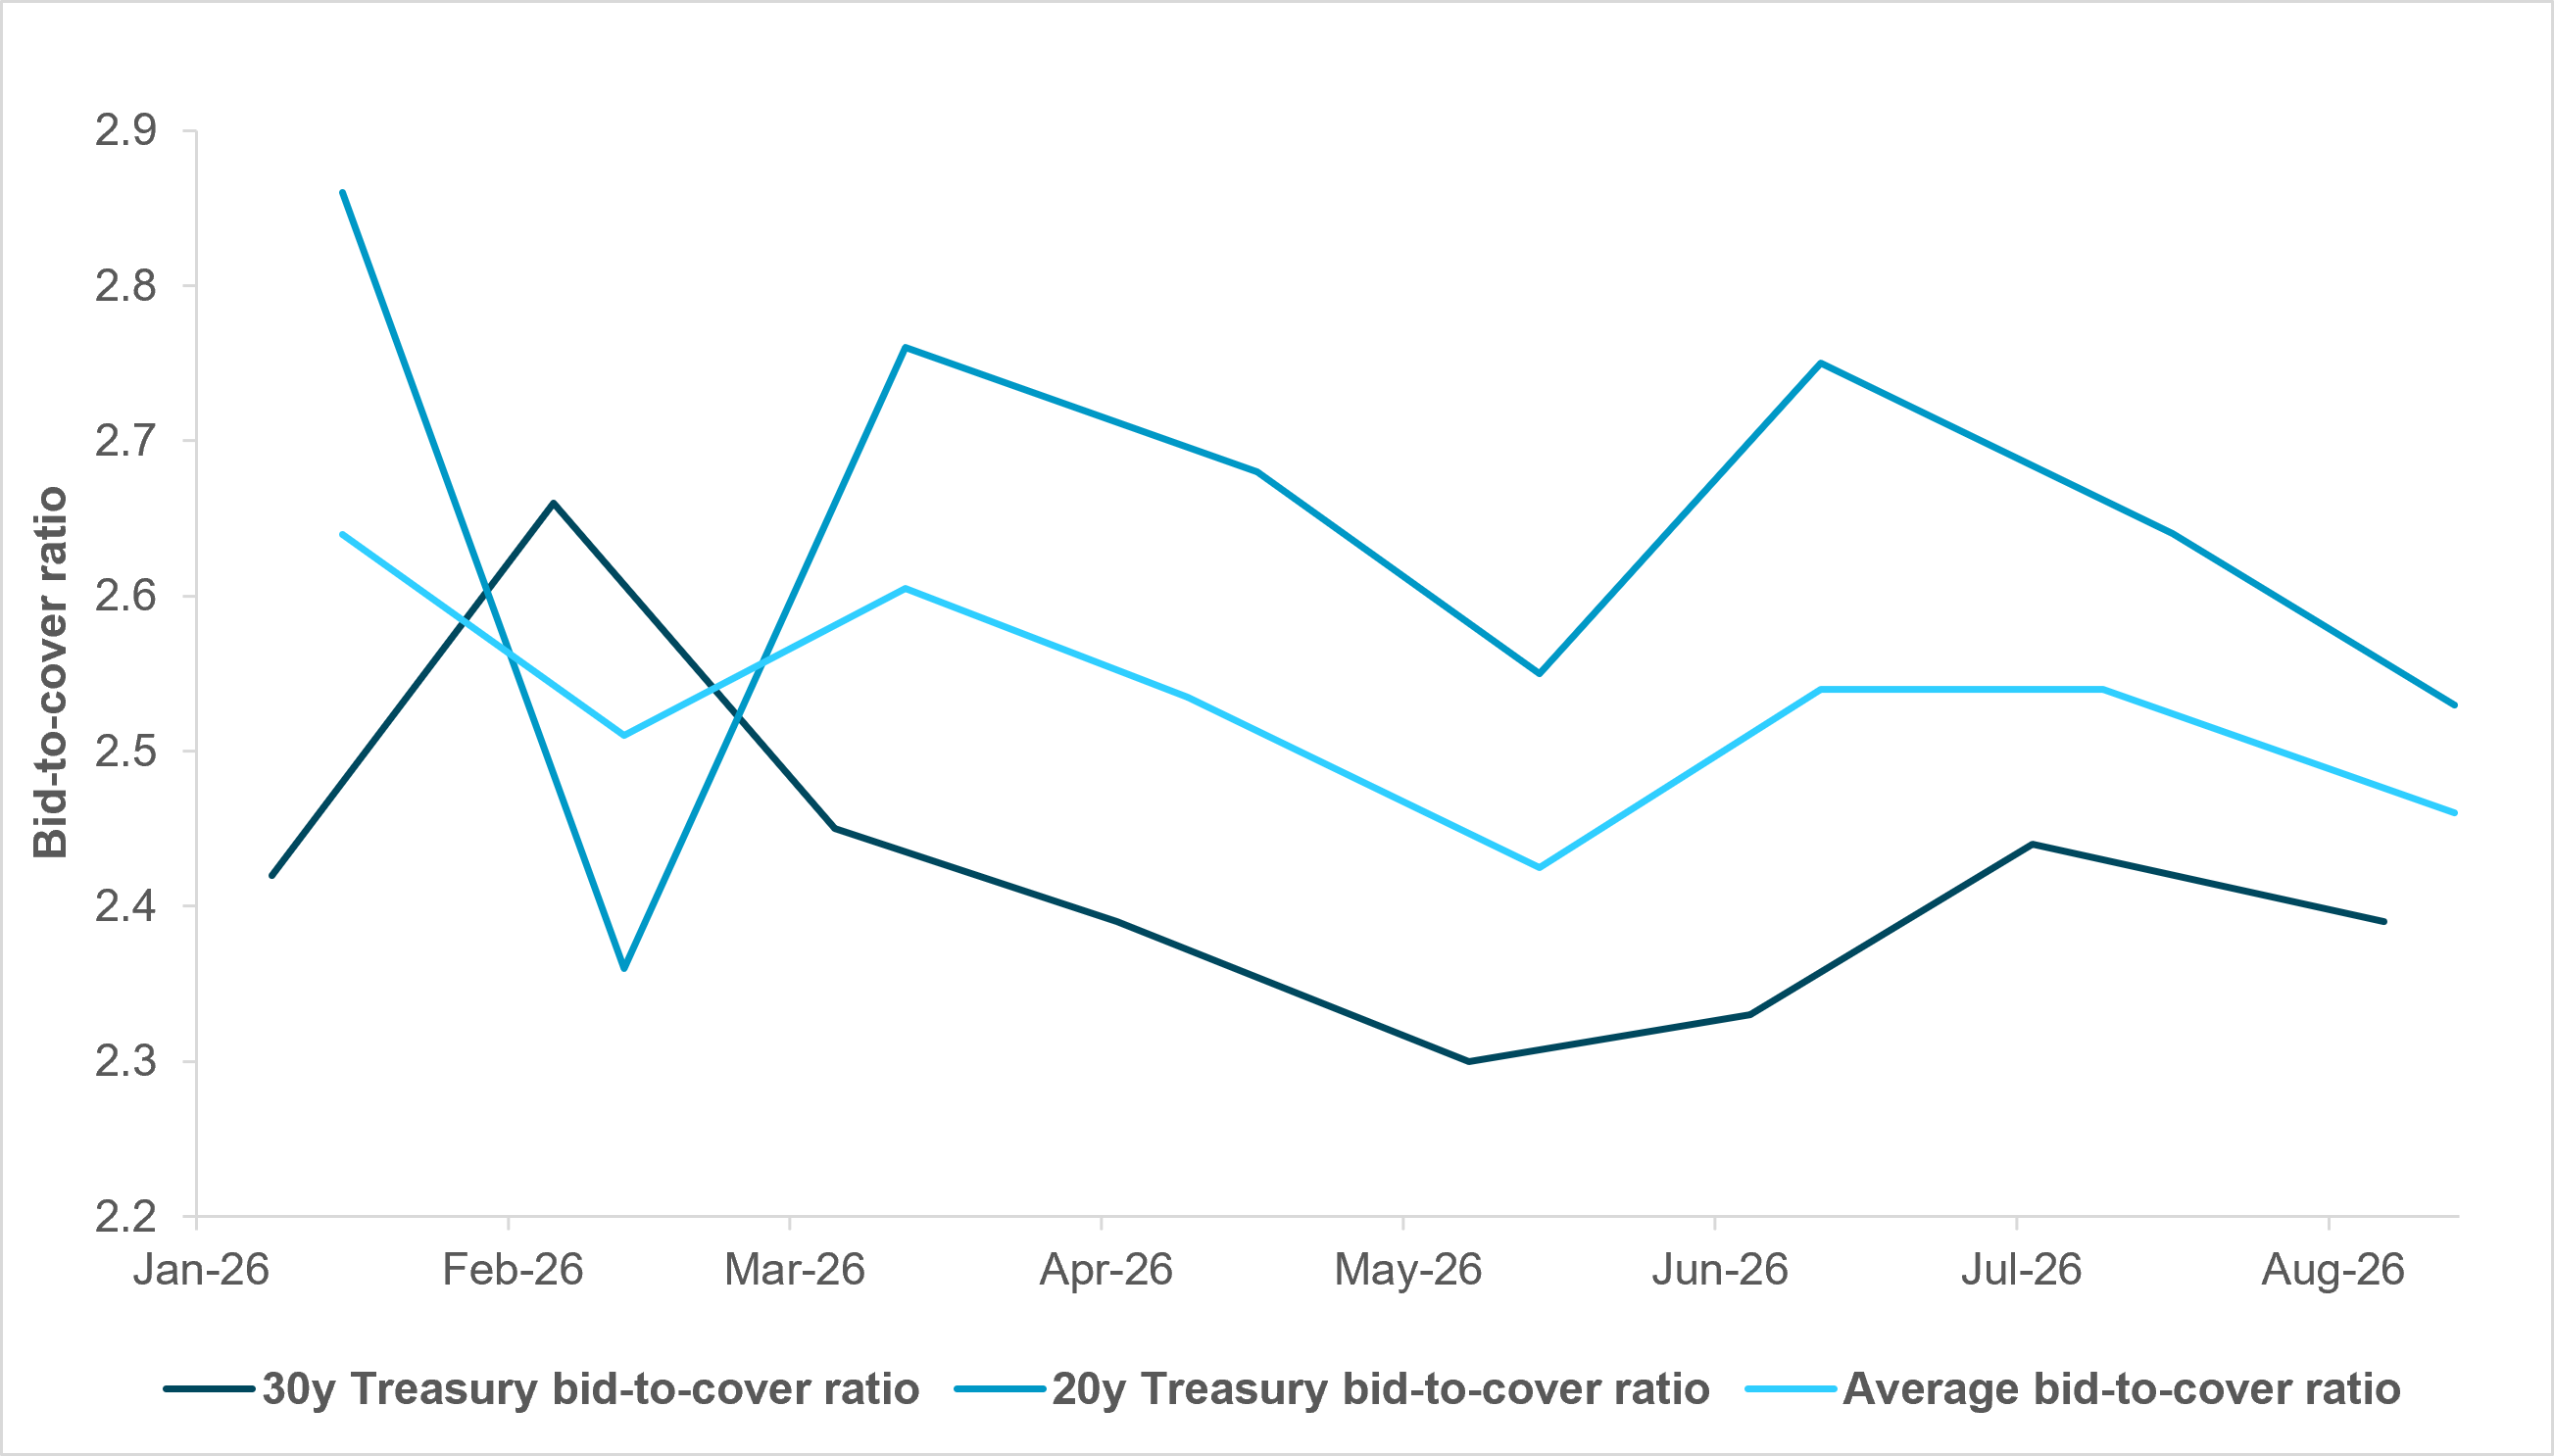
Comparing bid-to-cover to book coverage: Comparing bid-to-cover levels at the auctions of 20 and 30y USTs to the book coverage ratios of hyperscaler issuance for tenors 20y and longer is instructive, though the two measures should be viewed as directional rather than directly comparable.
EXHIBIT #7: BID-TO-COVER RATIOS OF LONG-END AUCTIONS HAVE DECLINED
Source: BNY, Bloomberg
Declining bid-to-cover ratios: The orange line shows the simple average of the bid-to-cover ratios for the monthly 20y and 30y auctions. It has moved modestly lower through 2026, suggesting marginally lower demand for new Treasury issuance. However, it’s worth noting that these bid-to-cover ratios remain within historical ranges and don’t indicate a broader loss of investor appetite for Treasurys.
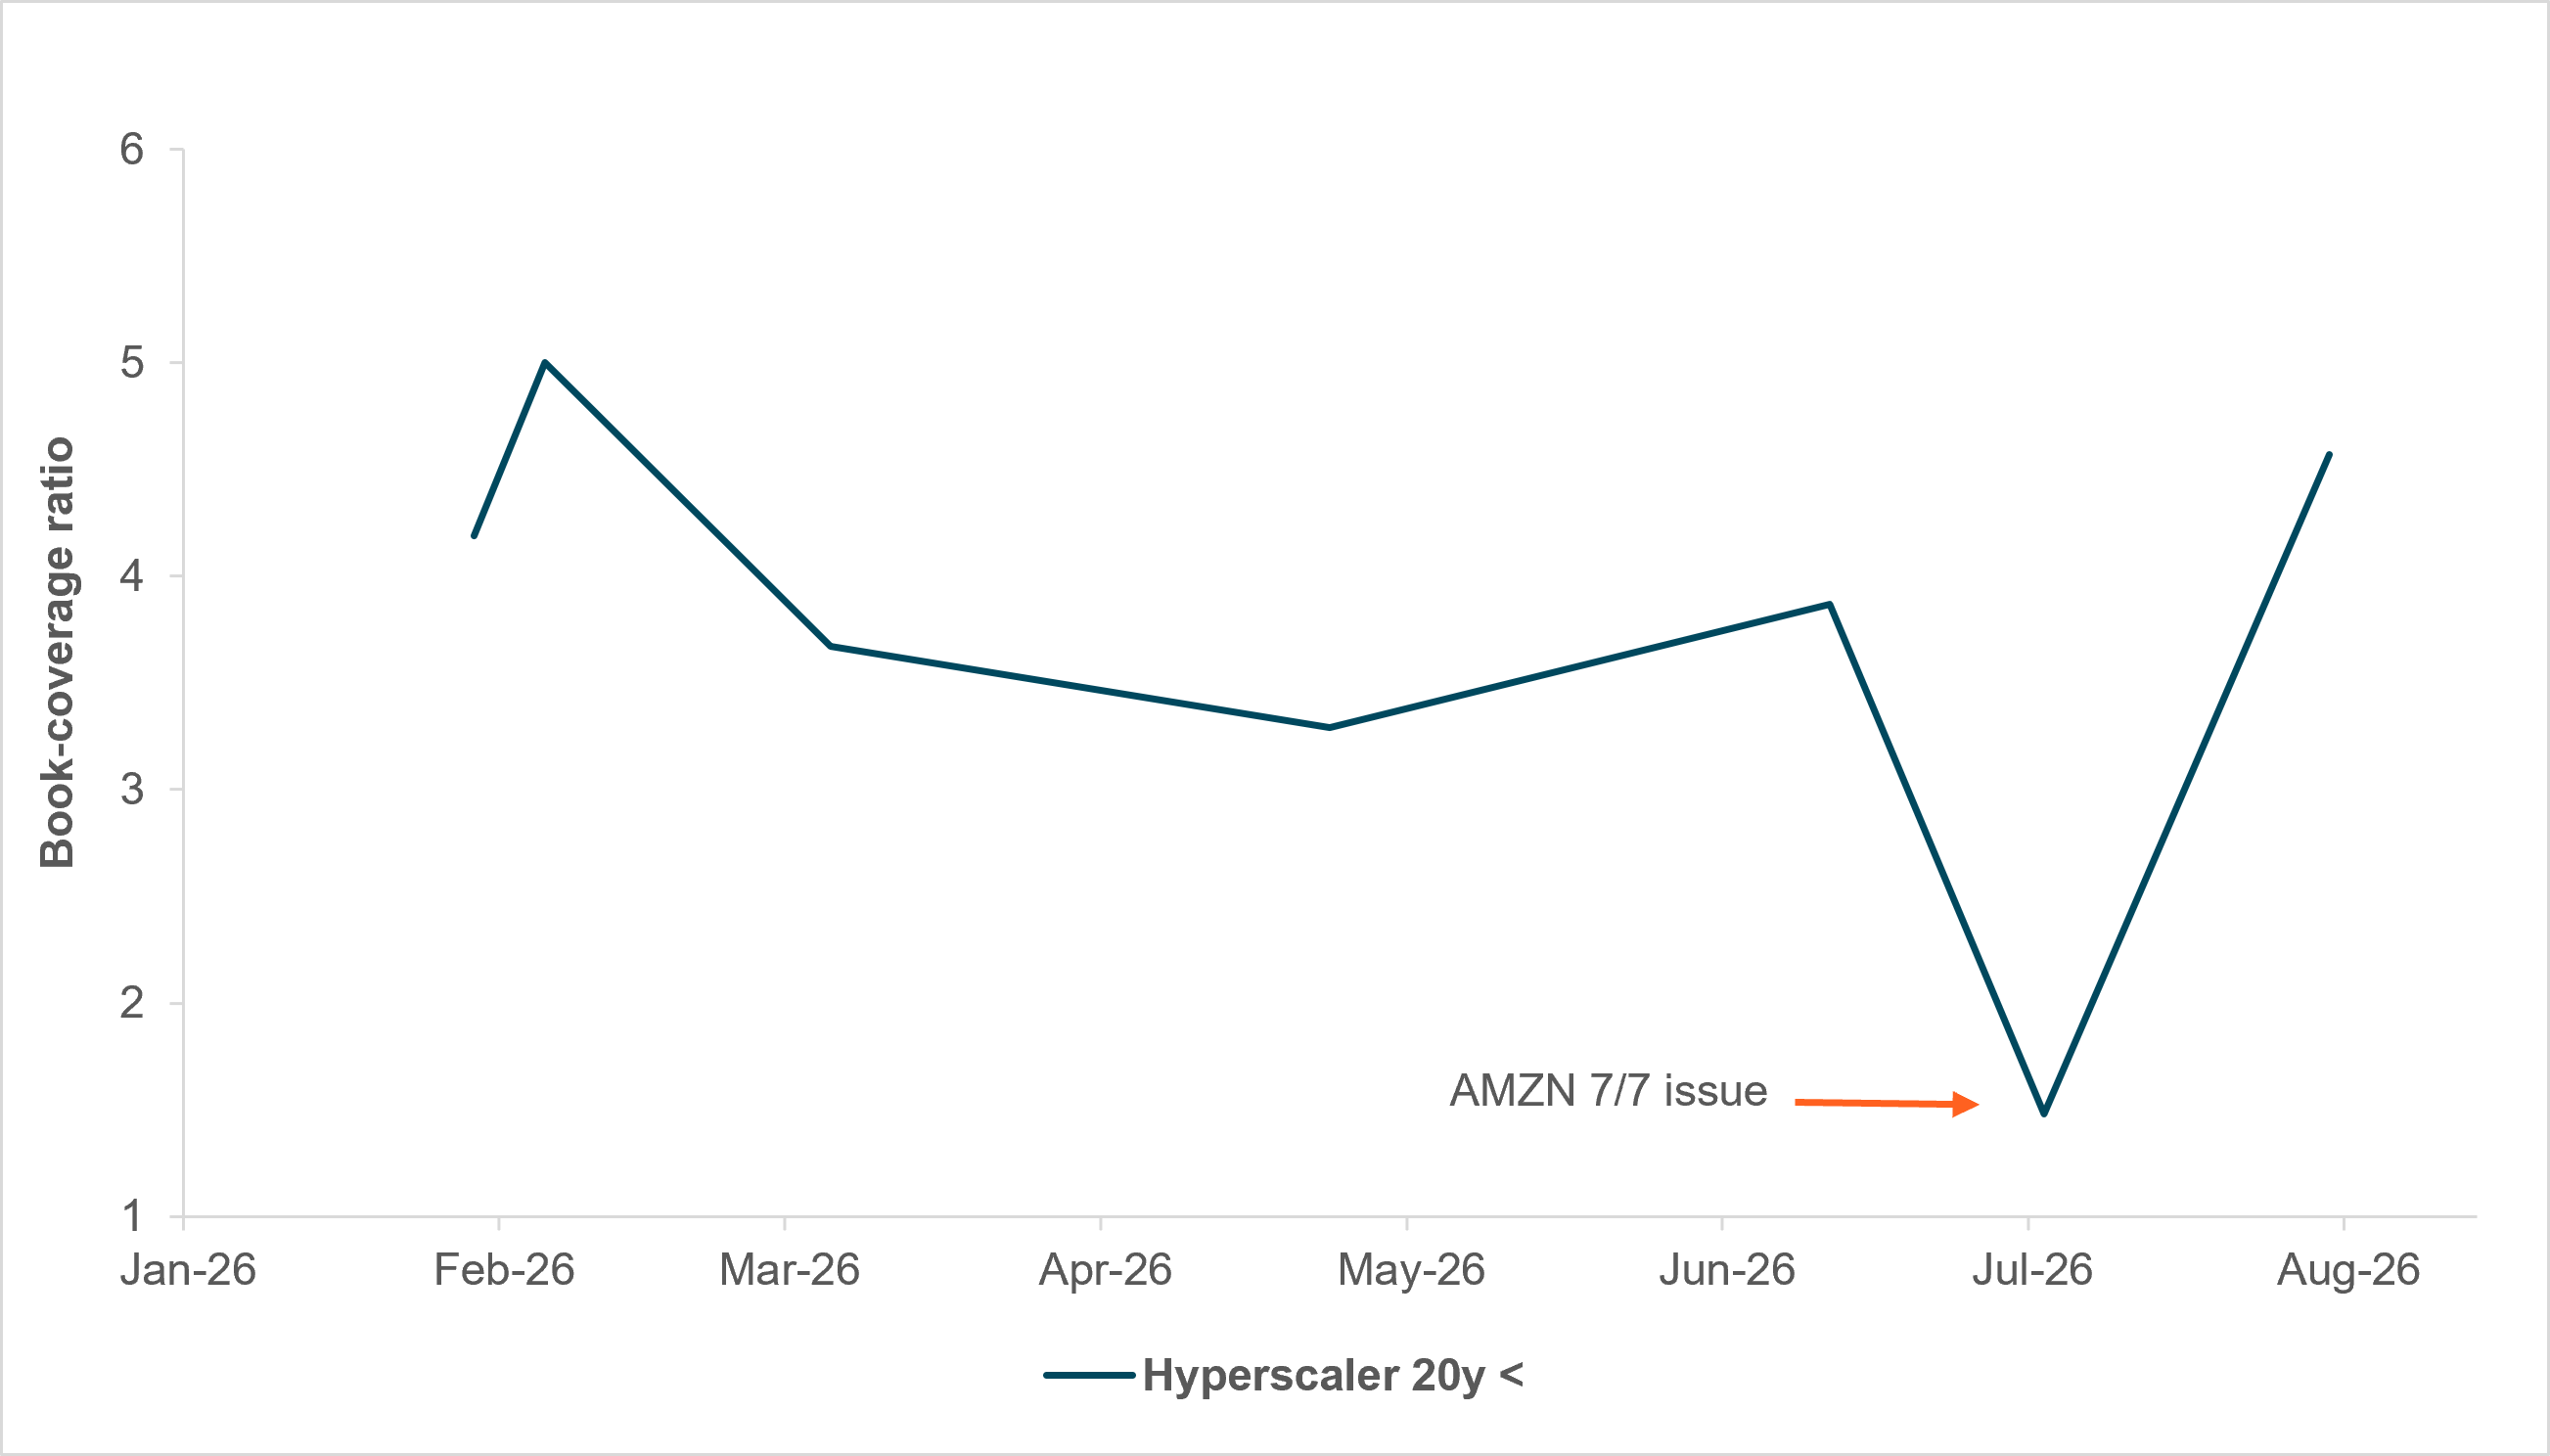
EXHIBIT #8: BOOK-COVERAGE RATIOS HAVE REMAINED STRONG
Source: BNY, Bloomberg
Hyperscaler book coverage remains firm: Hyperscaler book coverage ratios are modestly higher on the year, but the trend is issue specific. There was a considerable decline in demand for Amazon’s issue in early June, which came amid Situational Awareness’s unwind and SpaceX gapping out by nearly 100bp while trading at high-yield levels. Amazon surprised the market with greater issuance and paid the price, seeing a book-coverage ratio as low as 1.4 and meaningful concessions. Excluding Amazon’s issue, however, book coverage has held up well throughout the year, exemplified by Google’s issue in early August.
Sequencing nuance: A fair criticism of Exhibit 8 is that its narrative depends heavily on the sequencing of issuers and issue-specific nuance, given that it tracks a number of different issuers. If Amazon were to have come to market after Google, for example, the narrative might be considerably different. Nevertheless, it’s notable that book coverage ratios have, with few exceptions, remained strong throughout the year even amid unprecedented issuance.
Saturation: While their USD issuance is most in focus, hyperscalers have been issuing in other currencies, suggesting their broader demands for cash are feeding into more costly funding globally. For example, Google recently issued AU$5.5bn, its first in Australia, which yielded 6.98% on a 20y bond, its highest-ever borrowing cost for a note. The hyperscalers’ willingness to go overseas may suggest sensitivity to USD market capacity and a growing concern about USD issuance oversaturation.
Whether hyperscaler issuance is affecting marginal demand for long-end Treasurys will remain an active debate in the second half of the year.