Banks ride higher rates, resist higher vol
iFlow > Special Report

David Tam
Time to Read: 5 minutes
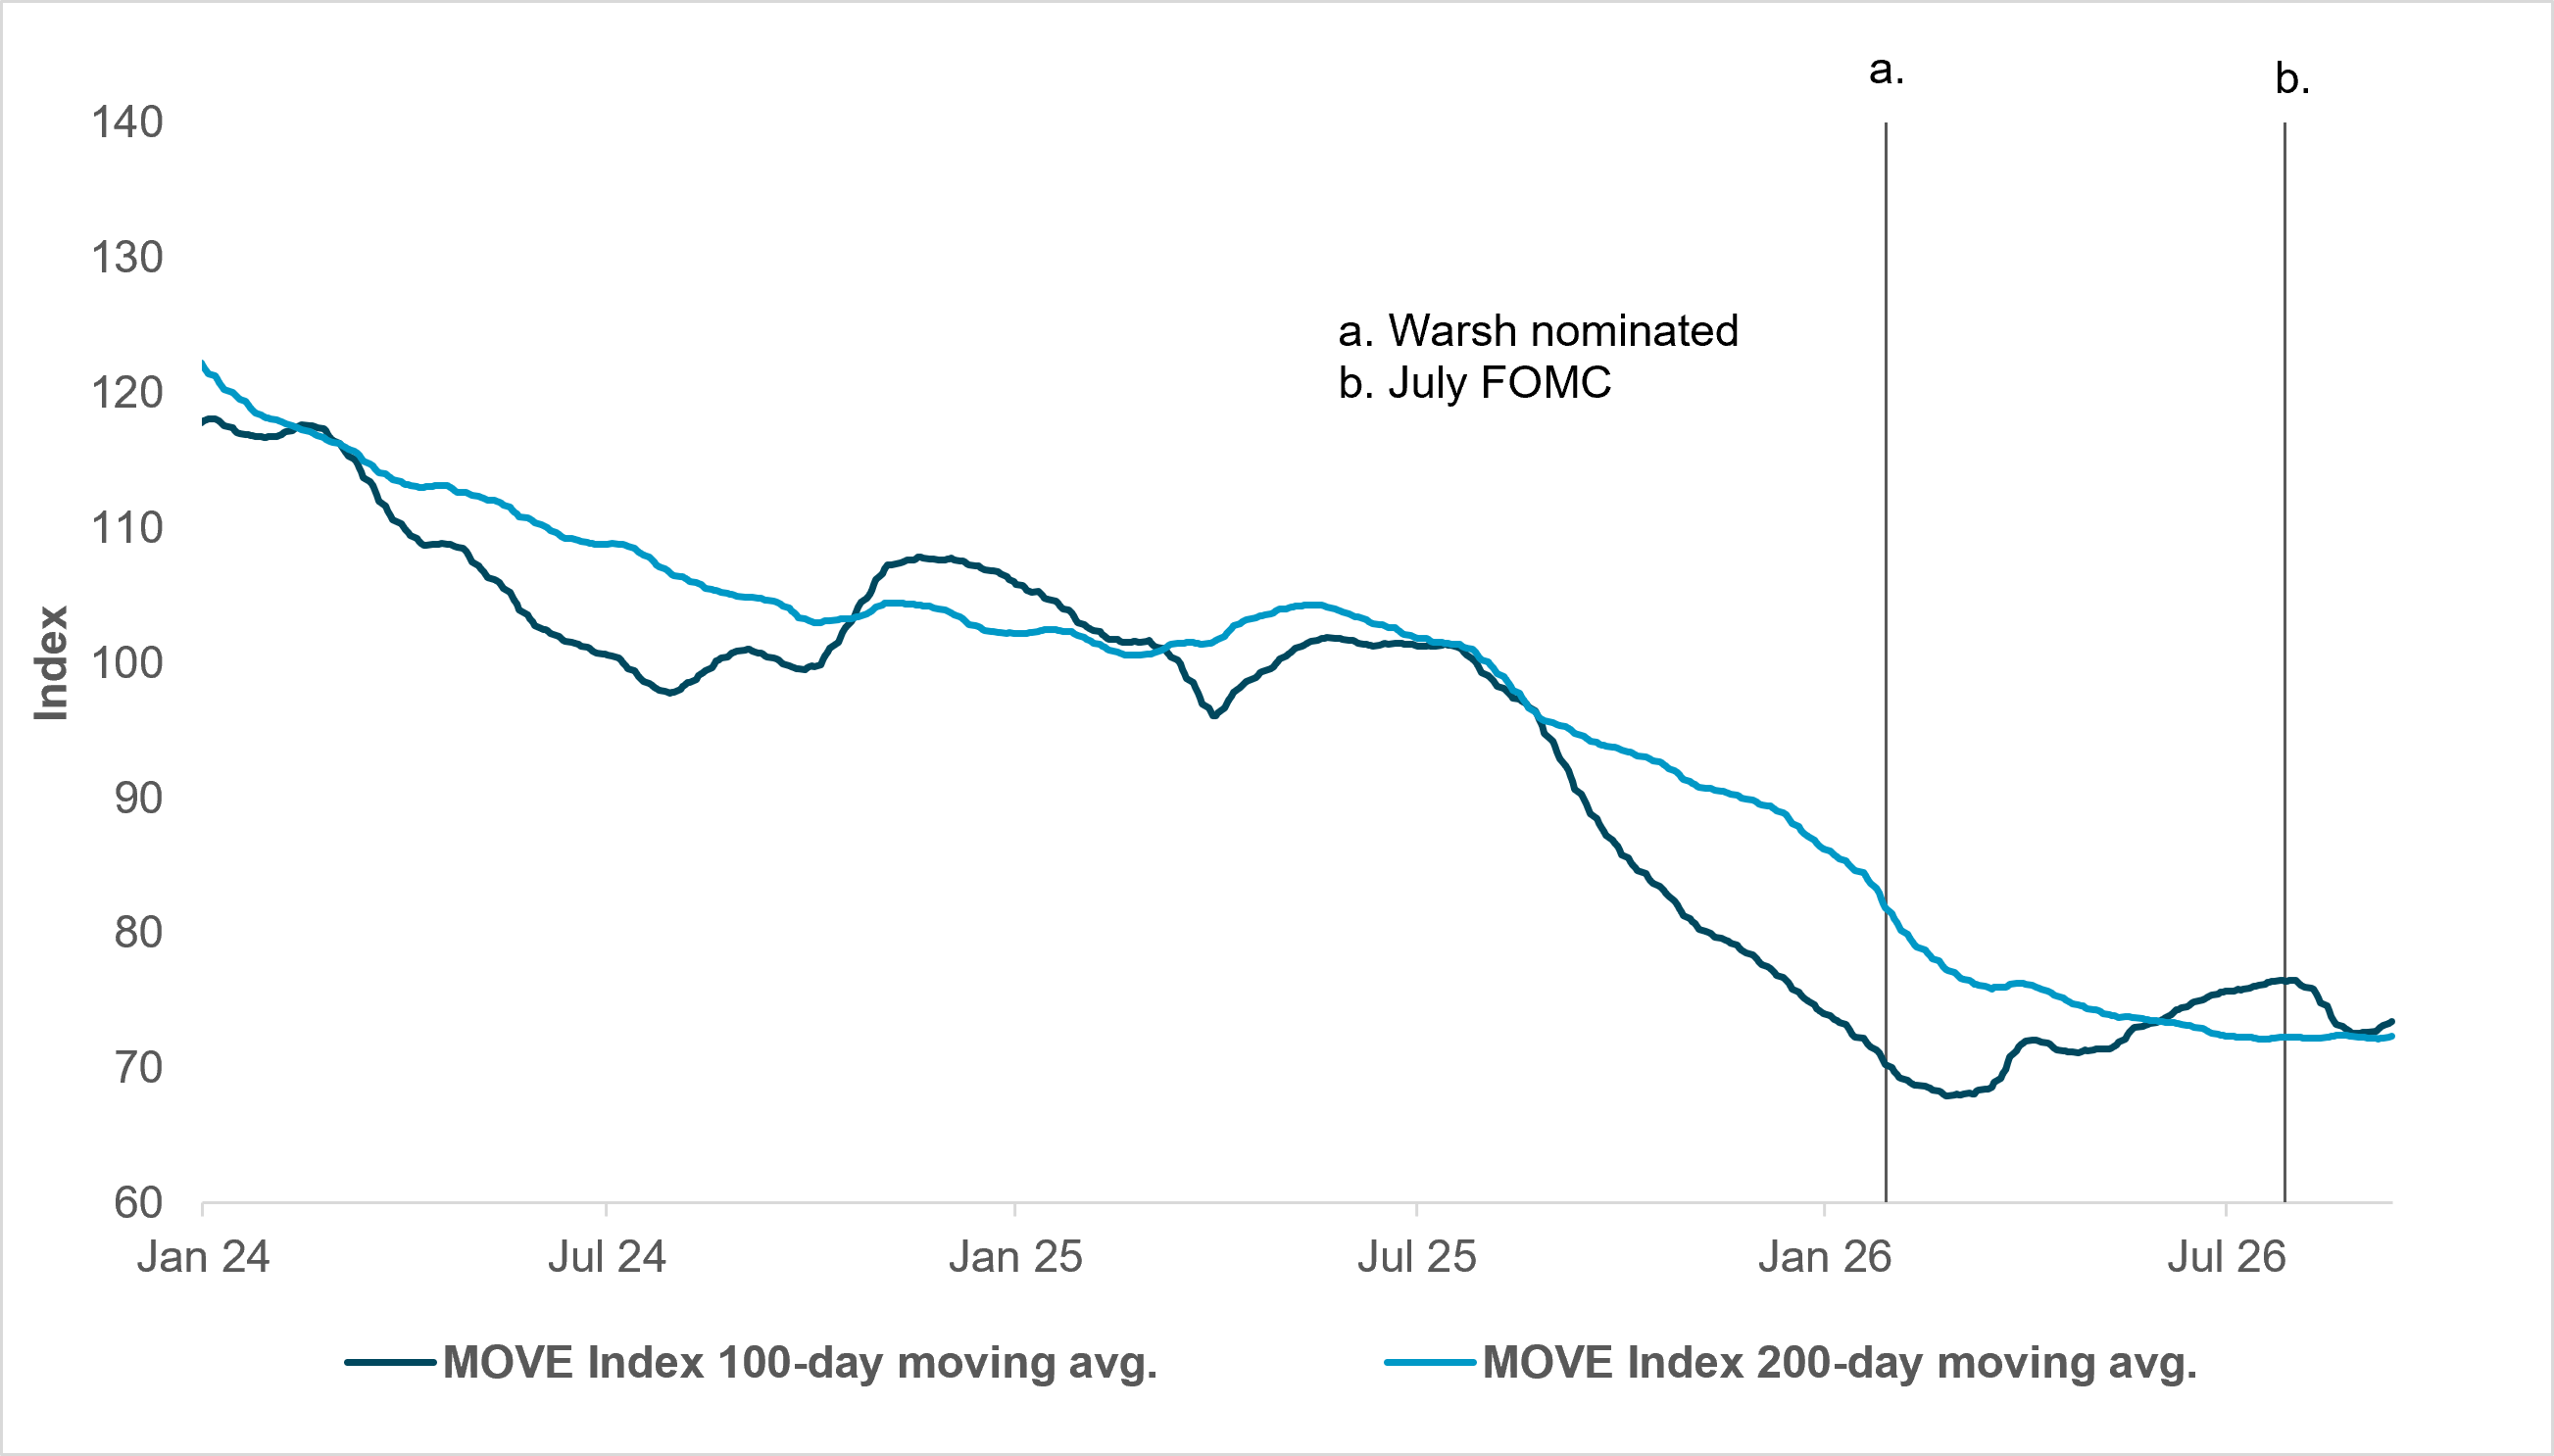
EXHIBIT #1: U.S. RATE VOL CONTINUES ITS UPWARD INFLECTION
Source: BNY Markets, Bloomberg
Rising rate vol: We continue to hold our view – which we’ve articulated in notes on portfolio risk, the carry trade, crowded currencies, and global bond spillover – that rate vol has inflected higher since Fed Chair Kevin Warsh was nominated and will continue to rise as a result of his Fed’s unwillingness to issue forward guidance. While we view that decision as a necessary corrective to excessive Fed communication since 2008, the immediate effect is greater front-end rate vol as markets adjust. Although the 100-day moving average of the MOVE Index (Exhibit 1) leveled off slightly after the July FOMC – a result of a market more accustomed to Warsh’s communication style, alongside Warsh himself growing more comfortable in limited signaling – it has recently started to rise again.
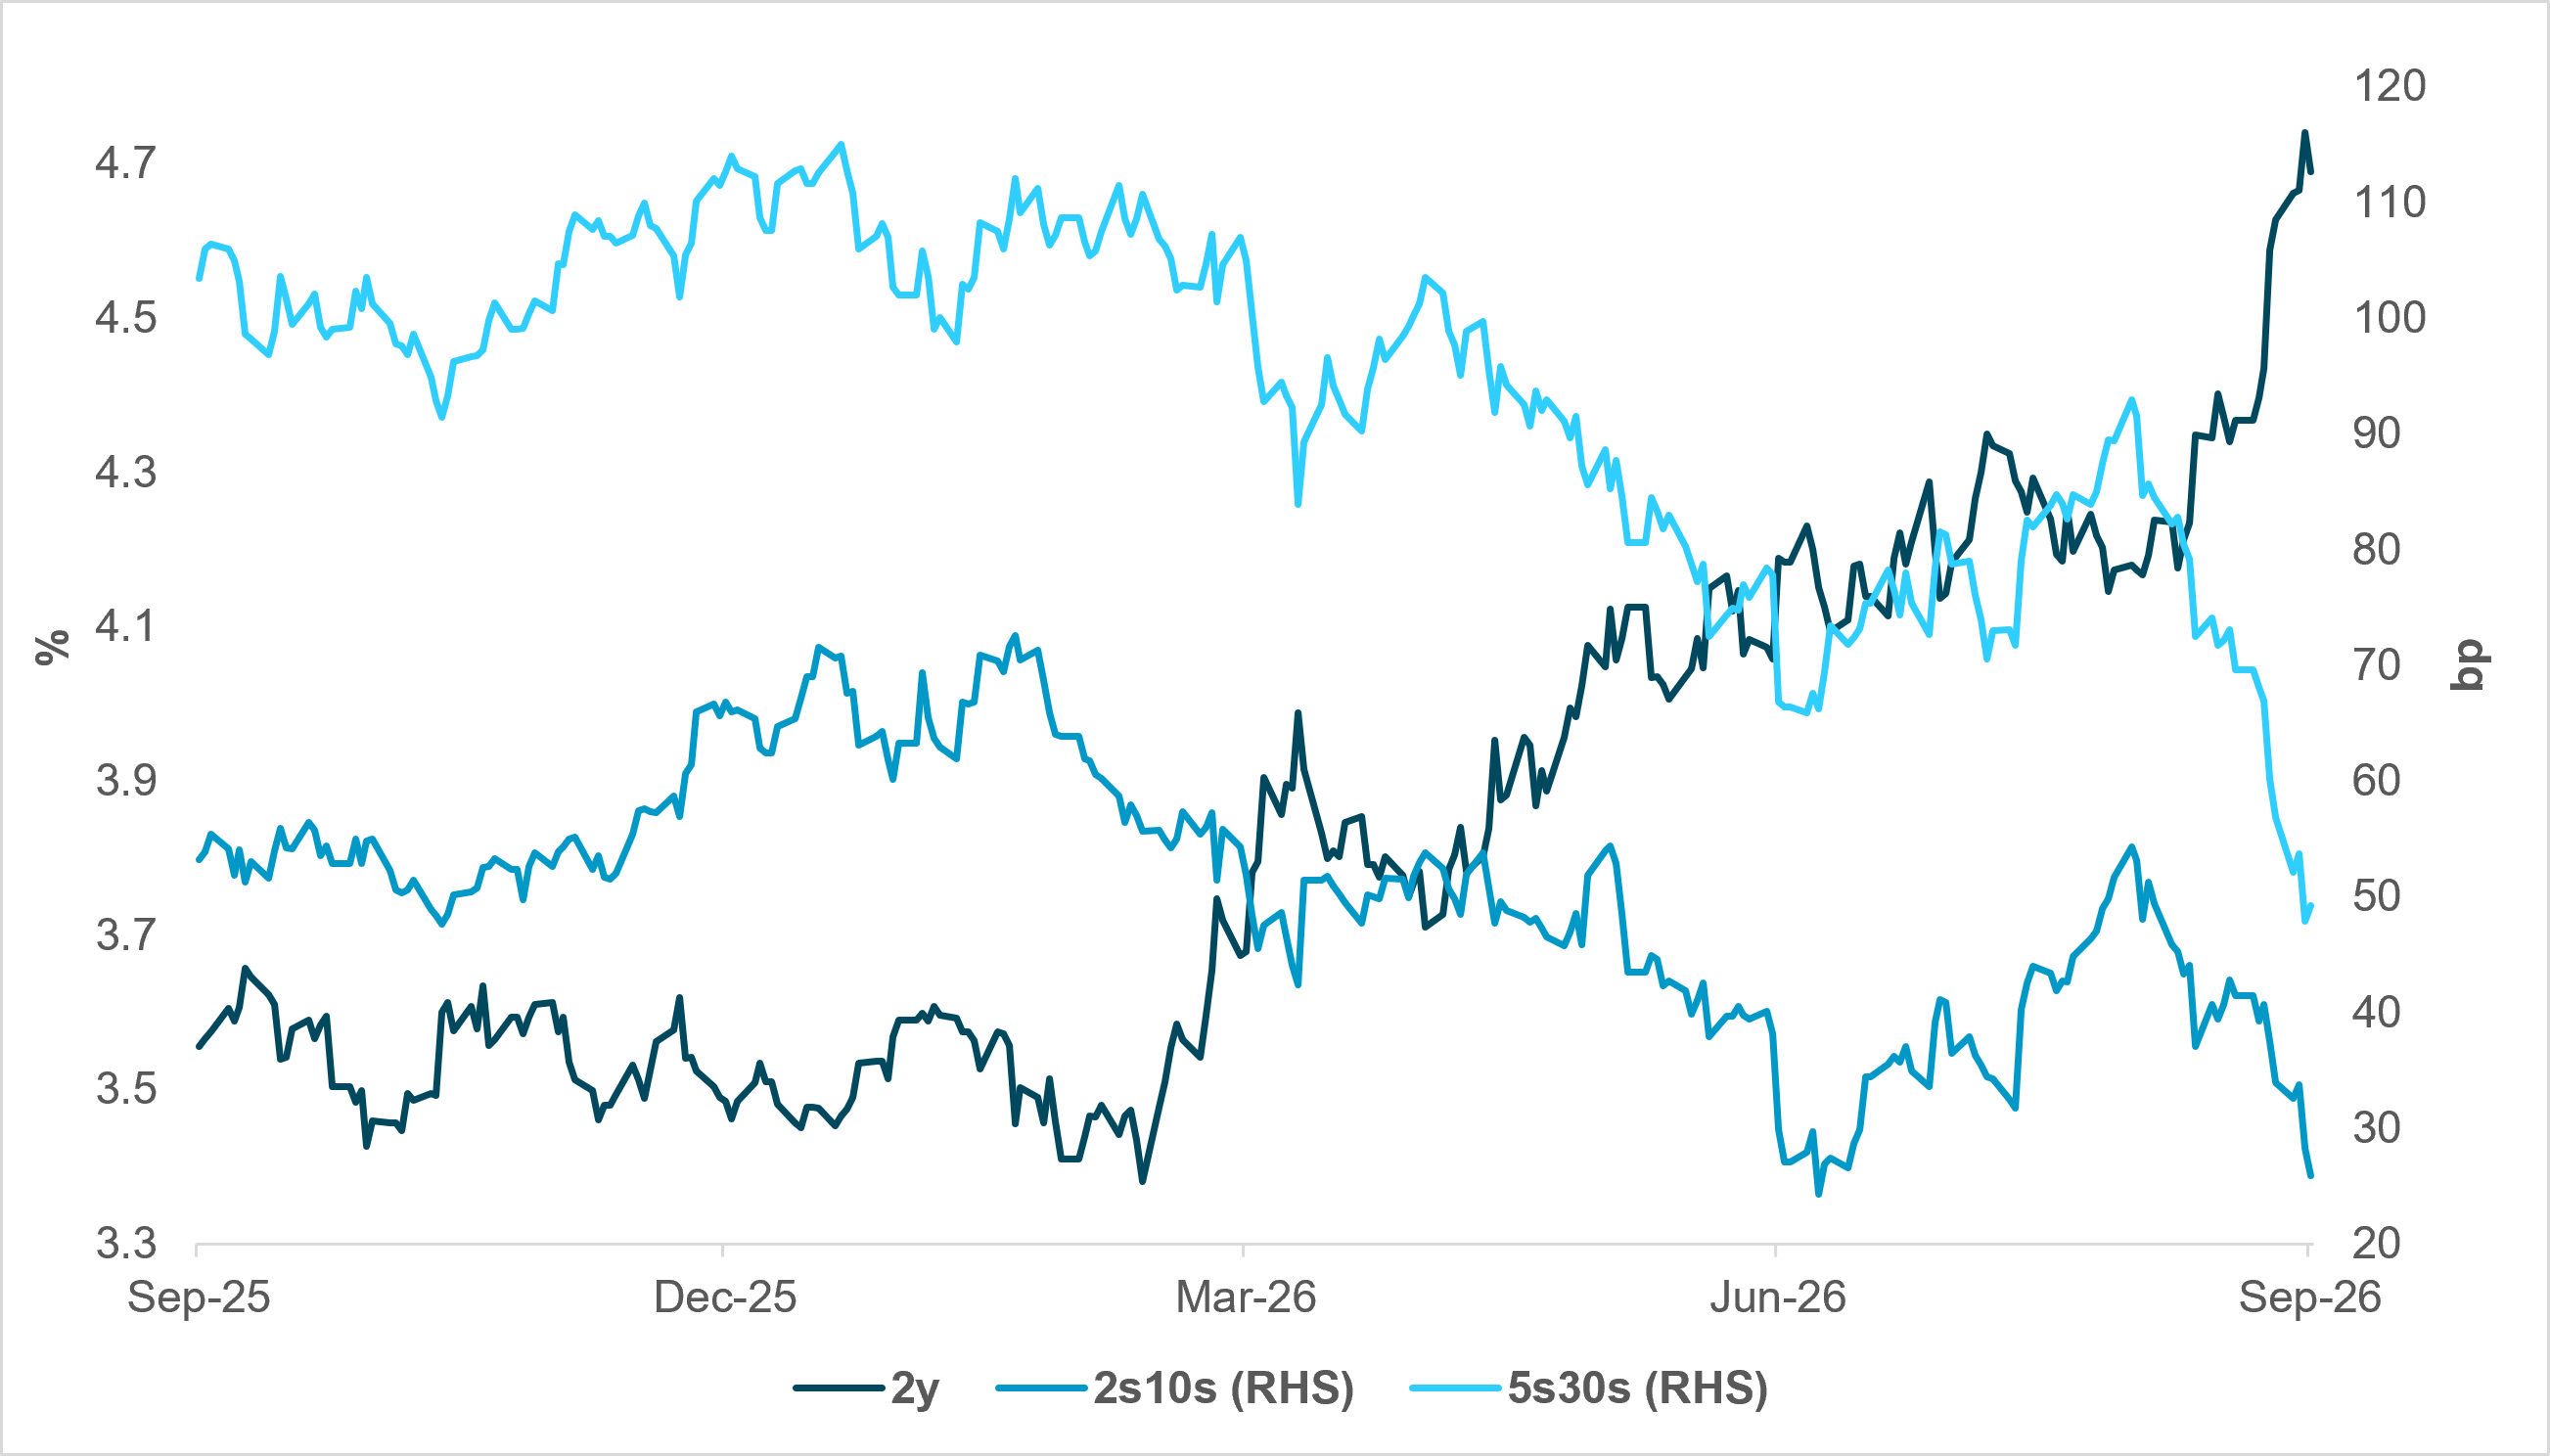
EXHIBIT #2: RISING FRONT-END RATES HAVE FLATTENED THE CURVE
Source: Bloomberg
Rising yields: Rising rate vol since the beginning of the year has coincided with rising yields. Though the Fed has only hiked once in Warsh’s tenure, the 2y is 55bp higher over the same period, as markets price in a more hawkish Fed.
Flatter curve: While yields across the curve have risen since the start of the year, the move has been most pronounced in the front end, with the 2s10s and 5s30s flattening significantly.
NII tailwind: Conventional wisdom suggests that banks should thrive in a rising rate regime. For banks, the most direct benefit of rising rates is rising NII and NIM. Early in a rate hiking cycle, banks will benefit from their assets repricing. Newly originated loans (as well as existing floating rate loans) will perform well, and banks will further benefit from security reinvestments.
Lagged deposit betas: Particularly early in a hiking cycle, deposit costs will often rise more slowly than increases to asset yields due to the stickiness of most deposits. The stickiness stems from deposit holder inattentiveness, meaningful switching costs, or non-economic benefits that banks provide to deposit holders. As deposit rates lag the increase in yields on the bank’s assets, net interest margins should expand.
Largest beneficiaries: We should expect banks with large core deposit franchises, particularly those with a high share of noninterest-bearing deposits, strong retail and commercial operating account bases, and correspondingly, a more modest reliance on wholesale funding to outperform.
Hedging costs increase: Rising rate vol will increase the cost of interest rate options and other hedging instruments that banks use to manage their duration exposure or their margin or deposit franchise economics. In a rising rate vol environment, banks might be forced to choose between paying more to hedge and tolerating greater earnings volatility.
Portfolio management grows more complex: A more volatile rates complex also creates challenges for bank CIOs around positioning securities portfolios, ALM, deposit modeling, and duration management. While these costs need not inherently harm the profitability of banks, they create operational challenges that must be managed. They also leave outside investors with uncertainty, since it can be hard to determine from the outside which banks are managed well, and which are poorly managed (or unlucky).
Deposit flight risk increases: On the margin, a higher rate vol environment could make customers more rate-aware in general and consequently more mobile, leading to greater competition for deposits and compressing NIMs. In general, this probably won’t outweigh the positive benefit that rising rates will have on the spread between bank asset yield levels and deposit betas discussed above.
Flatter curve hurts banks: As noted, as front-end rates increased, the curve has flattened. This should serve as a structural headwind for banks: their model of borrowing short to lend long comes under pressure when the short end gets costlier, and the long end doesn’t get as lucrative on a relative basis.
Trading desks benefit: Mitigating the generally negative relationship between rising rate vol and bank NII is that higher vol is typically good for bank trading desks as it increases client activity driven by hedging and repositioning needs and macro trading volumes. Banks with large capital markets businesses – particularly those that make an inordinate share of revenue from their capital markets businesses relative to their loan and securities book – should benefit more from rising rate vol.
Capital vol increases: That said, rate vol will also translate into greater capital vol for banks. Growing unrealized losses might limit the amount of balance sheet they’re willing to deploy to their capital markets businesses and limit the stock buybacks that banks are willing to do.
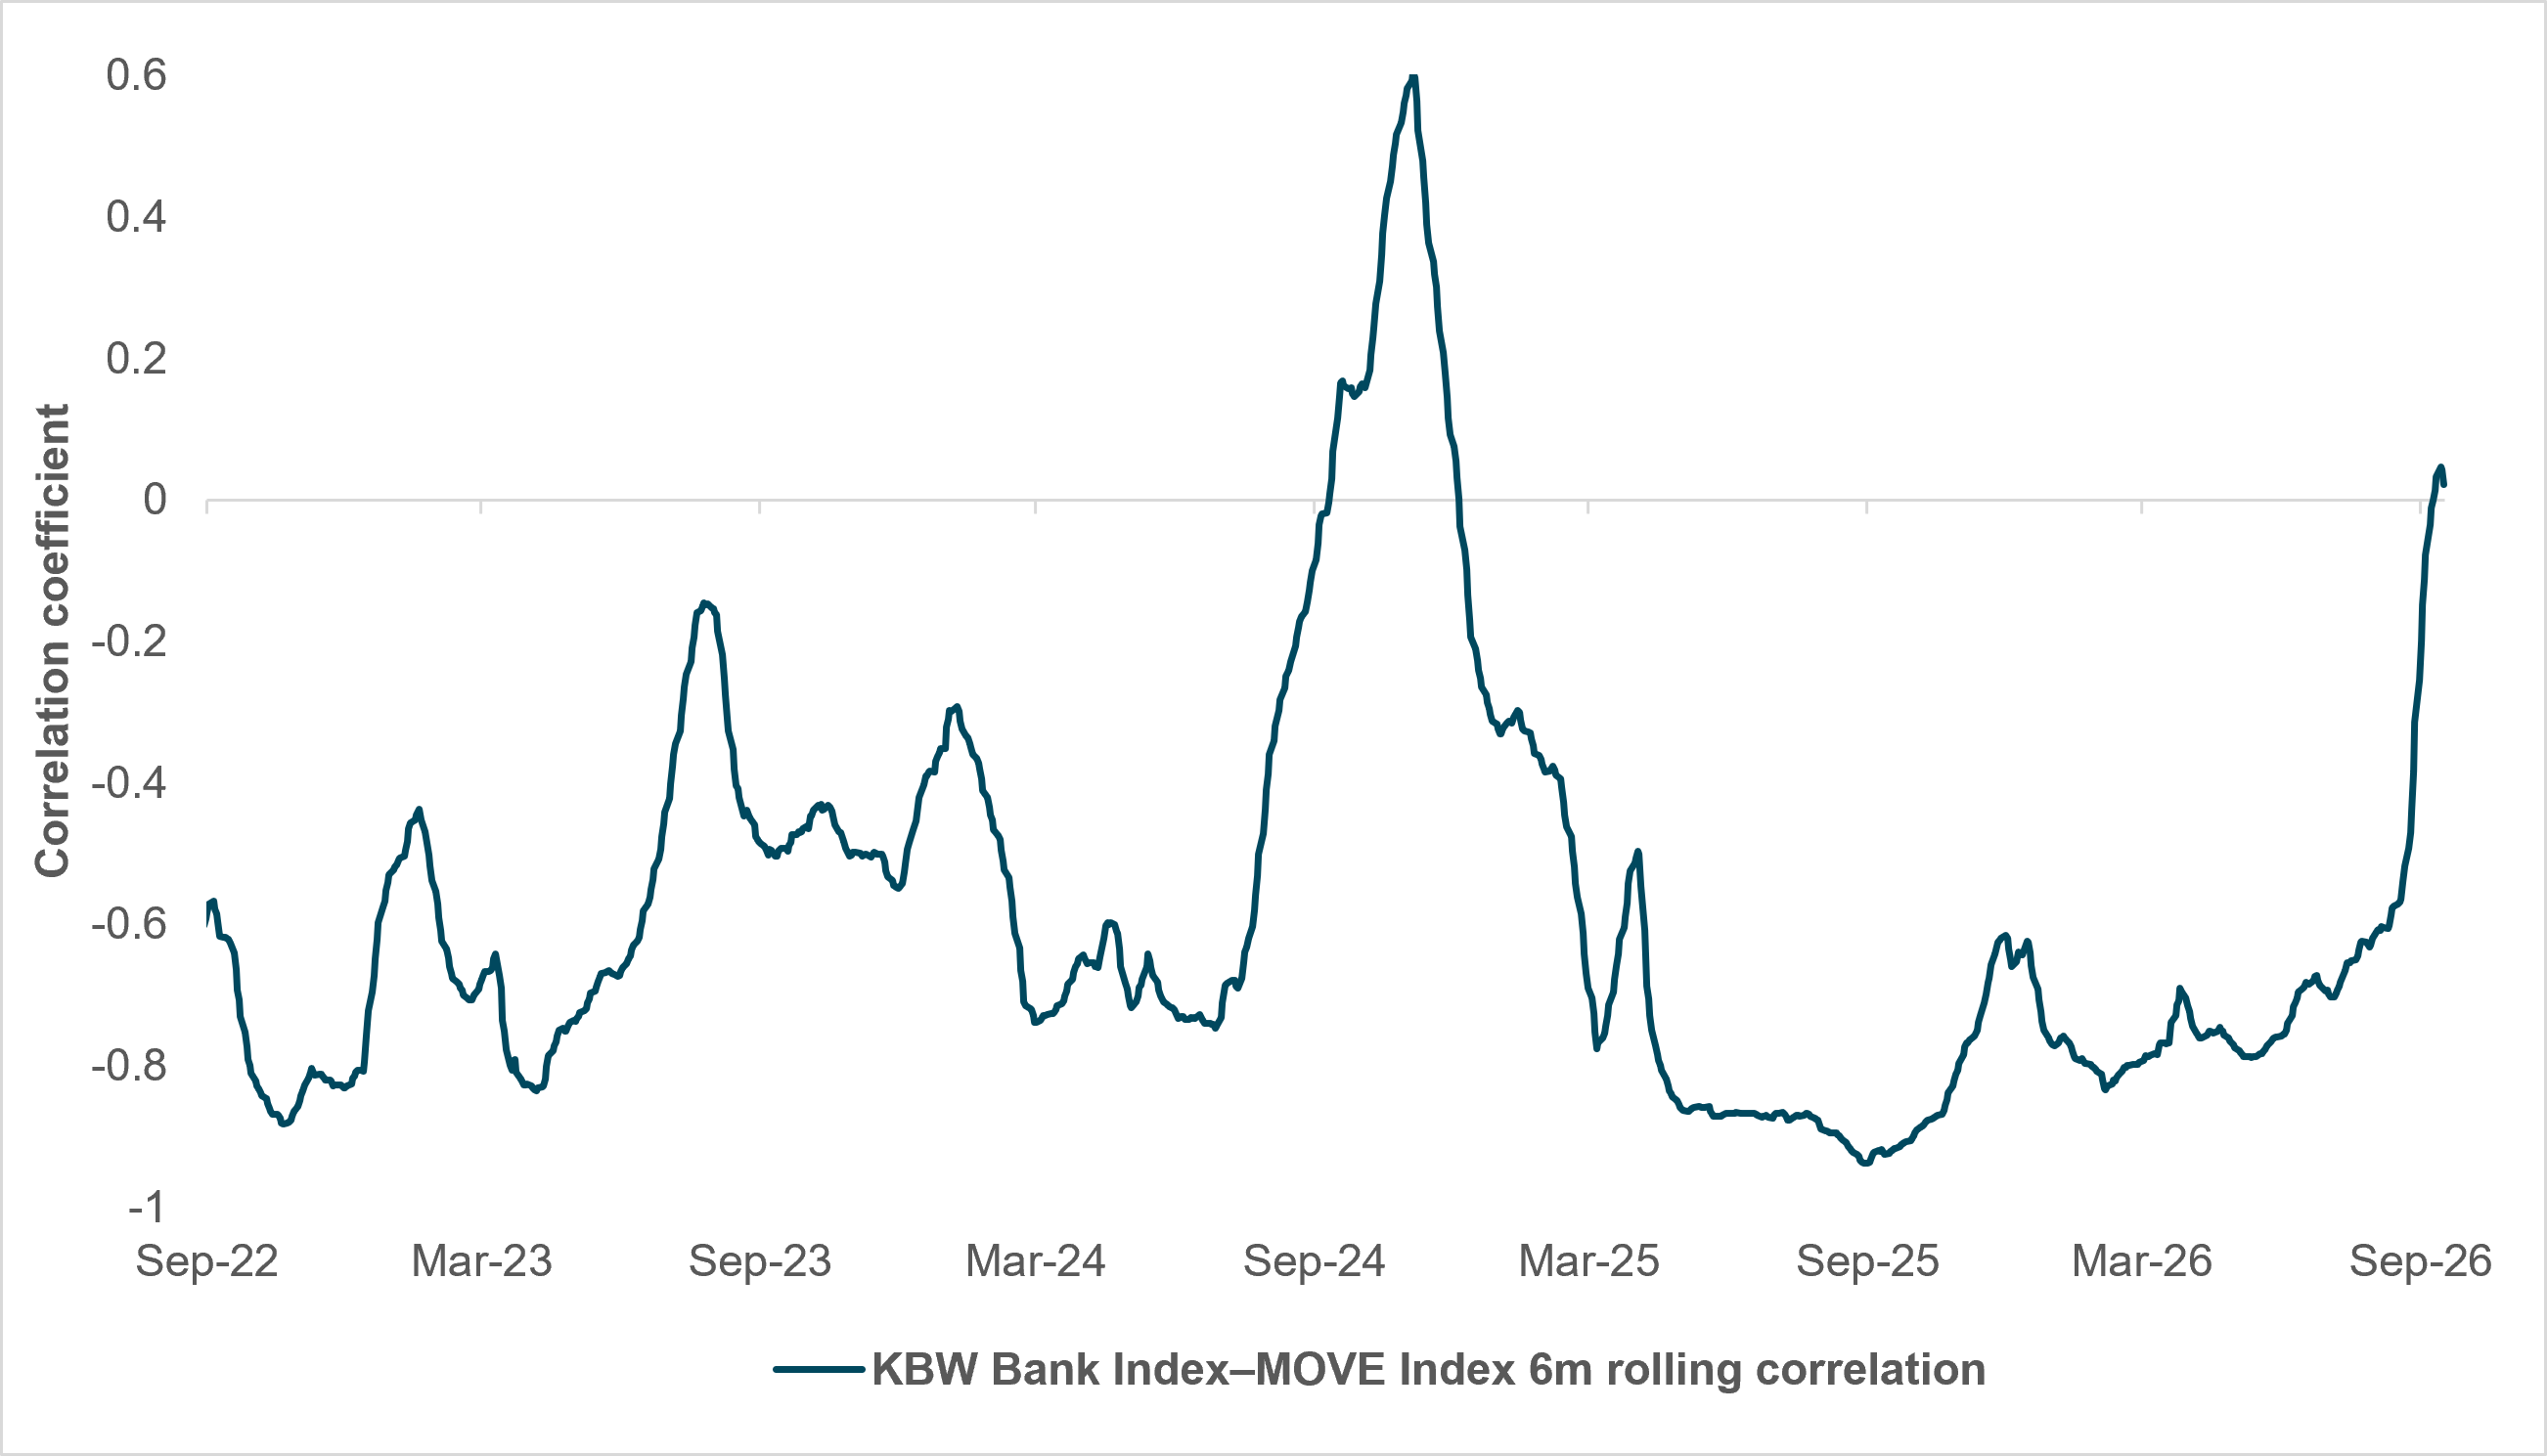
EXHIBIT #3: KBW BANK INDEX–MOVE INDEX NEGATIVE CORRELATION BREAKS DOWN
Source: BNY Markets, Bloomberg
Rate vol bad for bank stocks: Given what we’ve discussed above which, with the exception of trading desks, suggests that rising rate vol is bad for banks, it’s not surprising that bank equity performance (as measured by the KBW Bank Index) is generally negatively correlated to the MOVE Index (Exhibit 3).
2024 is a counter-example: Notably though, this relationship broke down in 2024 and is breaking down again today. Through most of 2024, there was substantial rate uncertainty leading the MOVE Index higher. Initially, markets priced in a more aggressive Fed cutting cycle in late summer after Jackson Hole. Subsequently, this pricing was taken off after a strong October jobs number led markets to expect a soft landing. Throughout these gyrations in rate expectations, however, banks performed well, first supported by dovish Fed expectations, and later by the strong data that led to optimism on the strength of the economy and better loan growth. The rate vol also steepened the Treasury curve, which benefited banks.
Bank stocks immune to rate vol today: Exhibit 3 suggests that a similar dynamic could be playing out today. It’s not as clear why the negative relationship between bank stock performance and rate vol has collapsed. It’s possible that bank performance could be supported by deregulatory optimism, a more resilient economy, or some other driver unrelated to rising rate vol. Whatever the reason, the chart suggests that investors in bank stocks need not immediately conclude that rising rate vol might spoil their party.
Rising rate vol: Continue to track measures of rate volatility, such as the MOVE Index’s 100- and 200-day moving average. Rate vol appears to be on the rise again after leveling off post-July FOMC.
Bank divergence: Track the relative performance of banks with a greater share of revenue from loan books or securities portfolios – which stand to benefit from rising rates but may face a drag from rising rate vol – against banks with a greater share of capital markets revenue. The latter should fare better in a rising-rate-vol regime.
Rate vol impact on banks: Track correlations between rate volatility and banks. Exhibit 3 uses the MOVE and KBW Indices, but swaptions and specific banks or bank credit or CDS would also do the trick.