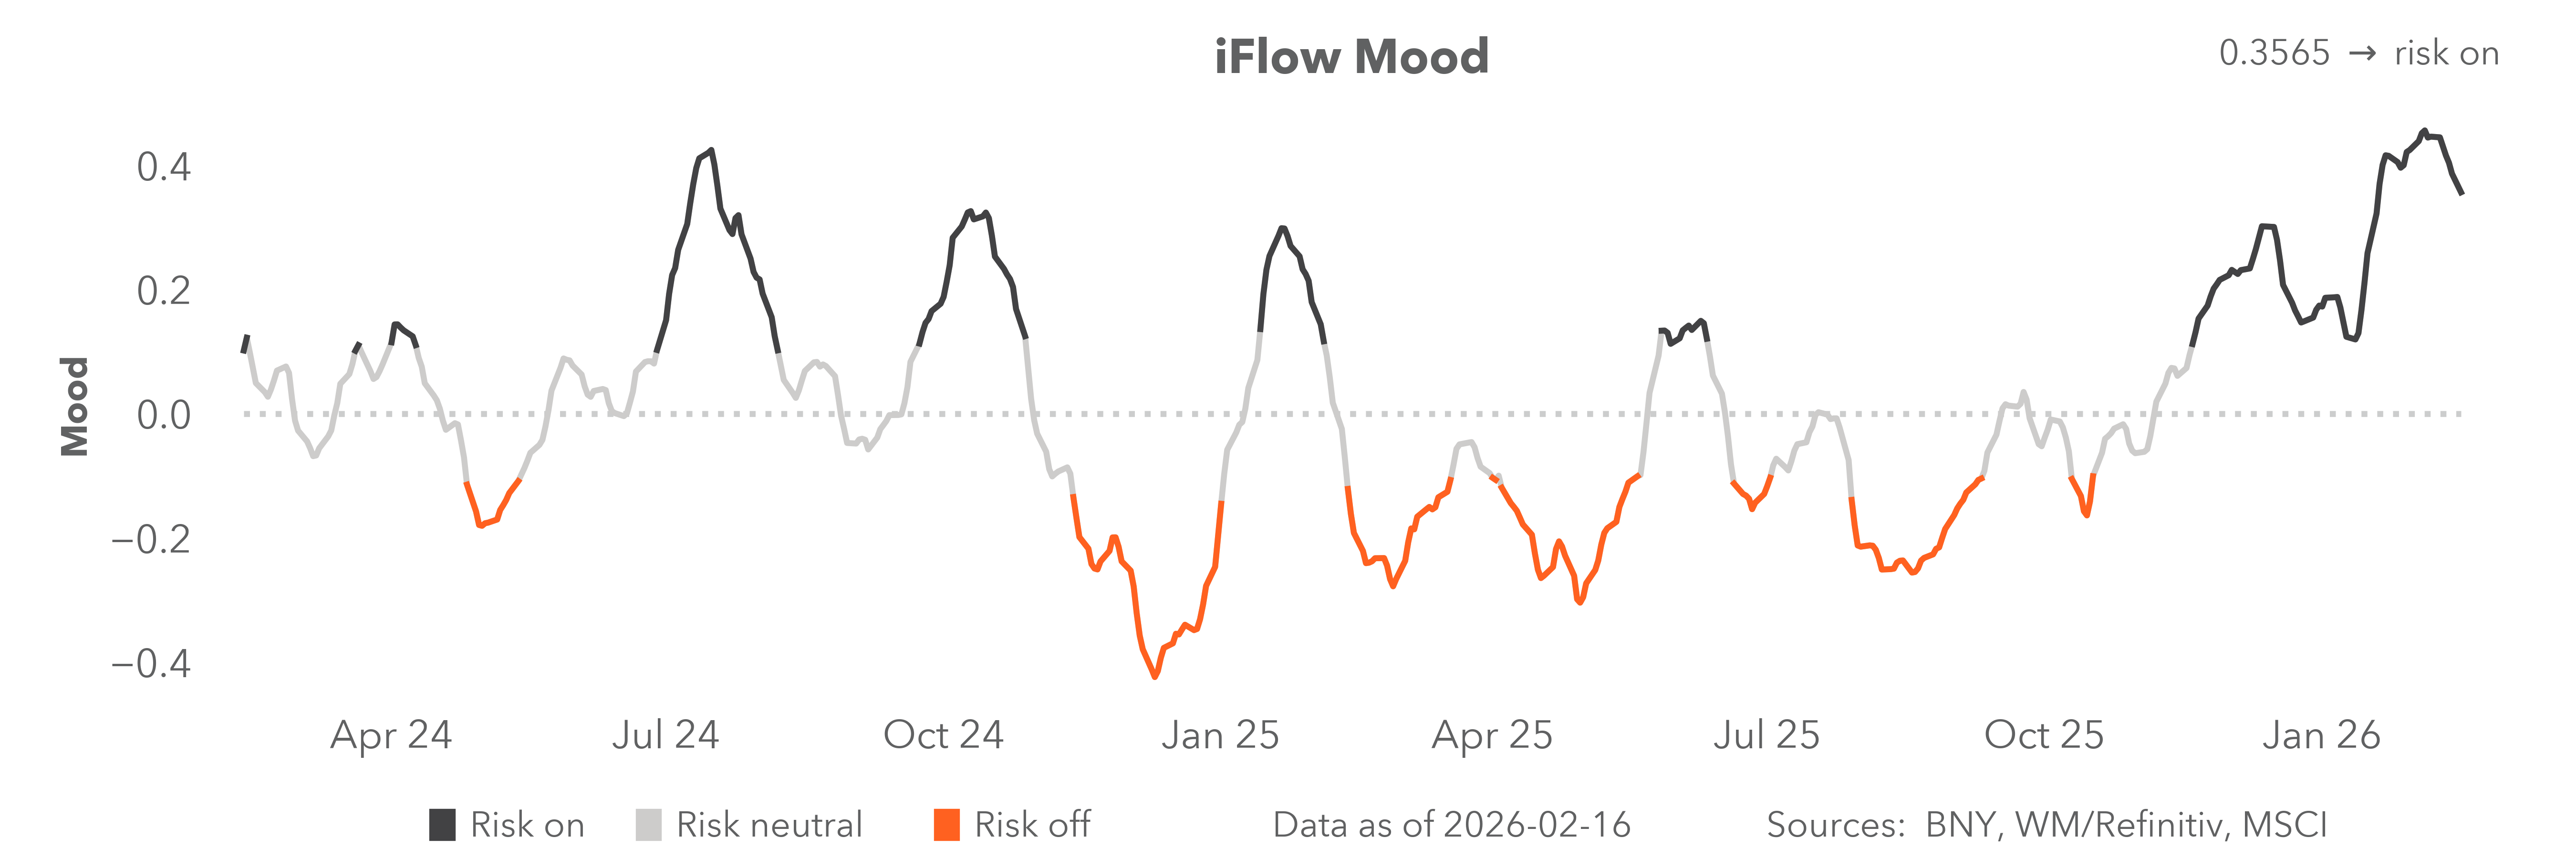
Positioning cuts both ways
iFlow > Investor Trends
Investor Trends provides a deep dive into patterns and behaviors in equity, bond and currency markets around the globe, underpinned with deeper macro insights.
iFlow > Investor Trends
Investor Trends provides a deep dive into patterns and behaviors in equity, bond and currency markets around the globe, underpinned with deeper macro insights.

Geoff Yu
Time to Read: 5 minutes
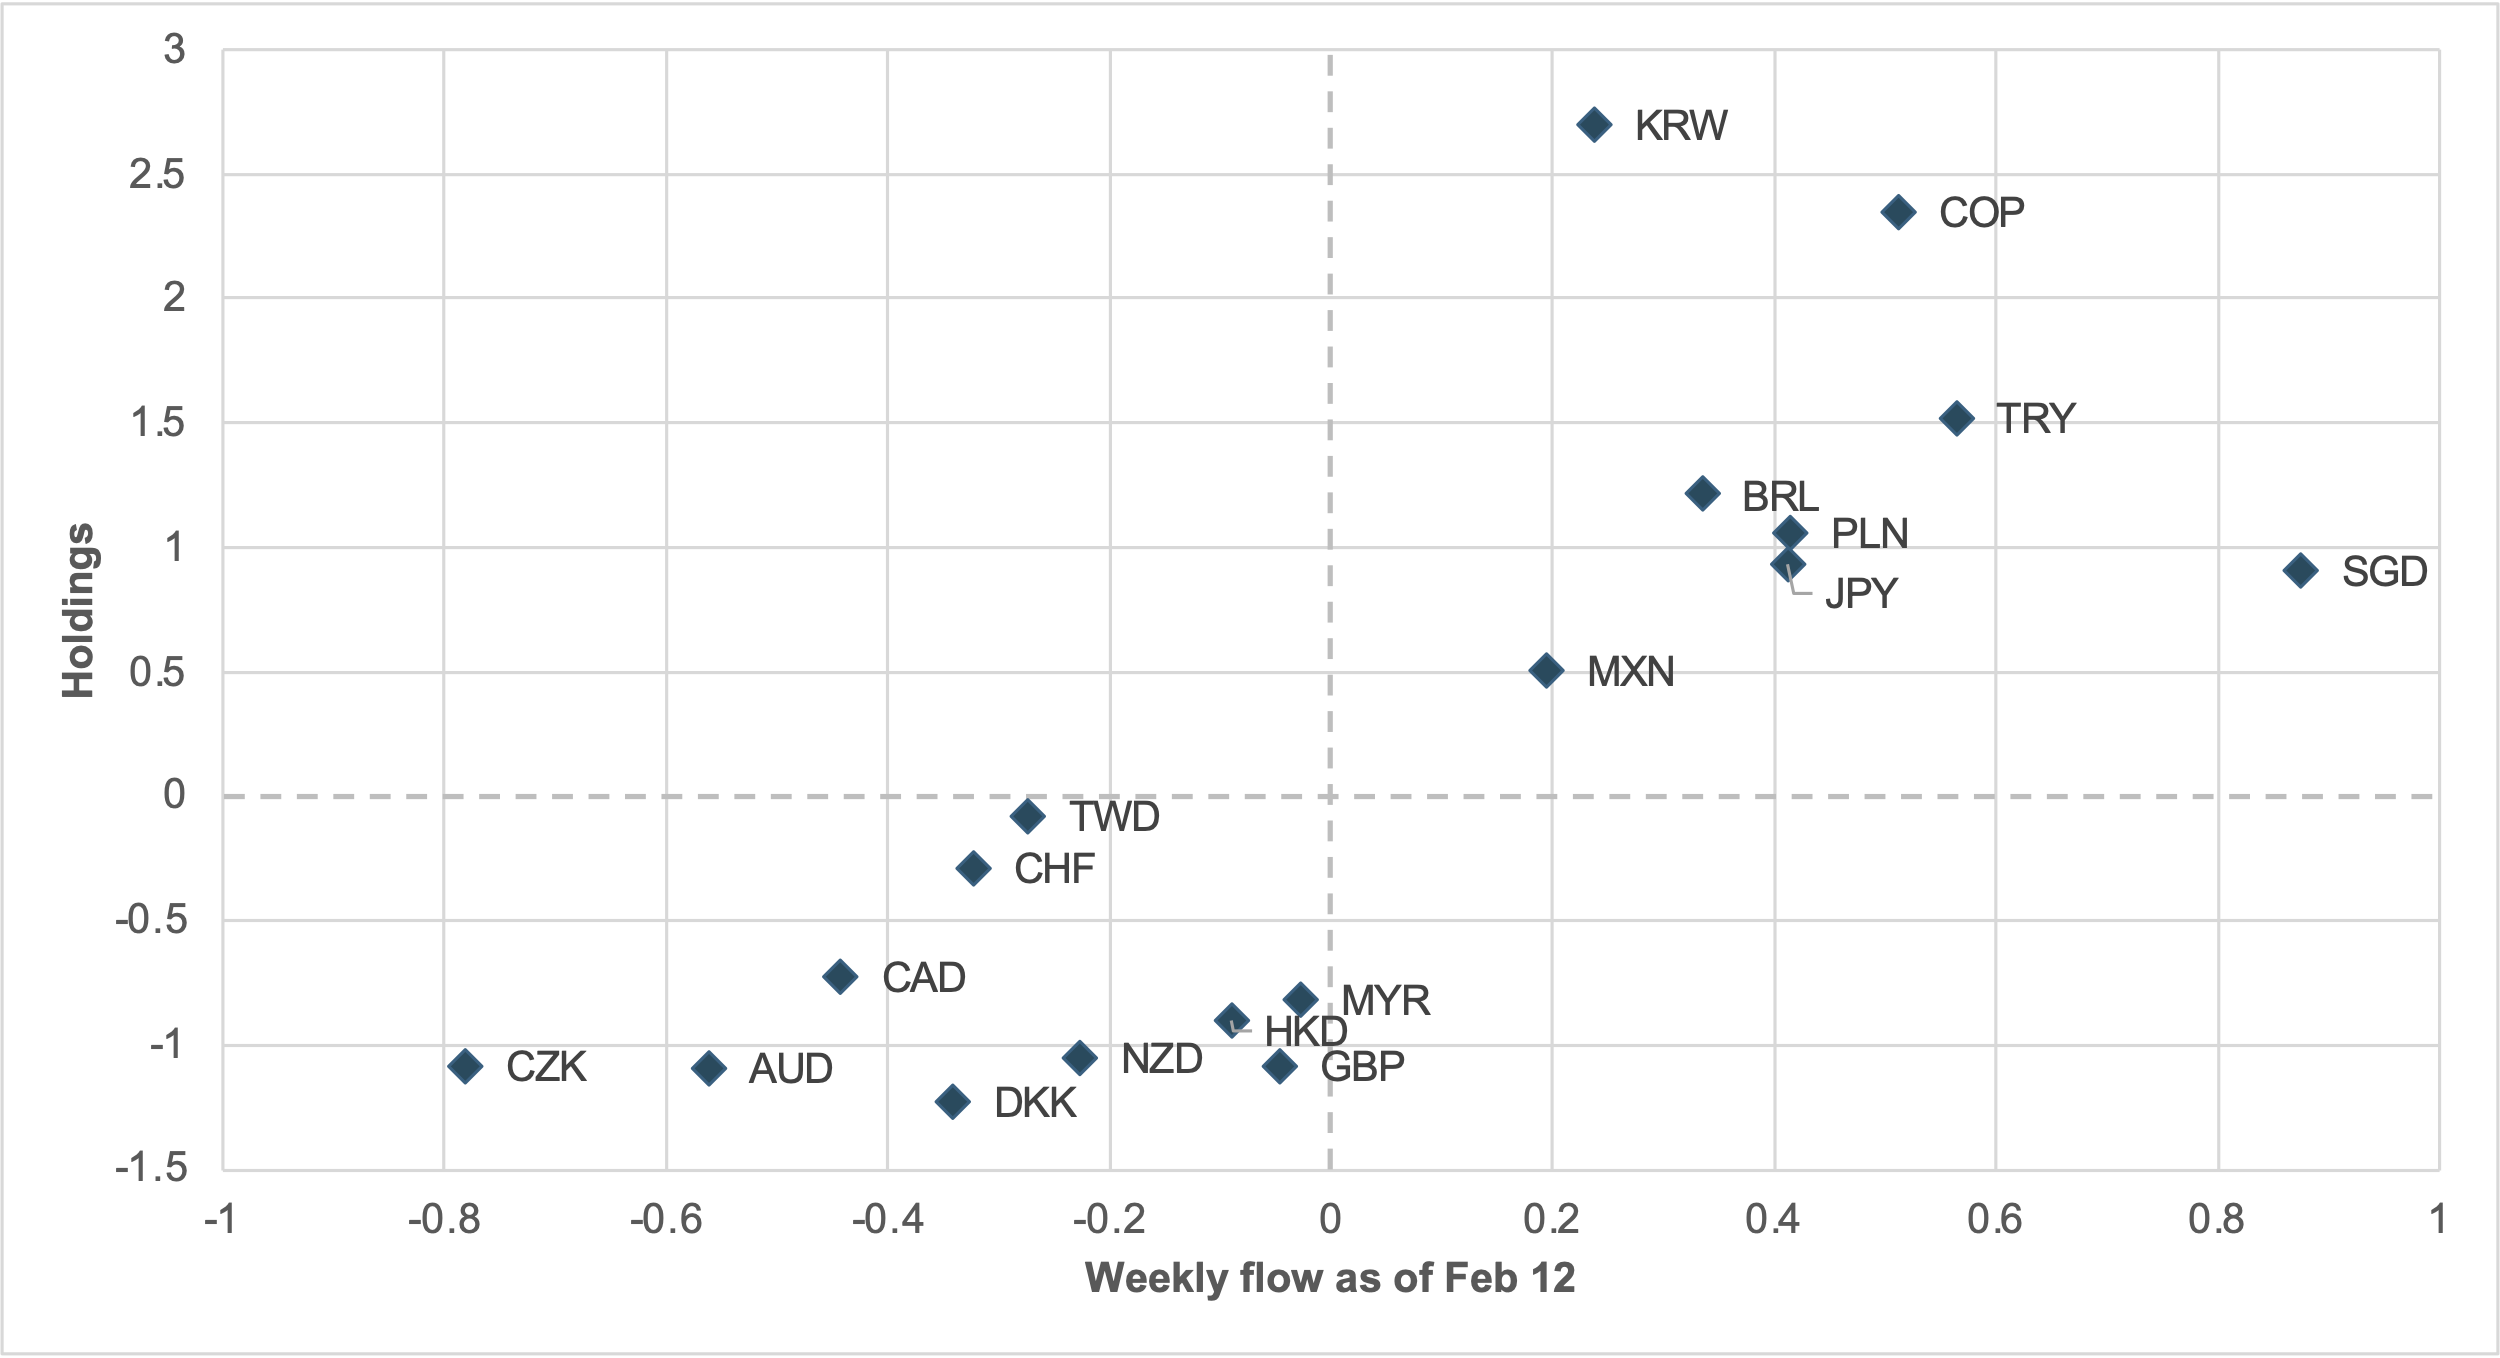
EXHIBIT #1: WEEKLY CROSS-BORDER FLOWS VS. HOLDINGS, ADDING TO HOLDINGS STATUS ONLY
Source: BNY
Our take
Risk appetite in currency markets held up again last week, with limited underlying impact on the carry trade despite the sell-off in global equities.
These positions rose as benign U.S. data, helped to increase U.S. easing expectations. Carry trades are more sensitive than equities to changes in financial conditions through the dollar channel, lending credence to the view that safety characteristics are emerging in certain high-yielding currencies. However, we believe asset allocators remain highly selective.
For example, over the past week, our data show that most iFlow-tracked currencies continue to follow a “conviction” path, whereby overheld currencies are added to and underheld currencies extend further in the opposite direction (Exhibit #1). Of the eight currencies that are currently overheld and were net bought, three are low-yielding Asia-Pacific (APAC) names, while the rest are relatively conventional high-yielders. Latin American (LatAm) currencies continue to dominate, with the traditional BRL and MXN pairing performing well, joined by COP as its central bank moves into the global tightening cycle. The presence of JPY, KRW and SGD continues to support the APAC FX revaluation view, suggesting the region is not seen as attractive for funding due to valuation extremes. In contrast, G10 names populate the underheld-and-sold quadrant, led by the dollar bloc of AUD, CAD and NZD, while CHF and GBP are also struggling, likely for different reasons.
Forward look
iFlow’s current setup shows that multiple “conviction” views can coexist. Liquid, high-yielding carry currencies with a solid structural story, such as MXN, BRL and PLN, should continue to anchor interest, even at a high holdings levels, despite broader weakness in global risk appetite. Meanwhile, the durability of certainty developed market (DM) equity segments is in question, but there is no clear spillover into emerging market (EM) currencies, which have not attracted large cross-border inflows during an extended period of U.S. exceptionalism. The main risk at present for outright FX positions is on the funding leg: AUD, CAD and NZD have for several months been seen as candidates for a pivot toward tightening, with the Reserve Bank of Australia validating such market pricing this month. Furthermore, in an environment where fiscal dominance looms large, CHF and CZK will likely outperform even with rich valuations. The current holdings setup in carry is fair, but flows point to some overconfidence.
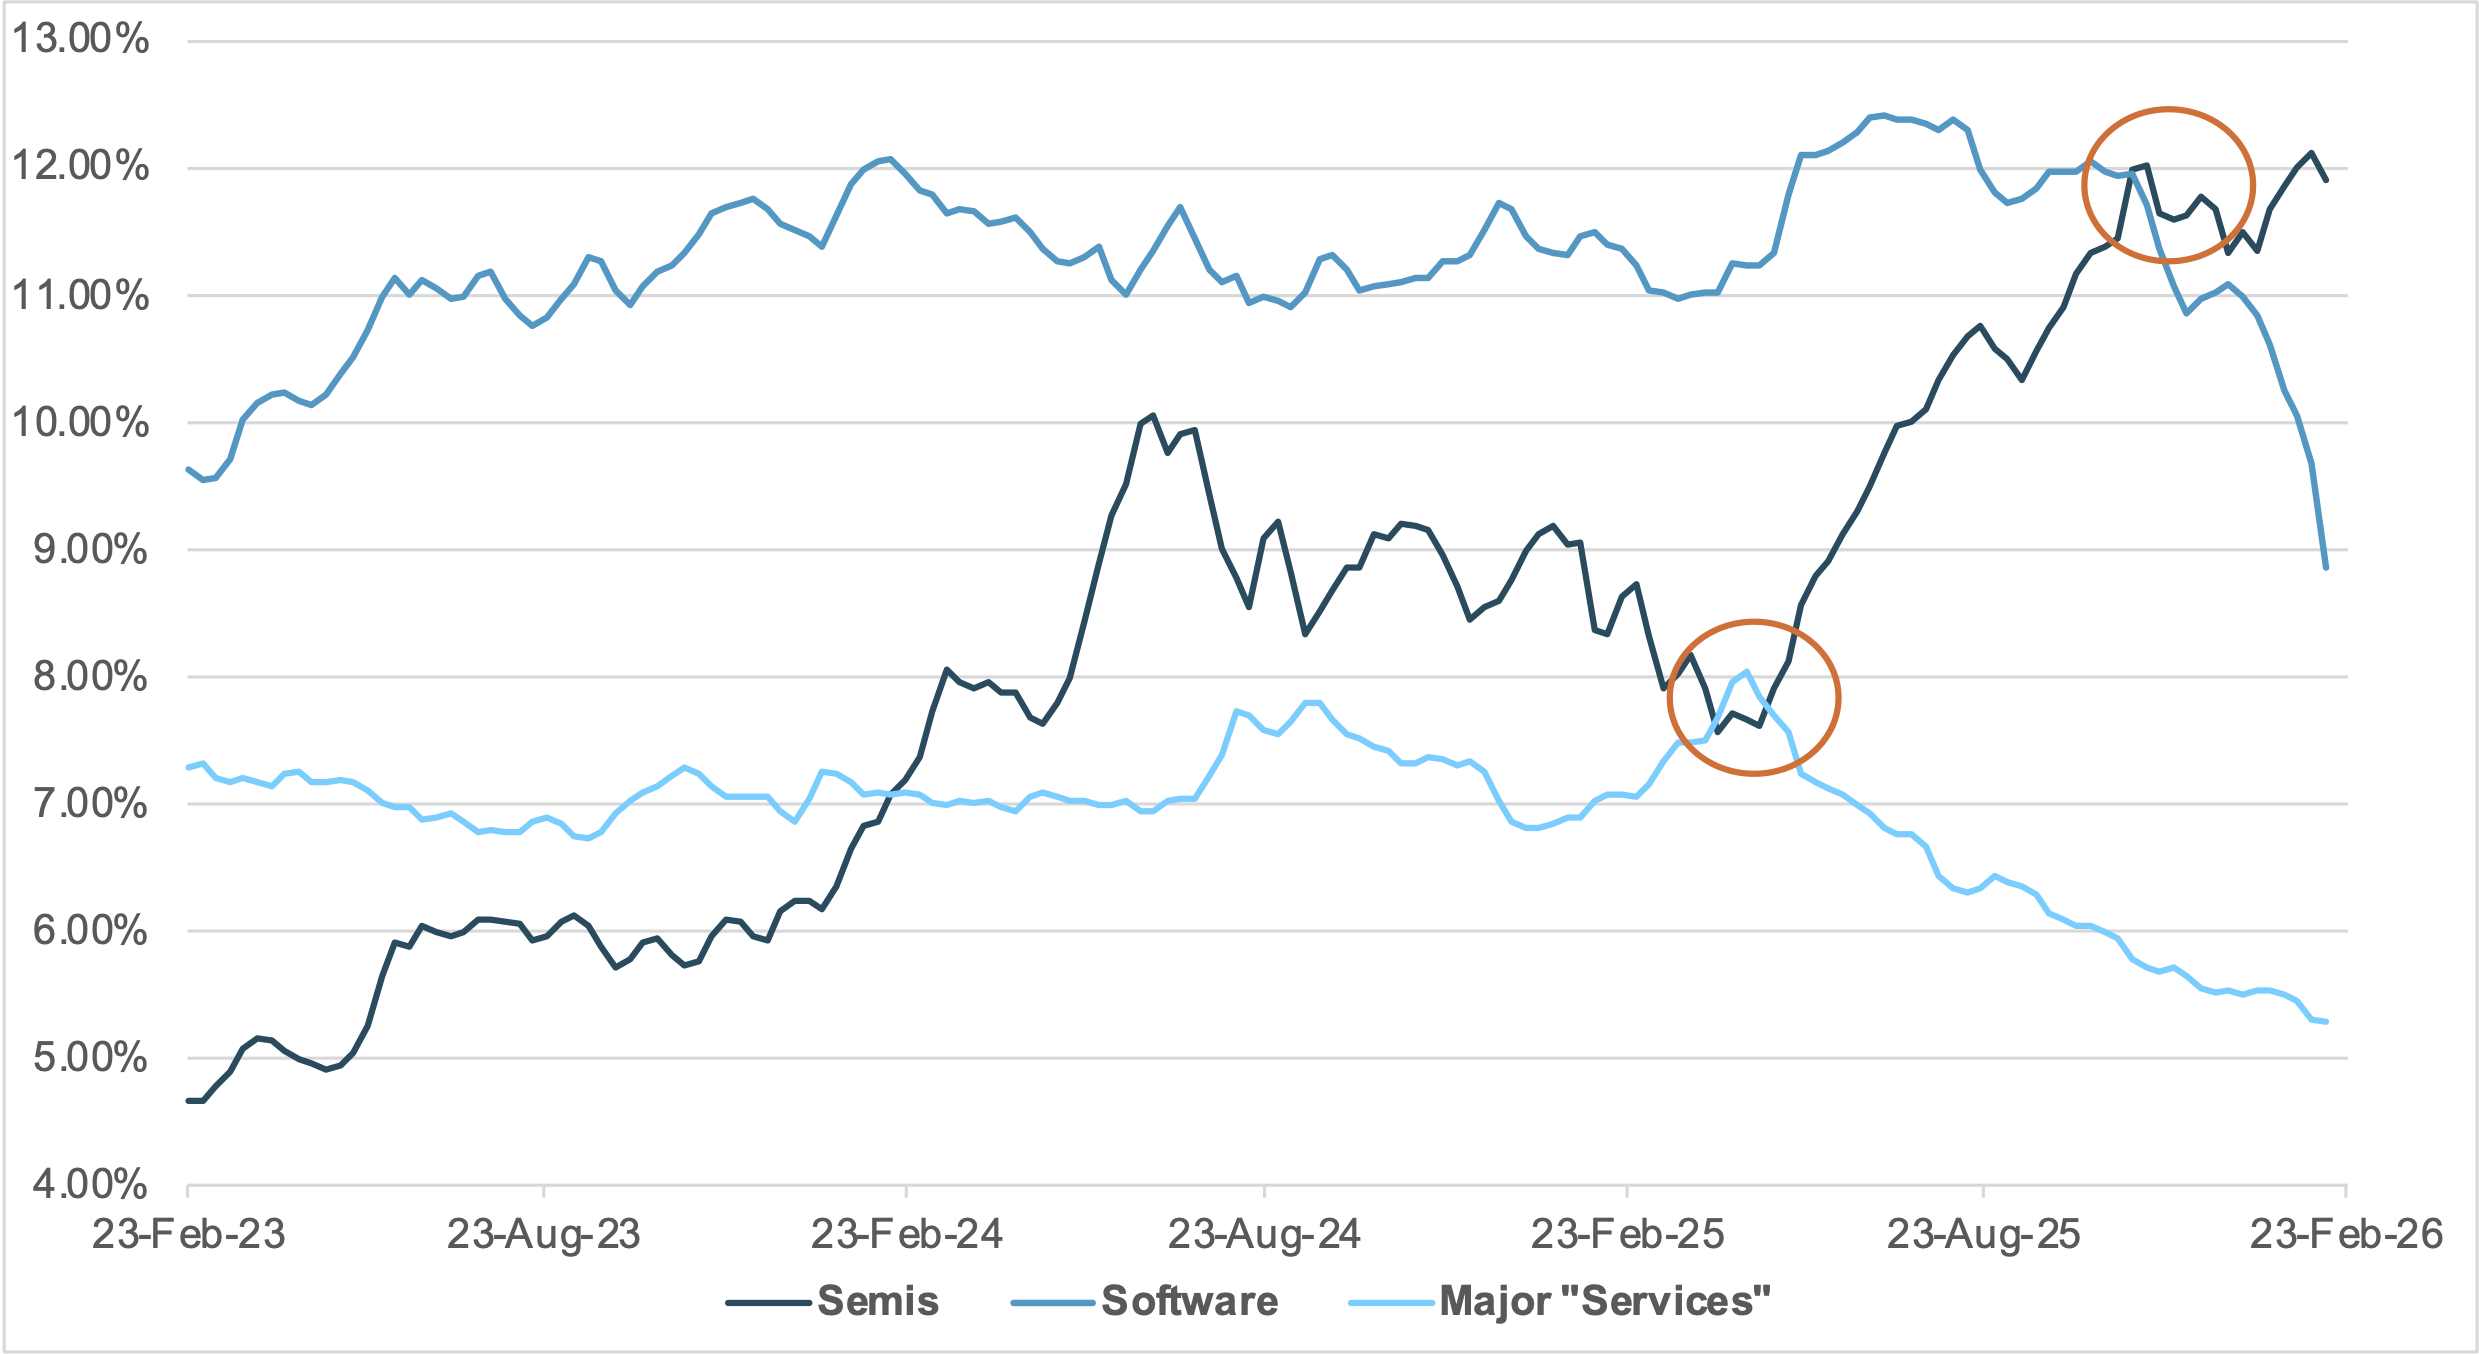
EXHIBIT #2: POSITIONING IN DM SEMICONDUCTORS, SOFTWARE SERVICES, AND OTHER SERVICES (GICS L2 2020, 3510, AND 5010), COMBINED
Source: BNY
Our take
DM “Services” sectors have borne the brunt of the risk-off move over the past week, and we expect a near-term theme will be value-hunting in associated industry groups. The “sell first, ask questions later” phase of AI disruption may have peaked, and there is a case for recovery absent risk factors external to equities, such as monetary policy or geopolitics.
An additional factor is that, relative to history, there is now a positioning case for a broad swath of services-related industry groups. Sometimes lost in the noise over the last two weeks is that, for much of the past cycle in DM, software services as an industry group were consistently over-owned relative to counterparts more directly linked to AI, such as semiconductors. Even taking into account the 2025 surge, semiconductors only surpassed software and services in late 2025. Previously, markets clearly felt that both industry groups could benefit from AI adoption. Furthermore, outside of software services, additional industry groups – such as commercial and professional services, health care equipment and services, and telecommunication services – have also seen a nearly 40% decrease in total positioning over the past year. Yet, after the “Deepseek” shock to semiconductors, these services industry groups were also overheld relative to semiconductors (Exhibit #2).
Forward look
In extremis, AI disruption risks could undermine the customer base that underwrote hyperscalers’ capex thesis. Consequently, the current positioning drift is clearly unsustainable, but the question is whether convergence is additive or further dilutive. With sentiment and positioning indicators starting the year near highs, there is a risk that the pullback continues. However, we emphasize that additional drag will have to come from other forms of tightening in financial markets. How credit markets behave ahead will be crucial. That will be a function of policy expectations, which may finally push the burden of adjustment back toward macro data rather than esoteric headlines in DM equities.
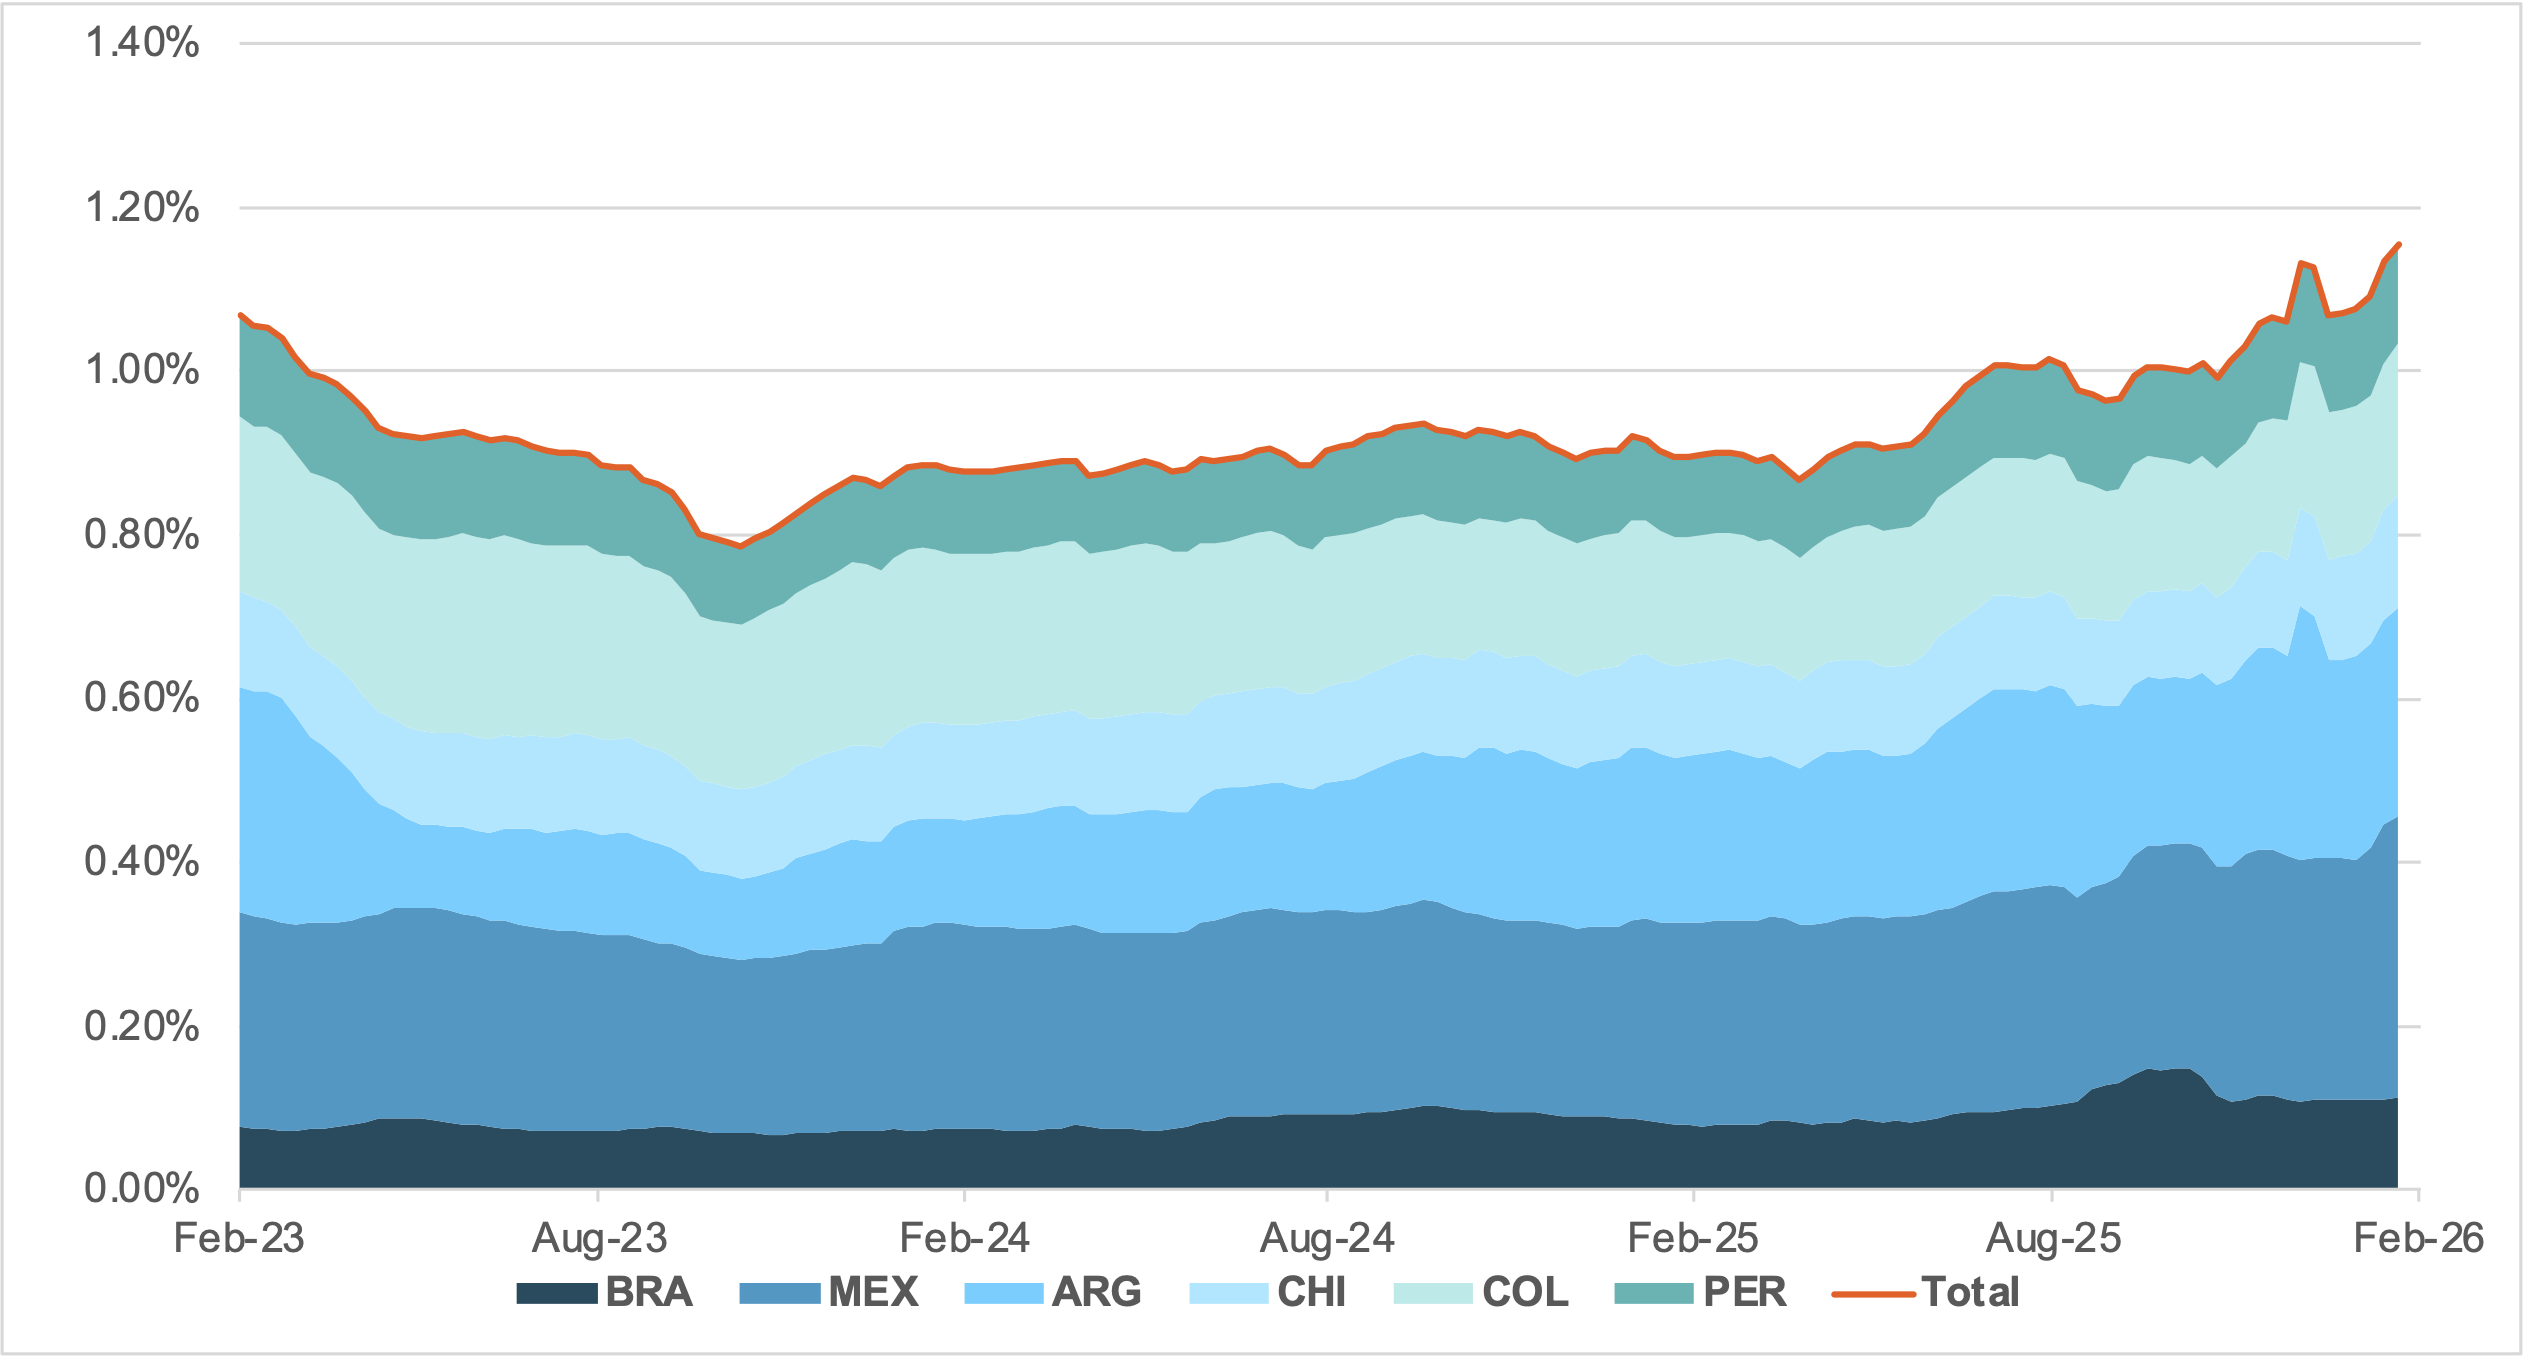
EXHIBIT #3: TOTAL LATAM GOVERNMENT DEBT POSITIONING IN GLOBAL SOVEREIGN PORTFOLIOS
Source: BNY
Our take
Amid the global equity sell-off, the resilience of certain EM assets has even led to the notion that safe-haven status is taking hold.
While there are clear merits for re-rating, whether EM can offer stronger risk-adjusted returns remains far-fetched. The absence of a positive dollar or U.S. rate shock is supporting EM risk-adjusted returns, and the low holdings base is a less tangible but equally important part of the valuations narrative. This is particularly true for LatAm fixed income, which is currently one of the best-held asset classes in iFlow. Our data add up positioning across six key markets: Brazil, Mexico, Argentina, Chile, Colombia and Peru. Combined positioning in these countries’ sovereign debt as a share of global sovereign debt holdings recently surpassed the 2023 highs, when nominal rates peaked (Exhibit #3).
Forward look
Combined sovereign holdings in the region are currently just below 1.2% of total sovereign bond holdings. In relative terms, this represents a nearly 30% gain on an annualized basis, commensurate with the total return realized in some cases. For example, the Bloomberg Aggregate Mexico total return index (unhedged, USD) is up 27% y/y.
The question ahead for the region is what will drive returns now that the positioning layer of valuations is removed, while U.S. yields look set to stabilize or even rise. We recently highlighted that core LatAm currencies are over-owned but not expensive in real effective exchange rate (REER) terms. In fixed income, the asset class is also no longer under-owned relative to history, and fundamentals will need to play a bigger role to sustain or even improve upon current performance. That will require domestic changes and a stable relationship with the U.S., and both processes can introduce exogenous volatility that challenges the region’s current risk-reward profile.