Active ETFs Show Resilience Amid Tariff Turmoil
U.S. Distribution Pulse Quarterly | 2Q 2025
U.S. Distribution Pulse Quarterly | 2Q 2025

Scott Anderson
Time to Read: 3 minutes
Data from BNY Growth Dynamics points to a shift in investor preference towards actively managed. Many of these ETFs are now available via large distribution platforms, making them a more widely available option for advisors. More products continue to accrue multi-year track records and have begun to scale their assets under management (AUM), making them eligible for larger model allocations. Asset managers continue to launch and aggressively market actively managed ETFs, as passive market matures and fee competition remains more intense.
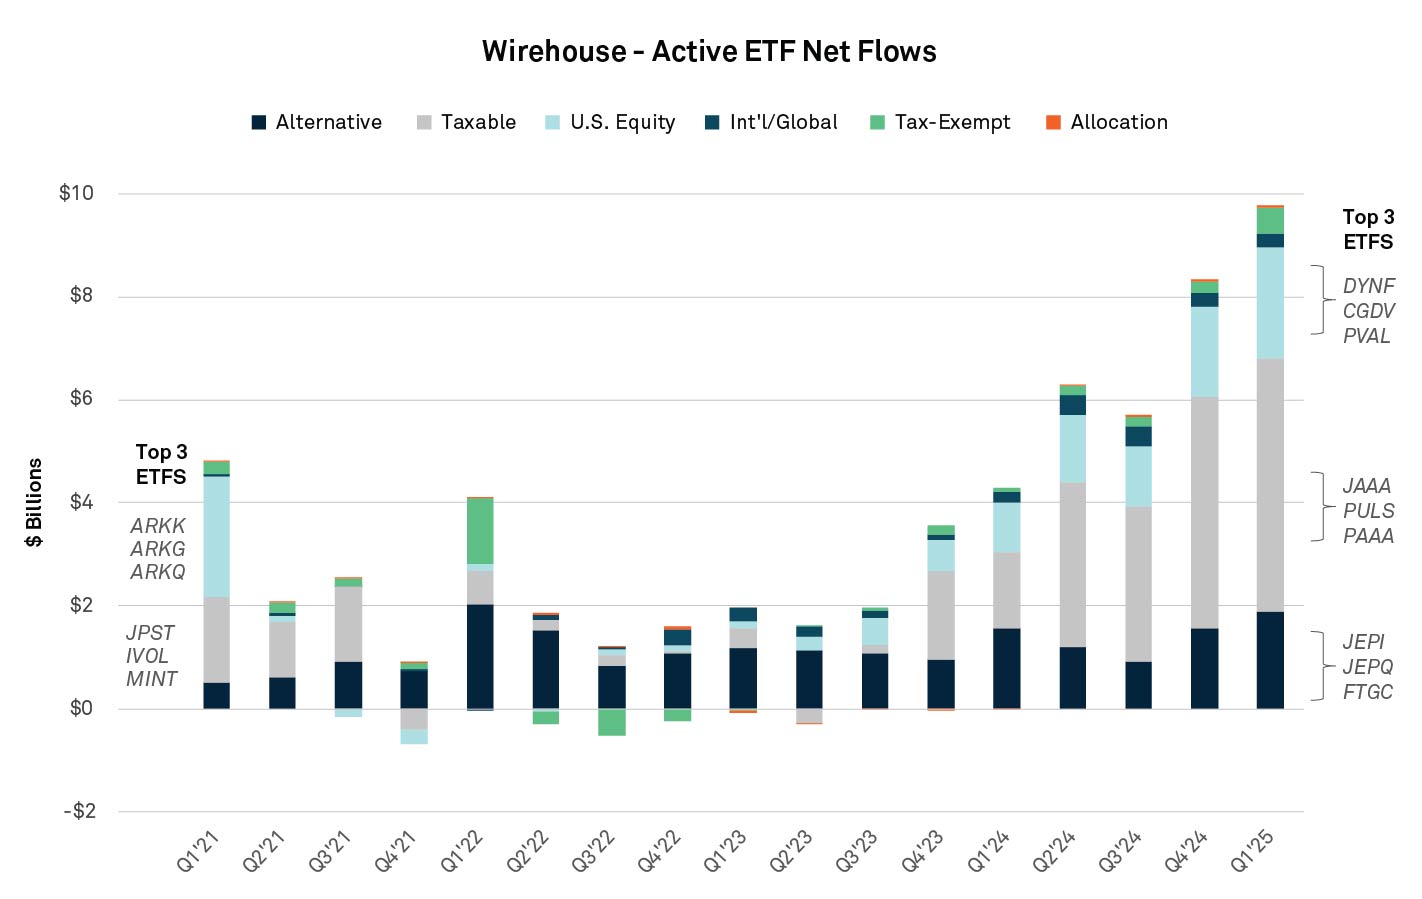
Figure 1: Wirehouse Active ETF Net Flows
Source: BNY Growth Dynamics. Trend data as of March 31, 2025.
A larger number of actively managed ETFs are realizing success, including recent launches like the Capital Group Dividend Value ETF (CGDV), which is actively managed U.S. equities, and the PGIM AAA CLO ETF (PAAA), which focuses on collateralized loan obligations (CLOs). The strength of CLO ETFs suggests a growing interest from advisors in diversification through investment grade credit with higher yields and lower duration risk.
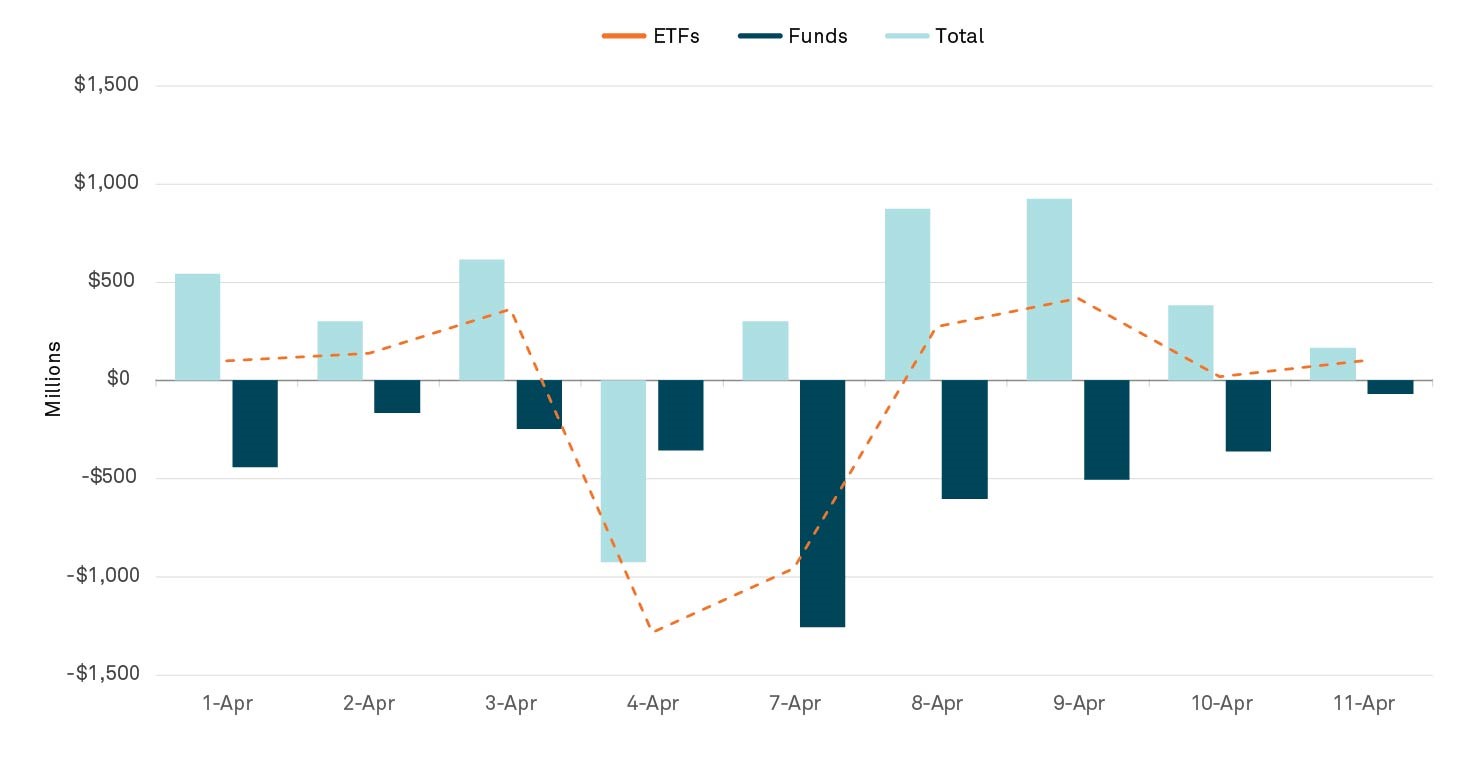
Early April saw heightened volatility as markets responded to news from Washington around U.S. government’s latest tariffs proposals. April data from BNY Pershing’s platform covering the two-week period of April 1 through April 11 reveals an accelerated shift of outflows from mutual funds into ETFs.
During this period, $3.997 billion was moved out of mutual funds. By comparison, BNY Pershing recorded mutual fund outflows of $2.225 billion for the whole of Q1 and $2.907 billion for Q4 2024. During periods of market drawdowns or volatility, ETFs historically take advantage to grab market share resulting from risk-off markets or capture flows originating from mutual funds due to profit-taking, tax-loss harvesting or investment-style reallocation.
Active ETFs also saw positive net inflows, proving resistant to the volatility, while asset moved to “cash-like” ultrashort bond ETFs and large cap equity ETFs benefited from ETF investors seeking to buy the dip.
Figure 2: Pershing Netflows
Source: BNY Growth Dynamics. Trend data as of March 31, 2025.
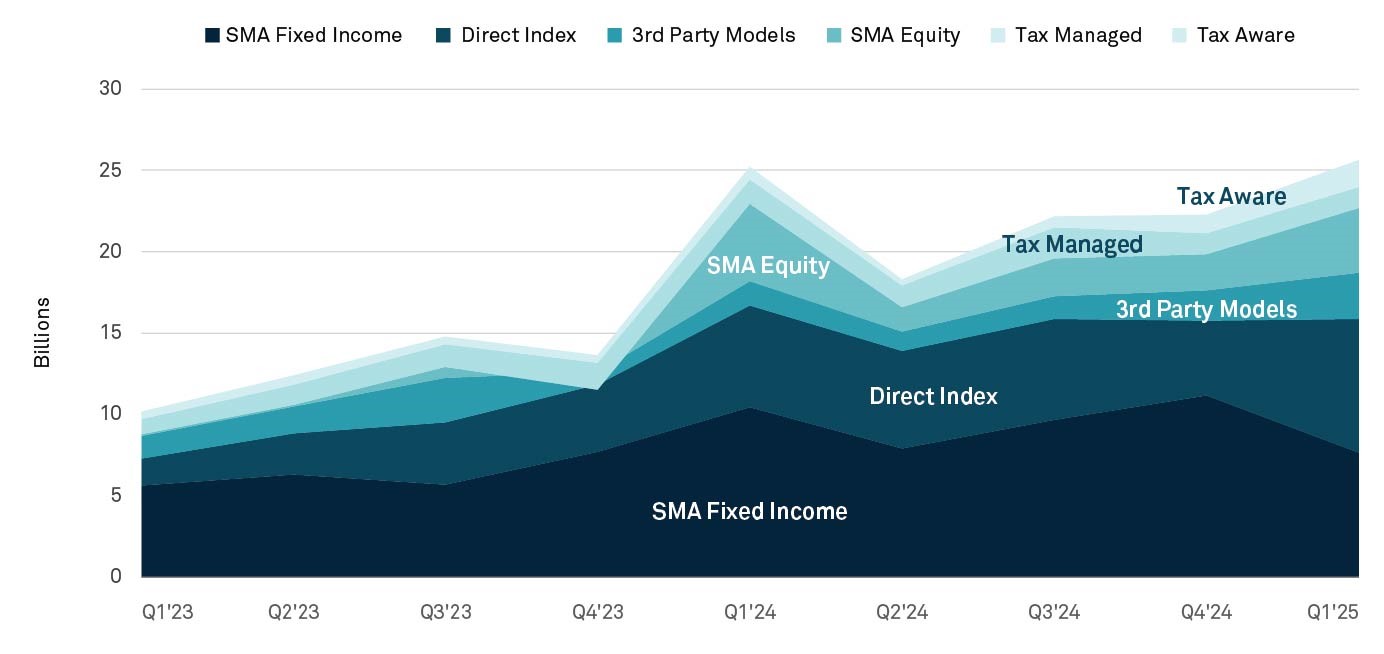
Separately managed accounts (SMAs) recorded strong Q1 flows at wirehouses, reaching $25 billion in net sales, up from $22 billion in Q4 2024. Net sales of SMAs have now outpaced net sales of ETFs during the first quarter for three successive years.
Direct index SMA was a standout performer, with net sales growing 78% to $8.2 billion in Q1 from the prior quarter. It accounted for 34% of Q1 net sales despite representing only 9% of SMA AUM. The demand for direct index SMAs illustrates a growing appetite for bespoke solutions that can be tailored to meet personal investment preferences amid market volatility, as well as offering opportunities for greater tax-loss harvesting efficiency.
Taxable fixed-income SMA also gained market share, representing 10% of SMA AUM, but 28% of net sales. Taxable fixed income garnered positive Q1 sales across all three wrappers: $6 billion for mutual funds, $5 billion for active ETFs and $3 billion for SMAs.
U.S. equities continue to grow inside SMAs, both direct index and traditional SMAs, which is eating into the market share for mutual funds.
Figure 3: Wirehouse Managed Account Net Sales
Source: BNY Growth Dynamics. Trend data as of March 31, 2025.
All flow data is sourced from BNY Growth Dynamics as of March 31, 2025. The aggregate data used in this analysis is based on Mutual Fund, ETF and SMA asset and sales data reported to BNY Growth Dynamics under a data sponsor agreement. The data set includes sales through a financial advisor and excludes institutional and retirement plan sales.

Estimated assets under management held in depositary receipts rose to $1.2 trillion in 2026. Learn how depositary receipts are expanding global market access.

Securities finance in Asia Pacific is now a multi-asset discipline delivering institutional outcomes — income, liquidity, funding, and resilience — across diverse regulatory and market structures. Regional dynamics — including regulatory nuance, collateral practices, and cross-border flows — shape how supply meets demand across mature markets like Japan and Australia, regulatory-led locations like Taiwan and Korea, and fast-evolving ecosystems in Southeast Asia.