Turbulence in Taxable Fixed Income as International and Global Equity Shine
U.S. Distribution Pulse Quarterly | 3Q 2025
U.S. Distribution Pulse Quarterly | 3Q 2025

Scott Anderson
Time to Read: 5 minutes
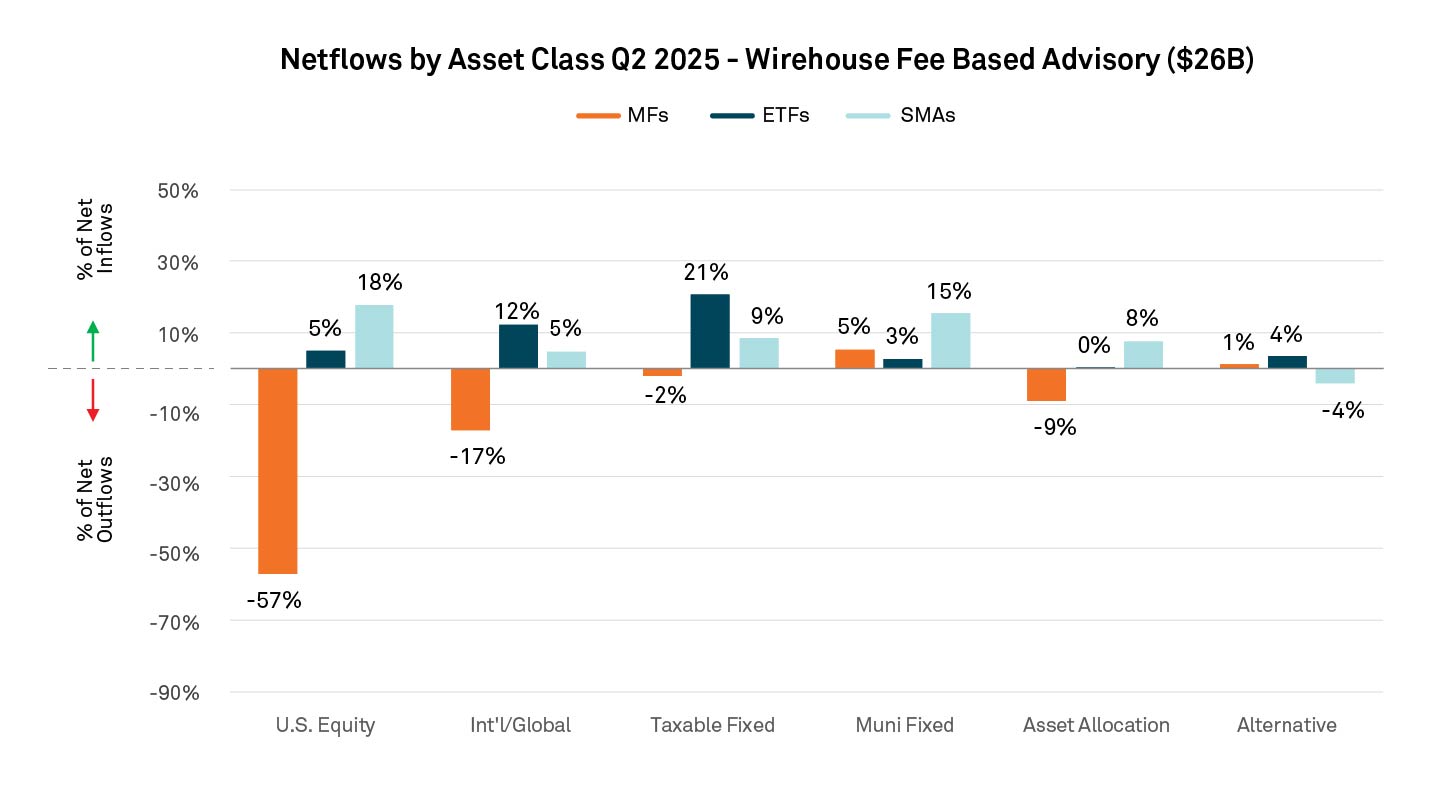
International and global equities had strong Q2 inflows in both SMAs and ETFs as investors looked to diversify their exposure. Demand reflects several tailwinds such as improving fundamentals and policy stimulus in Europe, relatively more attractive valuations versus U.S. equities, a softer U.S. dollar and some rebalancing by sovereign wealth and other institutional investors away from U.S. exposure — all of which continue to pull assets into international and global strategies. International equity ETF sales exceeded traditional U.S. equity ETF flows in Q2*, indicating a renewed interest in non-U.S. exposure. Data shows investors allocated toward both passive and active strategies for their non-US exposure. The active flow in active included quant-based strategies such as Avantis Emerging Markets Equity ETF (AVEM). A significant amount of this growth originated from broker dealer model platforms, which also indicates some of these assets are likely longer-term strategic allocations versus tactical trading opportunities.
While smaller in comparison to ETFs, total inflows for international and global SMAs were the highest since Q2 2023.
ETFs and SMAs continued to drive U.S. equity wirehouse net flows. U.S. equity ETFs were driven by core passive exposures (e.g. S&P 500 Index) , with a large portion coming from commission-based platforms. SMA growth in the U.S. equity category continues to be driven by direct index, tax managed and tax aware strategies.
Q2 2025 Netflows by Asset Class ($26B)
BNY Archer platform data illustrates the broader trends. Advisors are leading with tax‑managed solutions, such as tax‑optimized equity and muni ladders, to drive more consistent after‑tax outcomes. With improved operational infrastructure and technology, managers can now deliver these capabilities at scale. This packaging aligns with how advisors are collaborating with product manufacturers to deliver a broader set of tax-aware and international strategies with efficient implementation.
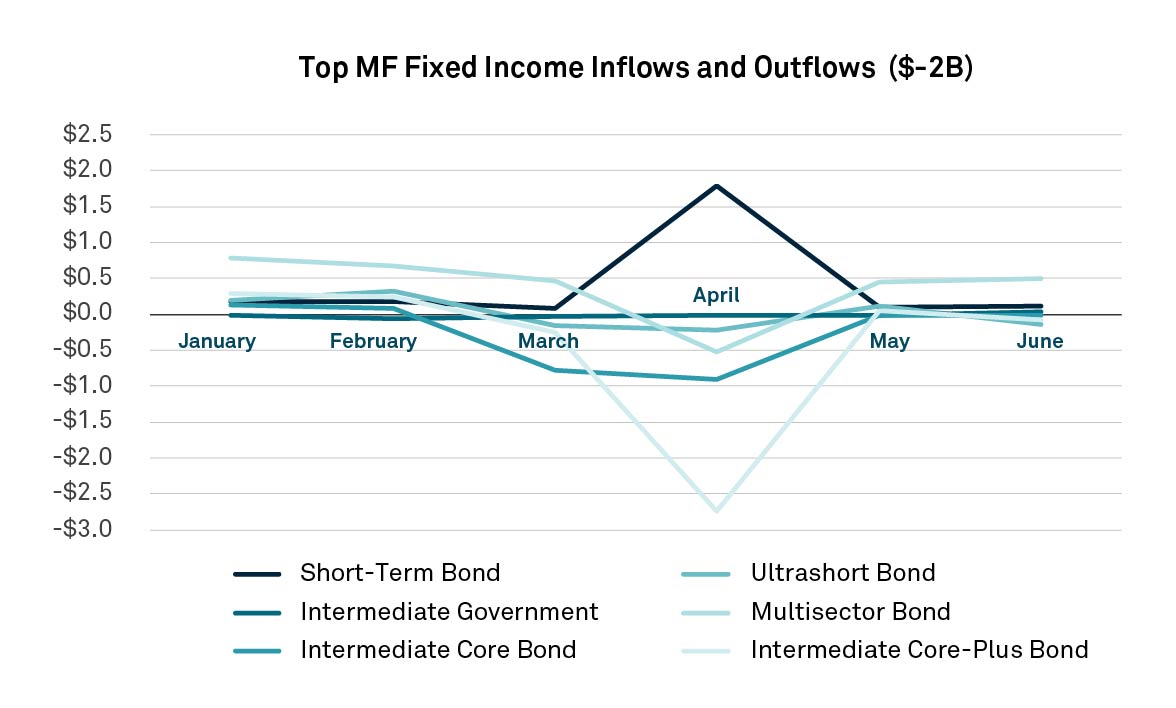
Q2 saw rate uncertainty lead to core taxable fixed income mutual fund outflows. Overall taxable fixed income funds saw outflows for the first time since 2023 while ETFs and SMAs had inflows in taxable fixed income highlighting the ongoing structural shift. Some of this asset shift came in April amid the market volatility due to tariff announcements. While flows returned to pre-April levels in May and June, outflows were negative for the quarter.
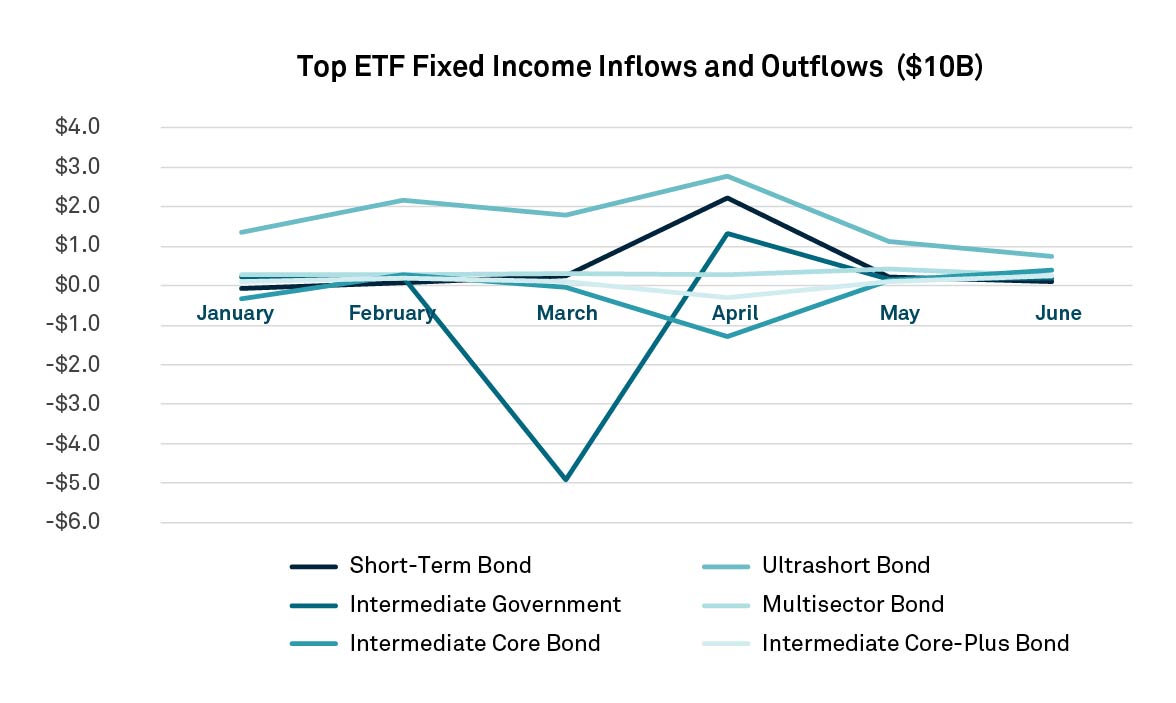
Within taxable fixed income, ETF flows shifted away from higher-duration Core and Core Plus strategies toward Ultra Short and Short Duration products, reflecting growing caution around interest rate risk. Ultra Short (both index and active) and Short (index) strategies were the flow leaders, with some allocations to the Intermediate Government (index) category.
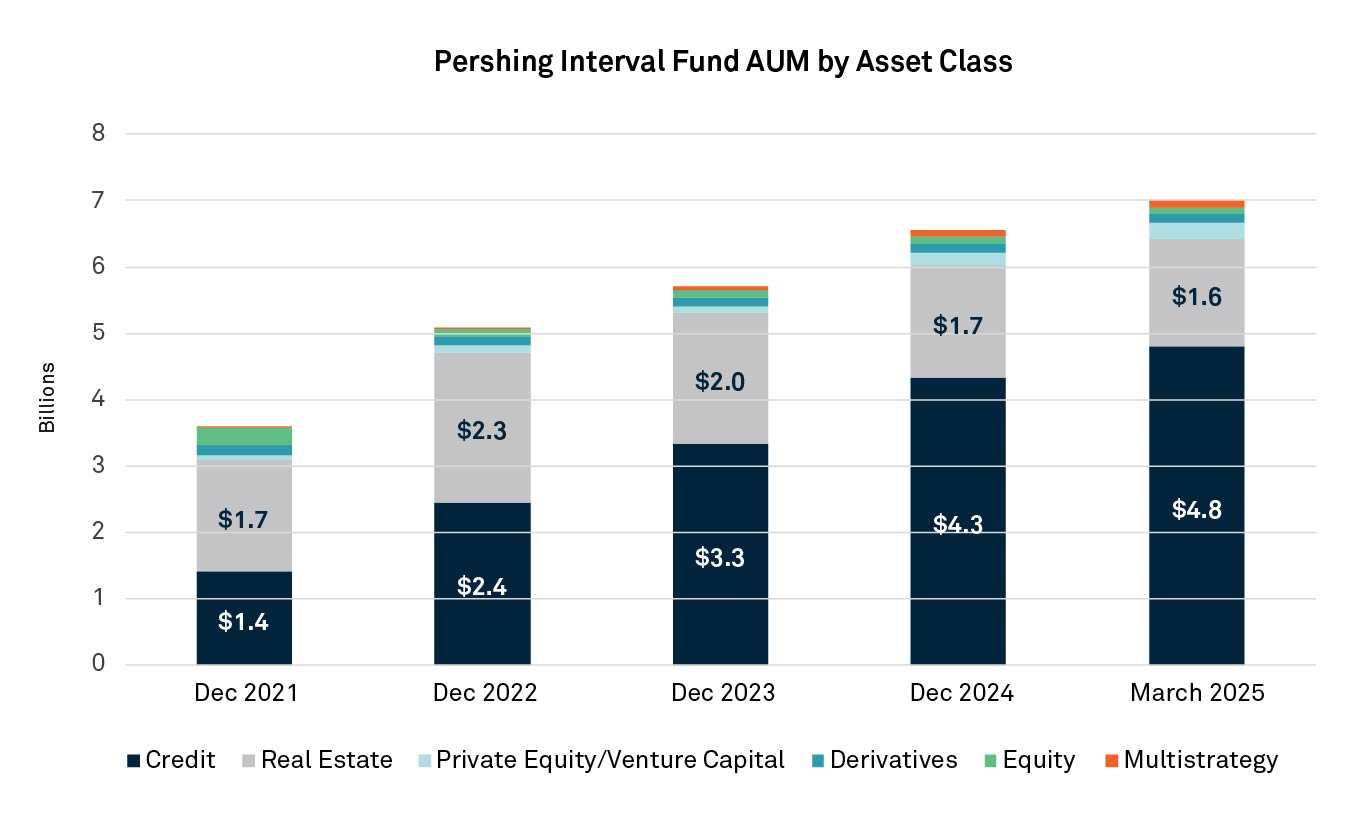
Interval funds are seeing strong growth industry-wide. For example, Pershing client demands drove a 14% increase in platform assets under management (AUM) from December 31, 2024 to June 30, 2025. Private credit remains the biggest driver of interval fund investment, accounting for 70% of assets. Real estate follows with 23% of assets but has seen a slowdown in asset flow.
While interval fund assets remain heavily concentrated, opportunities for new entrants are emerging. While the top 10 funds represent 76% of assets, new funds are gaining traction. In 2025 YTD, 17% of net new assets were to funds with an inception date of 2023 to present with that number expected to grow.
Interval funds often thrive in areas where ETFs can’t, thanks to their flexible liquidity structure. Despite ongoing industry efforts to add less-liquid strategies into ETF wrappers, interval funds uniquely capture assets and access markets that present challenges for ETFs.
Increasingly, wirehouses are packaging interval funds into SMA models, exposing them to investors and further boosting demand.
For more information please reach out to the BNY Growth Dynamics team.
All flow data is sourced from BNY Growth Dynamics as of June 30, 2025. The aggregate data used in this analysis is based on Mutual Fund, ETF and SMA asset and sales data reported to BNY Growth Dynamics under a data sponsor agreement. The data set includes sales through a financial advisor and excludes institutional and retirement plan sales.

Advanced manufacturing hubs, export economies, growing industrial markets and shipment routes are reshaping Asian trade flows. Learn how banks are adapting.

The growth of private markets has revealed deficiencies in data management that need to be addressed. Francisco Ceballos, product manager for Platform Experience and Core Capabilities at BNY discusses how asset owners and asset managers can do this and the importance of centralized data management.

As CASS 15 raises the bar for safeguarding, EMIs and payment service providers have an opportunity to strengthen controls, streamline operations and build greater confidence in their client asset frameworks. Explore the practical steps firms can take to prepare for a more structured and auditable regime.

Alternative investing is expanding into the RIA channel. Learn how managers tailor evergreen/interval funds and long‑short SMAs with liquidity, tax efficiency, and scalable infrastructure.