Market Movers: Looking Through Month-End
Market Movers highlights key activities and developments before the U.S. market opens each morning.
Market Movers highlights key activities and developments before the U.S. market opens each morning.

Bob Savage
Time to Read: 8 minutes
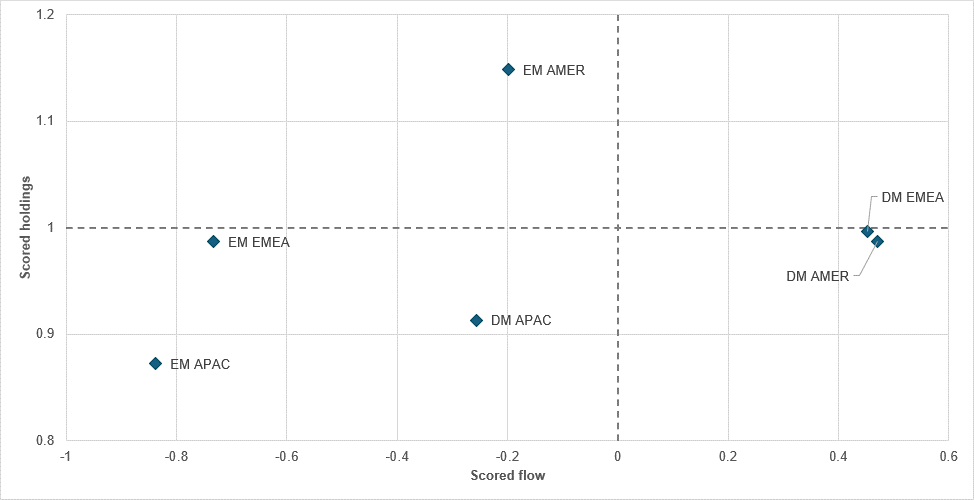
Holdings gap among strongly sold assets in March is largest in fixed income
Source: BNY, monthly averages for fixed income markets by region
We continue to expect extended conversations surrounding asset rebalancing as month-end and quarter-end approach. Based on asset performance and realized FX flows, there are several standout currencies which, in theory, should perform well. However, there are significant fundamental caveats that continue to justify a materially large valuation gap – measured not only through levels and multiples, but also through positioning and holdings.
It is in this latter dimension that we suspect most asset allocators are not seeing much “value,” and this appears consistent across asset classes. For example, INR is continuing to struggle. On a monthly average basis within APAC (and measured against other currencies in iFlow), INR was the most-sold currency on a realized basis. At first glance, this may support the case for adding exposure, but flow reversion is only part of the story. On a holdings basis, monthly average positioning in INR is largely flat, and at the onset of the conflict it was comfortably in overheld territory as a carry name. A more compelling risk/reward payoff would only emerge when a currency is not just heavily sold, but sold from an underheld position.
Applying the same framework across other asset classes, equity sales and the associated decline in holdings during the conflict have not meaningfully opened up “value” for mean reversion. Unsurprisingly, EM EMEA has ended the month with the weakest holdings position across regions, but it remains only marginally below the rolling 12-month average. Across asset classes, fixed income is likely where risk/reward appears strongest, as a global supply shock directly pushes up inflation premia. Front-end pricing has adjusted aggressively, although some degree of mean reversion has already taken place.
On a monthly average basis, EM Americas remains the only region that is still comfortably overheld, but even here exposures have been reduced, suggesting markets expect some transmission into the region as well. This is despite a broadly positive terms-of-trade shock that should, in principle, support real rates. EM APAC and EM EMEA were the most heavily sold regions, reflecting the more pronounced supply shocks affecting their respective economies.
Wavering headlines about war and month-end flows leave markets mixed. USD is flat; bonds are bid and global equities are mixed, with U.S. futures higher. Central bankers’ ability bankers to look through the energy supply shock is driving bond relief again; this started with Chair Jerome Powell yesterday and continuing with the NY Fed’s John Williams overnight. The WSJ report that the president is willing to end the war without reopening the Strait of Hormuz helped risk, but with some notable shortfalls. The South Korean KOSPI fell 2%, and KRW is down 0.6%. China reported better PMI numbers, but the CSI 300 fell 0.93%. The U.S. session will test investors’ patience as they wade through month-end, with key housing and labor reports setting the stage for Q2 policy risks.
Bottom line: Today’s U.S. Jolts report will be influential, if only because will anchor the arguments about looking through the war. The USDA’s crop planting report will set the tone for second-round effects on food inflation at midday. The shift in narrative from a quick end to the war to the costs of the war for the economy will be critical to how investors see Q2. There is less urgency in markets today, so less of a surge for a significant turnaround in risk. Looking through is not the same as passing through the worst fears. Manifesting reality requires consistent action and a clear plan for trading peace. Expect the dollar to remain the barometer of measuring that pass-through work, as markets cling to the oil/dollar correlation driving asset prices.
South Korean President Lee Jae Myung today instructed senior officials to take bold measures to address concerns over the energy situation caused by the war in the Middle East, saying the government may issue an emergency economic decree if necessary. Key raw materials, such as urea solution, helium and aluminum, should be strictly managed at levels equivalent to wartime supplies. Under Article 76 of the country’s constitution, the president may issue an order, with the effect of an act, in times of grave financial crisis, natural calamity or internal turmoil, without waiting for the approval of the National Assembly. KOSPI -4.26% to 5052, USDKRW -0.742% to 1531.05, 10y KTB -3bp to 3.895%.
Iran struck a Kuwaiti-flagged oil tanker near Dubai overnight with a drone, damaging the hull and igniting a fire that was later contained with no oil spill and all 24 crew reported safe. The vessel was fully laden and anchored in a congested holding area near the Strait of Hormuz, where hundreds of ships are waiting amid ongoing disruptions. The attack, one of the most significant in recent weeks, pushed oil prices higher, with WTI crude rising nearly 4% toward $107 per barrel, before easing back. The incident highlights persistent security risks and continued disruption to energy shipping routes in the region. Brent -0.699% to 106.64, WTI -0.467% to 102.4, Omani crude +31.157% to 123.93, Dubai crude +1.5% to 111.462.
The UNDP estimates that the ongoing conflict in the Middle East will reduce regional GDP by 3.7% to 6.0%, equivalent to losses of $120-194bn and exceeding total growth achieved in 2025. The escalation is projected to drive up unemployment by up to 4 percentage points, resulting in 3.6 million job losses and pushing up to 4 million people into poverty. Economic losses are concentrated in the Gulf and Levant, where GDP could shrink by 5.2% to 8.7%, driven by trade disruptions and energy shocks. Poverty impacts are most severe in the Levant, with up to 3.3 million additional people affected, while the human development index for the region is expected to decline by 0.2% to 0.4%, reversing recent gains.
ECB Governing Council member Madis Müller has said interest rates are likely to rise over the coming quarters as elevated energy prices linked to the Iran conflict continue to add to inflation pressures. He warned that policymakers will need to respond if high energy costs persist for an extended period, reinforcing expectations of further monetary tightening. Müller also said the ECB’s baseline projection of 2.6% inflation in 2026 already appears optimistic given how long energy prices have remained elevated, suggesting upside risks to inflation and a stronger likelihood that borrowing costs will need to increase. Müller remains one of the most hawkish members of the Governing Council and is in favor of an early move. Euro Stoxx 50 +0.36% to 5562, EURUSD +0.018% to 1.1467, BBG AGG Euro Government High Grade EUR 0bp to 3.358%.
The central bank of Colombia (BdlR) is expected to continue its tightening cycle with a 100bp hike to 11.25%.
U.S. January FHFA House Price Index forecast to hold at 0.10% m/m vs. 0.10% m/m.
U.S. January S&P CoreLogic Case-Shiller 20-City Index is expected at 0.35% m/m, 1.38% y/y vs. 0.47% m/m, 1.38% y/y in December.
U.S. March MNI Chicago PMI forecast to ease to 54.6 vs. 57.7.
U.S. March Conference Board consumer confidence is expected to ease to 88 vs. 91.2; close attention will be paid to its jobs easy vs. hard- to-get section.
U.S. February JOLTS job openings forecast to ease to 6.895 million vs. 6.946 million, with the focus on layoffs and quit rates.
U.S. March Dallas Fed services activity is expected at -4.6 vs. -3.2 in February.
Canadian January GDP is expected at 0.00% m/m, 0.40% y/y vs. 0.20% m/m, 1.00% y/y in December.
U.S. Treasury sells $75bn in 6-week bills.
Fedspeakers: The Chicago Fed’s Austan Goolsbee speaks at noon about economic mobility. Kansas City Fed’s Jeffrey Schmid speaks at 1.10pm on monetary policy. Governor Michael Barr speaks at 3pm on stablecoins, while Governor Michelle Bowman speaks at 5.10pm about small businesses.
Mood: iFlow Mood has stabilized at -0.067, with increased equity selling and reduced demand for bonds.
FX: Flows were mixed and light in G10. Inflows into NOK, JPY, USD and CHF contrasted with outflows from EUR, NZD and DKK. In EM, ZAR, TRY and SGD saw significant outflows, while HUF, COP and PHP attracted strong inflows. EUR long positioning is nearing neutral, while USD underweight positions continue to be covered.
FI: Mixed flows across G10 and LatAm, with a selling bias in EMEA and APAC. Demand was seen for Eurozone bonds, U.K. gilts, U.S. Treasurys and Chinese, Thai, Mexican and Colombian government bonds, while Indonesian, Indian and Malaysian bonds faced selling pressure.
Equities: Broad-based equity outflows across the iFlow universe, with selective inflows into Poland, Australia, Peru and Thailand. The largest outflows were concentrated in Switzerland, Japan, Türkiye, India, South Korea and Malaysia.
“You can't go on ‘seeing through’ things forever. The whole point of seeing through something is to see something through it. To ‘see through’ all things is the same as not to see.” – C.S. Lewis
“You must look within for value but must look beyond for perspective.” – Densi Waitley
The euro area’s flash inflation estimate showed a 2.5% y/y rise in March, up from 1.9% in February. The acceleration was driven primarily by a sharp rebound in energy prices. Energy inflation rose to 4.9% y/y from -3.1%, while services inflation eased slightly to 3.2% from 3.4%. Food, alcohol and tobacco inflation moderated to 2.4% from 2.5%, and non-energy industrial goods slowed to 0.5% from 0.7%. Core measures remained more stable, with inflation excluding energy at 2.3%. The data indicate that the pickup in headline inflation was largely energy-driven, while underlying price pressures showed signs of gradual easing. Euro Stoxx 50 +0.36% to 5562, EURUSD +0.018% to 1.1467, BBG AGG Euro Government High Grade EUR 0bp to 3.358%.
Germany’s February import prices fell 2.3% y/y while rising 0.3% m/m, with the y/y decrease driven primarily by a 20.9% y/y drop in energy prices, despite a 0.9% m/m increase. Export prices declined by 0.1% y/y and rose 0.1% m/m, reflecting continued disinflationary pressures. Excluding energy, import prices fell 0.2% y/y, while intermediate goods prices rose 2.5% y/y, supported by higher metal prices. Import prices for consumer goods were down 3.2% y/y and agricultural goods fell 5.7% y/y. On the export side, energy prices dropped 19.5% y/y, while capital goods rose 0.5% y/y and intermediate goods increased by 1.4% y/y, highlighting divergence across components. DAX +0.51% to 22677, EURUSD +0.018% to 1.1467, 10y Bund -0.8bp to 3.027%.
Germany’s retail sales fell 0.6% m/m in real terms and 0.7% m/m in nominal terms in February, following a revised 1.1% m/m real-terms fall in January. Meanwhile sales rose 0.7% y/y (real) and 1.6% y/y (nominal). Food retail sales declined by 1.4% m/m in real terms and 1.9% in nominal terms, though they increased by 0.1% y/y in real terms. Non-food retail sales rose 0.7% m/m in both real and nominal terms, with y/y gains of 1.1% and 1.7%, respectively. Online and mail-order sales increased by 0.6% m/m (real) and 0.7% (nominal), with stronger y/y growth of 2.2% and 2.4%, respectively, indicating relative resilience in e-commerce demand. Given current circumstances, softer household demand will likely be welcome to avoid compounding headline inflation gains.
German employment was flat m/m at 0.0% in February, with the employment count at 45.5 million, while it fell 0.2% y/y, extending the downward trend seen since August. Seasonally adjusted employment fell by 10,000 compared with January, marking a continuation of recent monthly declines, while non-adjusted figures showed a marginal drop of 4,000. Unemployment increased by 14.5% y/y to 1.84 million, with the unemployment rate rising to 4.2% from 3.7% a year earlier. On a seasonally adjusted basis, unemployment fell slightly by 2,000 m/m to 1.76 million, leaving the adjusted unemployment rate unchanged at 4.0%.
Germany’s labor market showed no change in unemployment or underemployment on a seasonally adjusted basis in March, with the expected spring recovery remaining weak amid ongoing economic softness and headwinds from the Iran conflict. Demand for labor stabilized at a low level, while employment declined in January, particularly in manufacturing, without being offset by public sector services. A total of 4.857 million people received unemployment-related benefits, including 1.104 million on unemployment insurance and 3.820 million on basic income support, with unemployment benefit recipients rising 98,000 y/y. Participation in labor market programs increased to 713,000, with an activation rate of 15.9%, while apprenticeship vacancies fell and applicant numbers edged higher.
French CPI increased by 1.7% y/y in March, up from 0.9% in February, with the acceleration driven primarily by a rebound in energy prices, which rose 7.3% y/y after a prior decline. On a m/m basis, prices increased by 0.9% following a 0.6% rise, also led by higher energy costs, particularly petroleum products. Food prices rose modestly m/m while easing slightly y/y, and manufactured goods prices deceased further. Services inflation edged higher to 1.7% y/y, and tobacco prices also increased. The harmonized CPI rose 1.9% y/y and 1.1% m/m, indicating broader price pressures across the economy despite mixed trends across components. CAC 40 +0.38% to 7802, EURUSD +0.018% to 1.1467, 10y OAT -0.8bp to 3.761%.
France’s industrial producer prices fell 1.2% m/m and declined 3.1% y/y in February, reversing a 1.1% increase in January. The drop was driven mainly by a sharp fall in export prices (-3.8%). Domestic prices declined more modestly (-0.2%), reflecting lower energy prices (-1.7%), particularly electricity, while manufactured goods prices rose 0.4%. On a y/y basis, energy prices remained a key drag, down 8.5%. Excluding energy, producer prices were broadly stable at +0.1% both m/m and y/y. Import prices were flat m/m but fell 3.8% y/y, with strong increases in refined petroleum prices (+10.7% m/m) offsetting broader declines.
France’s services output declined by 0.6% m/m in January following a 1.9% increase in December, with weakness broad-based across sectors, led by transport and storage (-4.1% after +5.0%). Further declines were seen in administrative services (-1.3%), professional and technical services (-0.4%), arts and recreation (-1.3%) and accommodation and food services (-0.6%). In contrast, information and communication rose 1.9% and real estate rebounded by 1.5%. Over the three months to January, services output increased by 0.5% y/y, with gains in professional services (+0.9%), information and communication (+0.6%) and accommodation (+1.4%), partly offset by declines in administrative services (-0.4%) and recreational activities (-1.0%).
France’s January retail sales volumes were flat m/m after a 0.8% increase in December, reflecting mixed developments across sectors. Sales declined in the automotive sector (-1.2%), driven by a 1.9% fall in vehicle sales, while wholesale trade was broadly stable (-0.1%). In contrast, retail trade rallied 0.7%, supported by gains in specialized stores (+0.8%) and non-store retail (+0.9%), with moderate growth in non-specialized stores (+0.3%). Over the three months to January, total sales increased by 2.2% y/y, with stronger growth in retail (+3.2%) and wholesale (+2.0%), and a smaller rise in automotive sales (+0.6%), indicating continued resilience in underlying demand.
France’s household goods consumption fell 1.4% m/m in February, reversing a 0.4% increase in January, with declines across all major components. Energy consumption dropped 2.4%, driven by lower electricity and gas usage amid mild weather, while manufactured goods fell 1.7%, including durable goods (-1.8%), clothing (-4.0%) and transport equipment (-1.4%). Food consumption also declined by 0.5%. Over the three months to February, total goods consumption decreased by 0.6%, with energy down 1.9% and manufactured goods down 0.4%. The broad-based contraction reflects weaker household demand, particularly in discretionary and weather-sensitive categories.
Italy’s March CPI increased by 1.7% y/y and 0.5% m/m, up from 1.5% previously. The pickup was driven mainly by energy prices, where declines narrowed to -2.3% from -6.6%, alongside a rise in unprocessed food inflation to 4.4% from 3.7%. Core inflation slowed to 1.9% from 2.4%, while inflation excluding energy eased to 2.1%. Goods prices accelerated to 0.7% y/y from -0.1%, while services inflation moderated to 2.8% from 3.6%. The “shopping basket” rose 2.2% y/y. On a m/m basis, increases were led by regulated energy (+8.9%) and non-regulated energy (+4.6%), and partly offset by declines in recreational services. FTSE MIB +0.45% to 44021, EURUSD +0.018% to 1.1467, 10y BTP -1bp to 3.975%.
Spain’s January external balance showed a financing capacity of 3.9% of GDP, equivalent to €66.2bn, down from 4.2% a year earlier but still close to recent historical highs. The current account surplus stood at 2.9% of GDP (€49.1bn), slightly below 3.1% previously, while the capital account contributed 1.0% of GDP (€17.1bn). The tourism surplus remained a key driver at 4.2% of GDP, with tourism revenues at 6.2% of GDP. Non-tourism goods and services posted a -0.2% balance, while the income deficit remained at -1.0%. The financial account surplus narrowed to 2.6% of GDP, reflecting lower other investment inflows. IBEX 35 +0.76% to 16984, EURUSD +0.018% to 1.1467, 10y Bono -1bp to 3.554%.
U.K. shop price inflation rose 1.2% y/y in March, up from 1.1% in February but below the three-month average of 1.3%, reported the British Retail Consortium. Food inflation slowed to 3.4% y/y from 3.5%, reflecting lower dairy prices, while non-food prices increased by 0.1% y/y after a 0.1% decline previously. The survey, conducted between March 1 and 7, indicated emerging cost pressures linked to supply chain disruptions from the Middle East conflict. The BRC also highlighted additional upward pressure from new labor market and healthy food regulations. The Bank of England is monitoring food prices closely, as inflation expectations rose to their highest level since 2023 in March. FTSE 100 +0.64% to 10193, GBPUSD +0.167% to 1.3208, 10y gilt -1.9bp to 4.916%.
U.K. Q4 GDP grew by 0.1% q/q, unchanged from the previous estimate and matching Q3 growth. Output was driven by a 1.2% q/q rise in production, while construction declined by 2.0% q/q and services were flat. Annual GDP growth for 2025 was revised up to 1.4% from 1.3%, following 1.1% growth in 2024. Real GDP per head fell 0.1% q/q but rose 0.6% y/y, with annual growth of 1.1% in 2025 after a flat performance in 2024. Real household disposable income per head increased by 1.2% q/q, rallying from a revised 1.2% decline in Q3, while the household saving ratio rose 0.8 percentage points to 9.9%, driven by higher non-pension savings.
U.K. quarterly sector accounts showed Q4 household disposable income per head rising 1.2% q/q, rebounding from a 1.2% decline in Q3. The household saving ratio rose 0.8 percentage points to 9.9%, driven by stronger non-pension saving. The U.K.’s net borrowing position with the rest of the world widened to 2.5% of GDP from 1.6%. Non-financial corporations’ net lending fell to 0.1% of GDP from 1.0%, with private firms’ net lending declining to £0.4bn from £7.3bn. Financial corporations’ net lending eased to 0.1% of GDP from 0.4%. Government net borrowing was unchanged at 5.0% of GDP, while households’ net lending increased to 2.5% from 2.1%.
The Nationwide survey showed U.K. house prices rising 2.2% y/y in March, up from 1.0% in February, with prices rising 0.9% m/m and the average price reaching £277,186. The monthly index rose to 552.6 from 547.7. By region, Northern Ireland recorded the strongest performance in Q1, with prices up 9.5% y/y, while the Outer South East was the weakest, with prices down 0.7% y/y. The data indicate a rebound in housing market momentum following a slowdown earlier in the year, although the outlook remains uncertain amid higher global energy prices and potential implications for growth, inflation and interest rates. Conditions may shift materially given the rise in mortgage rates in response to a shift in monetary policy pricing.
Poland’s flash CPI for March increased by 3.0% y/y and 1.0% m/m, marking an acceleration from recent months. Food and non-alcoholic beverage prices rose 2.0% y/y, while electricity, gas and other fuels increased by 3.9% y/y. Transport-related fuel prices showed the strongest y/y rise, at 8.5%, and a sharp 15.4% m/m increase. On a m/m basis, food prices were flat, energy prices edged down 0.1% and overall inflation was driven primarily by fuel costs – even after taking support measures into account. The CPI index reached 103.0 relative to March 2025, with the data based on preliminary estimates and subject to revision. WIG +1.19% to 121677, EURPLN -0.089% to 4.2879, 10y PGB -4.2bp to 5.891%.
Hungary’s average gross earnings increased by 26.3% y/y to HUF 840,600 in January, while net earnings rose 28.0% y/y to HUF 585,700 and real earnings grew 25.4% y/y. This was largely driven by one-off “service premium” payments to military and law enforcement, which contributed 18.0 percentage points to gross wage growth. Excluding this effect, gross earnings rose 8.3% y/y and real wage growth was estimated at 8.1%. Regular gross earnings were up 9.4% y/y to HUF 694,700, with gains across sectors. Median gross earnings rose 11.0% y/y to HUF 598,700, while median net earnings increased by 12.5% y/y to HUF 420,200, supported by expanded tax allowances and income tax exemptions. Budapest SI +0.89% to 121842, EURHUF -0.596% to 385.86, 10y HGB -5bp to 7.28%.
Hungarian industrial producer prices fell 3.3% y/y and 0.8% m/m in February, with domestic prices down 3.1% y/y and non-domestic prices down 3.3% y/y. The y/y decline was driven by lower prices in manufacturing (-2.7%) and energy (-4.3%) for domestic output, while non-domestic prices fell 3.3% in manufacturing and 7.4% in energy. By end-use, prices decreased by 4.5% in energy and intermediate goods, and by 0.3% in capital goods, while rising 0.8% in consumer goods. On a m/m basis, domestic prices declined by 0.3% and non-domestic prices by 1.0%. Over January-February, industrial producer prices were down 3.1% y/y overall.
Czech household real income per capita increased by 2.9% y/y and 1.4% q/q in Q4, while real consumption rose 3.1% y/y and 1.4% q/q, with the household saving rate at 19.7%, up 0.7 percentage points q/q. For 2025, household real income rose by 1.1% and consumption by 3.0%, while the saving rate dropped 1.2 percentage points to 19.1%. Non-financial corporations’ profit rate fell to 42.7% in Q4, down 0.3 percentage points q/q and 1.1 percentage points y/y, while the investment rate reached 26.9%. For the full year, the profit rate declined to 43.0% and the investment rate to 26.6%. GDP increased by 0.7% q/q and 2.7% y/y in Q4, with full-year growth at 2.6%. Prague SE +1.05% to 2496, EURCZK -0.106% to 24.522, 10y CZGB -2.6bp to 4.942%.
The Czech employment rate fell 0.5 percentage points y/y to 75.3% in February, with male employment at 79.8% and female employment at 70.6%. The unemployment rate increased by 0.6 percentage points y/y to 3.3%, with male unemployment at 2.9% and female unemployment at 3.8%, indicating a continued gradual upward trend. The economic activity rate rose marginally to 77.8%, with male participation at 82.3% and female participation at 73.4%. On a broader internationally comparable basis (ages 15-74), the unemployment rate stood at 3.2% in February, reflecting relatively tight labor market conditions despite signs of softening in employment dynamics.
Türkiye’s February trade balance showed exports increasing by 1.5% y/y to $21.0bn while imports rose 5.5% y/y to $30.1bn, widening the trade deficit by 15.9% y/y to $9.0bn. The export-to-import coverage ratio declined to 70.0% from 72.7% a year earlier. Excluding energy and gold, exports rose by 4.4% y/y and imports by 12.8% y/y, with the adjusted deficit at $3.0bn. In January-February, exports fell 1.3% y/y while imports rose 2.8%, pushing the cumulative deficit up 13.8%. Manufacturing accounted for 93.8% of exports, while intermediate goods made up 72.2% of imports, reflecting continued import dependence. BI 100 +0.49% to 12688, USDTRY +0.083% to 44.4797, 10y TGB -62bp to 33.55%.
Turkish services producer prices increased by 33.58% y/y and 2.10% m/m in February, with the y/y rise driven by broad-based gains across sectors, including real estate (+38.64%), professional, scientific and technical services (+38.58%) and accommodation and food services (+33.51%). Transport and storage prices rose 32.04% y/y, while administrative services increased by 31.48%. On a m/m basis, the strongest increases were seen in professional services (+5.01%) and information and communication (+4.20%), while real estate prices declined by 1.34% m/m. The index is also up 10.01% since December and 35.77% on a 12-month average basis, indicating continued strong cost pressures in the services sector.
Türkiye’s unemployment rate rose 0.3 percentage points m/m to 8.5% in February. The number of unemployed people increased by 133,000 to 2.98 million, while employment rose by 153,000 to 32.16 million and the employment rate increased by 0.2 percentage points to 48.2%. Labor force participation also rose 0.3 percentage points to 52.6%, lifting the labor force by 286,000 to 35.14 million. Youth unemployment climbed 1.4 percentage points to 15.8%, with rates of 12.8% for men and 21.8% for women. The broad underutilized labor rate edged up 0.1 percentage points to 29.9%, while average weekly actual hours worked were unchanged at 42.5. Male unemployment stood at 6.9% and female unemployment at 11.6%, pointing to a wider gap.
South African total employment increased by 0.2% q/q (+18,000) to 10.55 million in Q4, driven by gains in trade (+37,000) and business services (+17,000), while declines were recorded in construction (-13,000), manufacturing (-11,000) and transport (-4,000). On a y/y basis, employment fell 1.0% (-102,000). Full-time employment rose 0.1% q/q but declined 0.7% y/y, while part-time employment increased by 0.4% q/q but dropped 2.9% y/y. Gross earnings rose 7.4% q/q to ZAR 1.08tn and were up 4.8% y/y, with bonuses surging 92.5% q/q. Average monthly earnings increased by 0.1% m/m and 4.9% y/y, indicating modest wage growth despite weaker employment trends. JSE TOP 40 +0.9% to 105600, USDZAR -0.505% to 17.0986, 10y SAGB -9.8bp to 9.31%.
Australia’s financial aggregates for February showed total credit growth of 0.6% m/m and 7.8% y/y, up from 0.5% m/m and 7.7% y/y in January. Housing credit rose 0.6% m/m and 7.1% y/y (previously 0.6% m/m and 5.7% y/y). Personal credit increased by 0.4% m/m and 4.3% y/y (0.2% m/m and 2.0% y/y prior). Business lending to non-financial firms grew 0.8% m/m and 9.5% y/y. Broad money expanded by 0.8% m/m and 7.7% y/y. Initial signs of a sequential slowdown will support any RBA stance against a very strong tightening bias, but near-term inflation risk is more likely to arise from the price rather than demand channel. ASX +1.42% to 5401, AUDUSD -0.088% to 0.685, 10y ACGB -9.6bp to 4.974%.
The RBA’s Monetary Policy Board meeting on March 16-17, 2026, assessed that inflation remains too high amid increased excess demand and a tighter labor market since late 2025. The recent rise in oil prices is expected to significantly boost inflation in March, though long-term inflation expectations remain stable. While financial conditions have tightened slightly, they are not yet sufficiently restrictive. A majority voted to raise the cash rate by 25bp to 4.10% to curb inflation risks, despite uncertainties from the Middle East conflict and their impact on supply and demand. A minority preferred to keep rates on hold, citing weaker consumption and uncertain conflict effects. The RBA mentioned that a rise in inflation expectations would need more tightening, but at the same time it is not possible to predict the cash rate path with confidence. A longer conflict could have a material bearing on both inflation and economic activity.
New Zealand business confidence fell sharply in March, down 26 points from 59.2 to 32.5. as firms reacted to the Middle East shock. Late-month responses averaged -23. Forward-looking activity indicators also declined significantly. Past activity weakened, with only 18% of firms reporting stronger activity than a year ago, down from 23%, notably in retail (down 20 points to +5) and construction (down 16 points to -13). Inflation expectations rose, with 60% of firms expecting to raise prices in the next three months (up 7 points), to 3.08% from 2.93%. The expected price increase in the coming three months rose from 1.97% to 2.37%. Cost increase expectations reached 85%, the highest figure since early 2023. NZX 50 +1.28% to 12912, NZDUSD -0.175% to 0.5711, 10y NZGB -6.2bp to 4.723%.
The Tokyo Consumer Price Index (CPI) eased to 1.4% y/y in March from 1.5% in February. Headline CPI for the month came in at 0.1% (seasonally adjusted) m/m after three m/m falls. Excluding fresh food, seasonally adjusted CPI rose 0.3% m/m, 1.7% y/y (vs. -0.1% m/m, 1.8% y/y in February); excluding fresh food and energy, it rose 0.2% m/m, 2.3% y/y (vs. 0.3% m/m, 2.5% y/y in February). Key inflation contributors included food (3.2% y/y), housing rent (1.3% y/y) and communication costs (2.7% y/y), while fresh vegetables (-4.7% y/y), utilities (-6.6% y/y) and miscellaneous expenses (-3.6% y/y) declined. Nikkei -1.04% to 51344, USDJPY -0.019% to 159.64, 10y JGB -1.6bp to 2.358%.
Japan’s labor force survey for February 2026 showed employment at 67.79 million, up 110,000 y/y, in the first increase in two months (67.68 million in January 2026). The number of employed people rose mainly in the wholesale/retail and transportation/postal sectors. The unemployment rate (seasonally adjusted) fell to 2.6% from 2.7% in January. However, the total unemployment count increased by 150,000 y/y to 1.8 million, continuing a seven-month rise. The employment rate improved to 61.9%, up 0.2 points y/y. The non-labor-force population shrank by 460,000 y/y, continuing a 48-month decrease. The job-to-applicant ratio rose to 1.19 from 1.18.
Japanese industrial production slowed in February, coming in at -2.1% m/m, 0.3% y/y from 4.3% m/m, 0.7% y/y in January. Shipments fell 1.6% m/m, -0.2% y/y while inventories rose 0.3% m/m, -3.4% y/y, and the inventory ratio increased by 2.3% m/m, -1.0% y/y. Key contributors to the decline in production were motor vehicles, fabricated metals and electronic parts; gains came from iron/steel, chemicals and paper products. Shipments dropped mainly in electronic parts and chemicals but rose in motor vehicles and transport equipment. Production is forecast to rally by 3.8% in March and 3.3% m/m in April.
Japan’s total commercial sales for February reached ¥50.308tn, up 0.9% y/y but down 1.0% m/m (seasonally adjusted). Wholesale sales rose 1.3% y/y to ¥38.152tn, driven by pharmaceuticals (+6.3%), agricultural products (+5.0%) and food and beverages (+3.5%), while declines were recorded in furniture (-4.9%) and chemicals (-4.7%). Retail sales edged down 0.2% y/y to ¥12.155tn, with fuel retail down 14.1% and non-store retail down 4.2%, but there were increases in automotive (+3.8%) and pharmaceuticals (+3.7%).
Japanese department store and supermarket sales totaled ¥1.773tn in February, up 2.5% y/y (1.8% y/y for existing stores). Department stores recorded ¥472.3bn (+1.6% y/y, 2.0% y/y existing stores) and supermarkets ¥1.300tn (+2.9% y/y, 1.8% existing stores). By category, clothing fell 0.5% y/y (-0.2% existing), food rose 2.5% y/y (1.4% existing) and others increased by 5.0% y/y (4.9% existing). Department store clothing grew 1.2% y/y, driven by increases in men’s and other apparel, while supermarket clothing declined by 8.0% y/y. Food sales rose in both sectors, with supermarkets’ other goods up 6.5% y/y. Seasonally adjusted sales fell 0.1% m/m.
Japan’s construction orders increased by 42.7% y/y in February, marking a fourth consecutive monthly rise, with total orders reaching ¥1.83tn. Domestic orders rose 42.5% y/y to ¥1.79tn, supported by gains in both the private and public sectors. Private sector orders increased by 45.7% y/y to ¥1.23tn, driven by stronger demand from the real estate, manufacturing and transport industries, with manufacturing up 28.4% and non-manufacturing up 56.0%. Public sector orders rose 42.3% y/y to ¥524.5bn, rebounding from the previous month, with central government orders up 50.0% and local government orders up 22.8%. Overseas orders also increased by 51.0% y/y to ¥31.4bn, returning to growth.
China posted resilient PMI manufacturing and non-manufacturing numbers, which were back into expansion territory. The composite PMI came in at 50.5 from 49.5. China’s March 2026 manufacturing PMI rose to 50.4% (from 49.0% in February), indicating improved manufacturing activity. Production (51.4 vs. February: 49.6) and new orders indices (51.6 vs. February: 48.6) back in expansion, signaling faster production and stronger demand. There was a noteworthy surge in the main raw material purchase price index, and the factory price index rose sharply to 63.9 (+9.1) and 55.4 (+4.8) respectively. This reflects a significant rebound in manufacturing market prices, driven by rising commodity prices and accelerated corporate procurement. Non-manufacturing PMI increased to 50.1 (from 49.5), with services at 50.2 (February: 49.7) and construction at 49.3 (February: 48.2). Input prices rose, sales prices declined but less sharply, and employment weakened. CSI 300 -0.93% to 4450, USDCNY +0.082% to 6.9069, 10y CGB +0.1bp to 1.809%.
Fitch Ratings has reported that the value of China’s new-home sales fell 22% y/y in January-February 2026, with gross floor area down 16% and the average selling price down 7%, marking a weaker start than the full-year forecast of a 7-8% decline. Sales in these two months represent about 11% of the annual expectation. Policy easing, including Shanghai’s relaxation of purchase restrictions and housing provident fund reforms, alongside increased new project launches, may help slow the sales decline in Q2, which typically accounts for 28% of annual sales. However, risks remain from weak employment, high inventories and geopolitical uncertainty.
South Korean industrial statistics for February 2026 show a 2.5% m/m, 0.5% y/y index rise vs -0.9% m/m, 4.7% y/y in January 2026 – the fastest m/m increase since June 2020. Industrial production rallied m/m (+5.4%) but dropped 2.2% in y/y terms. Manufacturing production rose 6.1% m/m but fell 1.8% y/y, with shipments up 3.9% m/m and down 4.0% y/y. Capacity utilization increased by 5.2% m/m but declined by 3.8% y/y, reaching 74.4%. Services grew 0.5% m/m and 2.1% y/y. Retail sales were flat m/m, up 4.7% y/y. Equipment investment surged 13.5% m/m and 5.3% y/y. Construction completed rose 19.5% m/m and 1.2% y/y. Composite coincident and leading indices increased by 0.9% and 0.8% m/m, respectively, indicating positive economic momentum. KOSPI -4.26% to 5052, USDKRW -0.742% to 1531.05, 10y KTB -3bp to 3.895%.
BoK governor-in-waiting Shin Hyun-song struck a more dovish (policy easing may be necessary) and market-stability-focused tone than expected. He downplayed FX risks, citing ample USD liquidity, and signaled tolerance for KRW weakness, noting that exchange rate levels are not a concern if markets can absorb the adjustment. While supportive of policy easing – including a ₩25tn supplementary budget – he remains cautious on rate moves amid geopolitical uncertainty, advocating flexibility rather than a hawkish bias. He declared that “policy easing may be necessary as the Middle East situation adds to economic difficulties,” noting that the inflationary impact of the envisioned extra budget would likely be limited at its current scale and design.
Malaysia’s annual report predicts 2026 GDP of 4-5%, with inflation set to remain moderate at 1.5-2.5%. Global trade and capital flow uncertainties, compounded by events in the Middle East, pose risks to growth and inflation, influenced by the duration and severity of the conflict. Advances in AI offer productivity gains but may trigger market volatility. Malaysia’s diversified export base and domestic resilience support projected GDP growth of 4-5% (up from a previous forecast of 4.0-4.5%), driven by household spending, investments, electrical and electronics exports and tourism. Inflation is expected to remain moderate at 1.5-2.5%, with targeted policies mitigating commodity price impacts. Structural geoeconomic shifts call for deeper domestic and regional reforms to ensure inclusive growth, fiscal sustainability and economic resilience. Bank Negara Malaysia remains vigilant as it looks to manage risks and maintain stability. KLCI +0.07% to 1689, USDMYR -0.248% to 4.041, 10y MGB +2bp to 3.649%.
Thailand’s February economy slowed m/m, with private consumption declining by 1.8% and exports (excluding gold) falling 2.3%, alongside a 7.2% drop in imports and a 1.8% decline in foreign tourist arrivals. Industrial and service sector activity also weakened. In contrast, private investment increased by 1.9% and government spending rose 11.4%, providing partial support. Headline inflation remained negative at -0.88%, driven by lower fresh food prices, while core inflation was positive at 0.56%. The current account recorded a surplus of $2.1bn, supported mainly by the trade balance. Overall, the data reflect softer demand and supply conditions, with limited offset from public spending and investment. SET -0.57% to 1441, USDTHB -0.304% to 32.95, 10y TGN +6.1bp to 2.28%.