Market Movers: Pivots
Market Movers highlights key activities and developments before the U.S. market opens each morning.
Market Movers highlights key activities and developments before the U.S. market opens each morning.

Bob Savage
Time to Read: 6 minutes
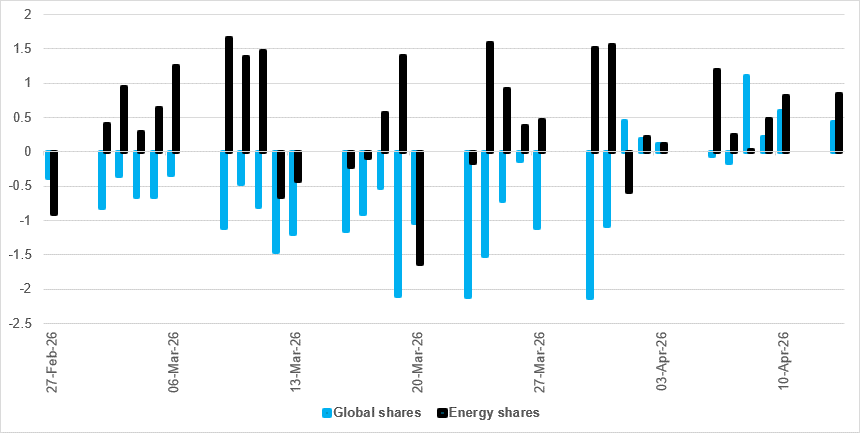
iFlow global shares vs. energy sector
Source: BNY
We are now into a ninth day of market optimism over an end to the conflict in the Middle East. Flows in equities highlight the shift in April, with global shares reflecting hopes of an exit ramp.
An interesting counterpoint is in energy shares, which were seen by many investors as a safe haven. The current drop in oil prices has stalled, and both WTI and Brent futures remain volatile and up about 60% on the year. Energy shares remain in favor, having seen only one notable day of selling and only seven of outflows since the conflict began. Whether the current ceasefire can be extended and whether oil flows through the Strait of Hormuz return to at least 50% of their former level will be key to how investors see growth and inflation in the months ahead. For now, energy is still the favorite sector.
The markets continue to reflect hopes that the war is closer to its end than its middle, as U.S./Iran talks continue off-channel and may produce another face-to-face meeting. The flow of traffic through the Strait of Hormuz is higher (20 vessels reported yesterday), with the U.S. blockade meaning that no Iranian ships were involved. The price of oil fell nearly 5% yesterday but is now up 1%, while USD is holding steady after seven days of losses. Stocks are higher, with S&P 500 futures flat but holding just 0.2% from record highs. The rest of the world is bid, led by technology. The bond markets are mixed, with APAC seeing lower yields but Europe and the U.S. higher. The focus on earnings and the IMF is dominating headlines on top of the geopolitical stories about the war.
Bottom line: The push for returning to “normal” markets continues, but today is “Tax Day” in the U.S., and the intricacies of cash flows matter here. Demand for safety may be lower but it has not gone away, and the medium-term effects of the conflict with Iran are not fully known. Inflation and growth data will both be important. U.S. newsflow will concentrate on central bank commentary, led by the Fed with the Beige Book release – an important tool for understanding the war shock on the U.S. economy. The extent to which investors pivot from looking through to trading through the conflict will be determined by the ongoing earnings announcements, oil prices and further headlines confirming hopes of a ceasefire turning to a truce.
U.S. Treasury Secretary Scott Bessent has stated that President Trump’s tariffs, previously struck down by the Supreme Court, could be reinstated by July using Section 301 authority. Despite legal setbacks, businesses can now plan capital expenditure with more certainty. Bessent noted that the U.S. economy remains strong, with growth potentially exceeding 3-3.5% this year. He highlighted a continued decline in core inflation, excluding food and energy, suggesting interest rates should come down further. However, the March CPI report showed a sharp rise in headline inflation, driven by higher gas prices. S&P Mini 0% to 7005, DXY +0.052% to 98.175, 10y UST -0.2bp to 4.246%.
The People’s Bank of China and the State Administration of Foreign Exchange have issued a notice adjusting overseas lending policies for banking institutions. The overseas loan leverage ratio for domestic foreign-owned banks, joint ventures and foreign bank branches in mainland China, including those from Hong Kong, Macau and Taiwan, was raised from 0.5 to 1.5. The Export-Import Bank’s ratio increased from 3 to 3.5. Note that in 2025, China raised its macroprudential adjustment parameter, a multiplier that decides the upper limit of outstanding cross-border financing available to an institution, from 1.5 to 1.75 to facilitate cross-border financing. CSI 300 -0.42% to 4681, USDCNY -0.025% to 6.8175, 10y CGB -0.9bp to 1.779%.
Chinese President Xi Jinping met Russian Foreign Minister Sergei Lavrov in Beijing, emphasizing the stability and strategic coordination of Chinese-Russian ties amid the ongoing Iran conflict. Both countries support negotiating a settlement to the war and oppose a recent UN resolution on the Strait of Hormuz, citing its imbalance. Russia pledged to compensate for any energy shortages affecting China. Xi highlighted economic complementarity and cooperation resilience. Russian President Vladimir Putin is expected to visit China in May and November. The conflict has disrupted energy flows, with China’s oil and gas imports shrinking in March, impacting supply chains and factory profits.
South Korea has secured 273 million barrels of crude oil and 2.1 million tons of naphtha from Oman, Saudi Arabia, Qatar and Kazakhstan by the end of 2026. This is sufficient to cover more than three months of crude oil demand and one month of naphtha demand based on last year’s consumption. The supplies will be transported via alternative routes bypassing the Strait of Hormuz, which has been closed since the U.S.-Iran conflict began in February. Discussions also included establishing crude oil storage outside the chokepoint to stabilize energy supplies. President Lee Jae-myung conveyed solidarity and urged collective efforts to address the global energy security crisis. KOSPI +2.07% to 6091, USDKRW -0.156% to 1474.8, 10y KTB -6bp to 3.652%.
Anthropic PBC is in early talks with investors for a new funding round that could value the AI startup at around $800bn or higher, more than double its $350bn valuation in February. The company, known for its AI tools such as Claude and the recently unveiled Mythos model, has seen rapid revenue growth, reaching a $30bn annual run rate, from $19bn just months earlier. Anthropic is also considering a public listing as soon as October. Despite investor interest, no deal is confirmed and terms may change. The company has faced scrutiny over AI safety concerns with the U.S. Defense Department.
U.S. April Empire manufacturing is forecast to improve to 0 vs. -0.2.
U.S. March import price index is expected at 2.3% m/m, 4.4% y/y vs. 1.3% m/m, 1.3% y/y in February. The import price index ex-petroleum is expected at 0.3%, from 1.2% m/m. The U.S. March export price index is expected at 1.5% m/m vs. 1.5% m/m in February.
U.S. April NAHB Housing Market Index is expected to ease to 37 points vs. 38.
Fed releases Beige Book.
Central bank speakers:
The ECB’s José Luis Escrivá, SNB Chairman Martin Schlegel and BoK Governor Rhee Chang-yong speak in Washington, DC, on “Central banking for open economies in a changed world.”
The ECB’s Piero Cipollone speaks at the Atlantic Council in Washington, DC.
The ECB’s François Villeroy de Galhau speaks in Washington, DC.
ECB President Christine Lagarde speaks in Washington, DC.
The ECB’s Isabel Schnabel, the SARB’s Lesetja Kganyago, and RBA and Turkish deputies speak in Washington, DC, on “IIF: Deglobalization and fragmentation: Mid-term challenges for central banks.”
Fed Governor Michael Barr participates in a conversation on consumer compliance supervision and regulation.
Fed Vice Chair for Supervision Michelle Bowman participates in a conversation on banking regulation at the Institute of International Finance Global Outlook Forum.
U.S. Treasury sells $69bn in 17-week bills.
Mood: Risk-on sentiment has strengthened, with iFlow Mood rising to 0.194, driven by stronger equity demand alongside continued selling of core sovereign bonds.
FX: Broad inflows across APAC and EMEA, versus mixed and modest flows in G10 and LatAm. There was notable buying in INR, MYR, CLP and CHF, while outflows were seen in PHP, IDR, COP, USD and SEK. EUR scored holdings moved deeper into underheld territory.
FI: Mixed flows. Government bonds in Australia, India and the Philippines saw the largest outflows, while light buying was observed elsewhere, particularly in the Eurozone, Peru, Hungary, Poland and China.
Equities: Strong inflows into LatAm, as well as Hungary, Türkiye, Taiwan, Sweden and Australia. More moderate buying extended to China, Japan and the U.S.
“A pivot is a change in strategy without a change in vision.” – Eri Ries
“When we are no longer able to change a situation, we are challenged to change ourselves.” – Viktor Frankl
France’s final Consumer Price Index (CPI) for March rose by 1.0% m/m and 1.7% y/y (from 0.6% and 0.9% in February). The increase was driven by a sharp rise in energy prices (+8.9% m/m; +7.4% y/y), especially for petroleum products. Food inflation slowed (+0.1% m/m; +1.8% y/y), while manufactured products inflation declined (-0.5% y/y). Services prices accelerated slightly (+0.2% m/m; +1.7% y/y), with transport prices rebounding (+2.4% y/y). Core inflation increased to 1.1% y/y from 0.9%. The Harmonized Index of Consumer Prices rose 1.1% m/m and 2.0% y/y. CAC 40 +1.12% to 8328, EURUSD -0.094% to 1.1786, 10y OAT -3.2bp to 3.626%.
Seasonally adjusted industrial production rose by 0.4% m/m in both the euro area and the EU during February, following declines of 0.8% and 0.9%, respectively, in January. M/m gains were seen in intermediate goods (0.5%), capital goods (1%) and non-durable consumer goods (2.6%), while energy (-2.1%) and durable consumer goods (-1.3%) recorded falls. On a y/y basis, energy (2%) and capital goods (2.5%) rose, but intermediate (-1.5%), durable (-1.9%) and non-durable (-5.4%) consumer goods saw falls. Euro Stoxx 50 +1.35% to 5985, EURUSD -0.094% to 1.1786, BBG AGG Euro Government High Grade EUR -7bp to 3.265%.
Japan’s private sector core machinery orders, excluding shipbuilding and utilities, rose 13.6% m/m, 24.7% to ¥1.116tn in February 2026 vs. -5.5% m/m, 13.7% y/y in January. Manufacturing orders surged 30.7% m/m and 33.4% y/y to ¥570bn, while non-manufacturing rose 0.9% m/m and 17.6% y/y to ¥568bn. Government/public orders declined by 19.0% m/m and 20.4% y/y to ¥466bn. Foreign orders fell 5.1% m/m but increased by 32.0% y/y to ¥1.865tn. Nikkei +0.44% to 58134, USDJPY -0.089% to 158.97, 10y JGB 0bp to 2.418%.
South Korea’s export price index (KRW basis) for March rose sharply (+16.3% m/m and 28.7% y/y; February: +2.5% m/m, +13.6% y/y). The import price index increased by 16.1% m/m and 18.4% y/y (February: +1.5% m/m, +13.6% y/y). The export volume index grew 23.0% y/y, while the import volume index rose 12.3% y/y. The export value index surged by 51.7% y/y, with the import value index up 12.9% y/y. Key export sectors included manufacturing and agricultural products, with notable price gains in coal and petroleum, and electronic equipment. The import price index for coal products and petroleum products rose 37.4% m/m, 31.3% y/y, while chemical products were up 10.7% m/m, 8.5% y/y. KOSPI +2.07% to 6091, USDKRW -0.156% to 1474.8, 10y KTB -6bp to 3.652%.
South Korea’s economically active population reached 29.679 million people in March, up 0.6% y/y. The labor force participation rate remained steady at 64.6% y/y. The employment count increased by 0.7% y/y to 28.795 million, with the employment-to-population ratio rising 0.2 percentage points to 62.7%. The number of unemployed people was down 3.8% y/y to 884k, lowering the unemployment rate by 0.1 percentage points to 3.0%, or 2.7% on seasonally adjusted basis. The economically inactive population grew 0.4% y/y to 16.271 million.
South Korean narrow money (M1, seasonally adjusted) rose by 0.1% m/m in February, with broad money (M2) stable at 0.0% m/m (₩4.114qn, following a 0.8% m/m increase in January). Liquidity of financial institutions increased by 0.8% m/m to ₩6.152qn, while overall liquidity (period-end) grew by 0.9% m/m to ₩7.841qn, indicating moderate liquidity expansion in the financial system.
India’s Wholesale Price Index (WPI) for March 2026 rose 1.64% m/m, 3.88% y/y vs. 0.38% m/m, 2.13% y/y in February 2026). Primary articles inflation surged to 6.36% y/y, driven by higher prices for crude petroleum and natural gas and for minerals, despite declines in food and non-food articles. Fuel and power inflation turned positive at 1.05% y/y, with a 4.13% m/m rise mainly due to mineral oils. Manufactured products inflation rose to 3.39% y/y, supported by food products, chemicals and basic metals. Food inflation remained steady at 1.85% y/y, with a slight m/m decrease. SENSEX +1.54% to 78034, USDINR -0.006% to 93.3875, 10y INGB -4.6bp to 6.894%.
Indonesian external debt reached to a new high of $437.9bn in February, from $434.9bn in January, growing 2.5% y/y (vs. 1.7% y/y in January). Public sector debt, especially government debt at $215.9bn (5.5% y/y vs. 5.6% y/y), drove the increase, focused on health, social activities, public administration, education, construction and transportation. Bank Indonesia’s external debt rose due to higher non-resident holdings of monetary instruments. Private external debt dropped 0.7% y/y to $193.7bn, mainly from financial and non-financial corporations. External debt remains stable, with a 29.8% debt-to-GDP ratio and 84.9% long-term debt, supported by prudent management. JCI +0.27% to 7696, USDIDR -0.129% to 17144, 10y IDGB -0.5bp to 6.601%.