Market Movers: No fast track
Market Movers highlights key activities and developments before the U.S. market opens each morning.
Market Movers highlights key activities and developments before the U.S. market opens each morning.

Bob Savage
Time to Read: 7 minutes
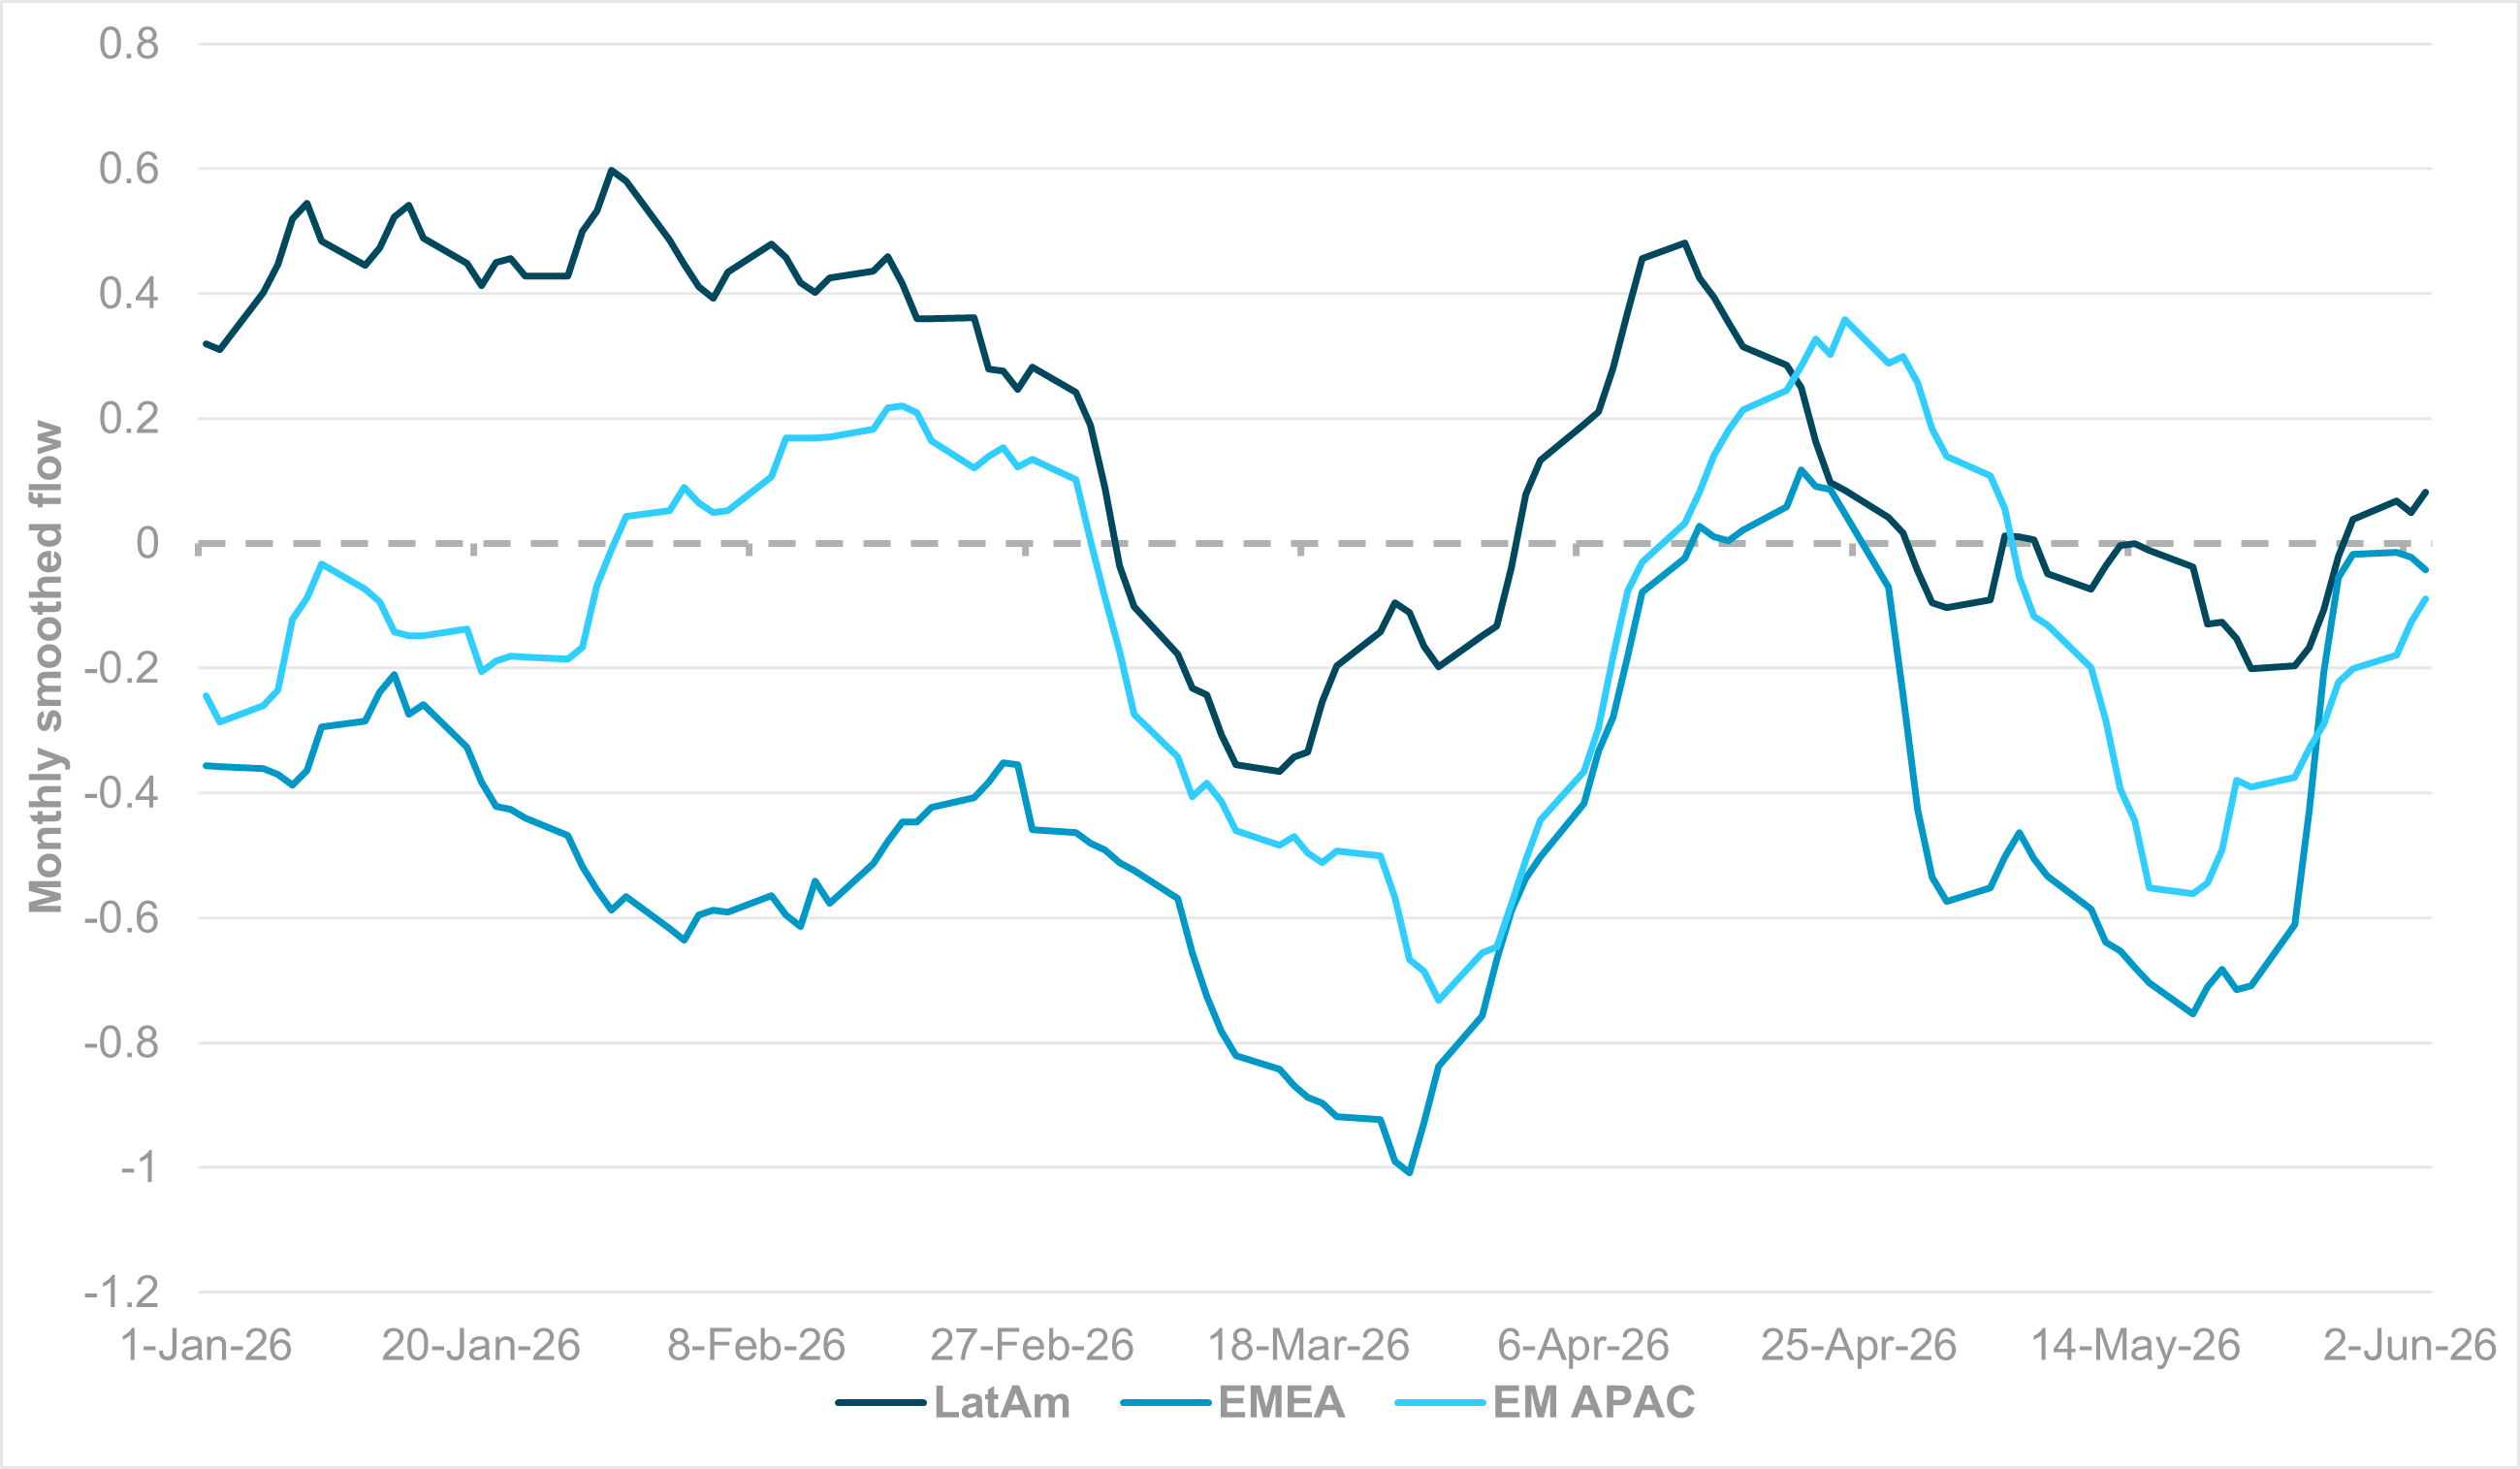
Fiscal scrutiny increasing for EM debt
Source: BNY
This week has been another difficult one for EM markets as the dollar remains robust and global asset allocation seems to be under pressure to divert resources to AI/tech themes as much as possible. We highlighted earlier this week that short utilization is not responding uniformly, but fiscal will play a role in both directions. On this note, the market is clearly taking a more conservative view on the situation in EM APAC and EM EMEA, especially in economies where deficits are structurally high, and there may be a tendency to add to spending at present to help with cost-of-living stress. Compared to previous episodes of global balance-of-payments stress, EM economies are much more self-funded and rely less on foreign inflows to manage financial conditions. Nonetheless, the current supply shock means that having FX import coverage matters, and economies could ill-afford other areas of risk premia injection, such as fiscal dominance. Headlines in Indonesia and Hungary suggest that governments are already attuned to such risks, but being able to adjust credibly matters. In contrast, flows into LatAm debt remain very strong, but rather than fiscal strength, we suspect it is more indicative of tight monetary policy acting as a form of restraint, on top of positive terms-of-trade adjustments.
The relationship between oil and equities frays further with APAC selling led by tech dominating and extending into EMEA markets. U.S. futures are off, with the S&P not willing to change index eligibility to fast track mega-cap companies post-IPO such as SpaceX. AI unwinding pressure is notable. Global bonds continued to rally, with our data highlighting big inflows. RBI is in focus for EM, with policy push to cap INR and attract inflows, while Indonesia Fin Min confirms curve inversion strategy. The USD is weaker in G10, with focus on JPY intervention risk, but is making records in EM again, with focus on INR, KRW and MYR.
Bottom Line: The key question for trading risk into the U.S. session rests on the outcome of the U.S. labor market data, with the 50k–150k forecast range reflecting the skew toward either a muddle-through economy or a stronger one that forces the FOMC to hike. Whether rates move or not will be essential to the momentum trade in equities. The U.S. 2y (4%) and the 10y (4.5%) yield levels our duration flow data confirm as significant for asset allocation. The risk for June is a sharper unwind of the U.S. exceptionalism trade that has built over the past three months of the Iran conflict. The world’s capacity to grow outside the U.S. has proved limited – witness the negative GDP growth of the EU and Canada in Q1. The growth of the U.S. without the rest of the world requires something new like AI to improve productivity along with wages. Investors who once saw war-driven inflation as transitory are now treating it as a structural drag – a “bad year” rather than a passing shock. Returning to stagflation could be the driver for a larger rotation or retrenchment trade into the end of June.
Japan’s Prime Minister Sanae Takaichi said the government aims to strengthen the yen by boosting the economy’s long-term competitiveness through measures to encourage domestic investment, secure supply chains and raise growth potential. Her comments came as the yen remained near ¥160 per dollar, prompting renewed concern over currency weakness. Finance Minister Satsuki Katayama reiterated that authorities are monitoring markets closely and stand ready to intervene again after reports that Japan recently spent more than USD 73bn supporting the currency. BOJ Governor Kazuo Ueda also signaled that further interest rate increases may be needed if inflation risks continue to rise. Supporting the case for policy normalization, April wage growth accelerated to 3.5% y/y while household spending fell only 0.5%, both stronger than expected. Meanwhile, Japan’s foreign reserves dropped by USD 77bn in May, reflecting the cost of recent currency intervention efforts. Nikkei -1.31% to 66,588, USDJPY -0.05% to 159.94, 10y JGB -0.2bp to 2.672%.
Indonesia’s Finance Minister Purbaya Yudhi Sadewa pushed back against growing market pessimism and reports of a “Sell Indonesia” trade, arguing that capital inflows into government bonds and central bank securities show investors remain confident in the economy. Speaking at a budget briefing, he said debt markets continued to attract foreign funds during Q2 through early June, while equity outflows had not been large enough to erase net positive flows overall. His comments came as Indonesian assets remained under pressure, with the rupiah weakening beyond 18,000 per dollar, and the benchmark stock index ranking among the world’s worst performers this year. The remarks also followed speculation about Purbaya’s possible resignation (which he has denied) and increasing investor concerns over economic management and a corruption investigation linked to the government's food program. JCI -3.37% to 5,643, USDIDR -0.073% to 18,020, 10y IDGB +4.8bp to 6.861%.
India’s central bank kept the policy repo rate unchanged at 5.25% and retained its neutral policy stance, citing heightened uncertainty from the Iran conflict and a deteriorating global environment. Alongside the decision, the government and RBI unveiled measures to support the rupee and attract foreign capital, including removing capital gains and interest taxes for foreign investors in government bonds, improving incentives for non-resident dollar deposits, and offering concessional foreign exchange swaps for overseas borrowing. Policymakers raised their inflation forecast for the current fiscal year to 5.1% from 4.6% and cut GDP growth expectations to 6.6% from 6.9%, reflecting higher oil prices and weaker external conditions. Authorities estimate the new measures could attract USD 40bn to 60bn in inflows and help offset pressure from capital outflows and a weaker currency. SENSEX -0.19% to 74,221, USDINR -0.521% to 95.2937, 10y INGB -3.9bp to 6.952%.
The Boston Fed paper “Reassessing the U.S. Economy’s Vulnerability to Oil Shocks” argues that the U.S. economy’s vulnerability to oil shocks has changed materially since the 1970s. The U.S. has become far less oil-dependent and, by 2019, a net oil exporter, reducing the macroeconomic fallout from price spikes. For a 33% oil shock, the estimated impact on year-ahead PCE inflation is now about 1.5 percentage points, down from about 2.2 percentage points before the mid-1980s, while the effect on employment has largely disappeared compared with the 1970s. The paper highlights that oil-producing states such as Texas, New Mexico, North Dakota, Alaska and Oklahoma benefit from higher prices, offsetting job losses in oil-importing states. As a result, oil shocks still pose upside risks to inflation, but less of a stagflation-style threat than in the past. S&P Mini -0.58% to 7,557, DXY -0.151% to 99.263, 10y UST -1bp to 4.463%.
San Francisco Federal Reserve’s latest FedViews said the U.S. economy is growing slightly below trend, with Q1 2026 GDP expanding at a 1.6% annualized rate vs. an estimated 2.0% long-run pace. Business investment, especially in AI infrastructure, is supporting growth, while consumer spending is softer amid high gasoline and grocery costs and elevated uncertainty. Inflation remains sticky: CPI and PCE inflation were both 3.8% y/y in April, with core PCE at 3.3% y/y. Core goods inflation is a key upside driver, alongside energy and commodity price pressures from Middle East disruptions. Labor markets remain broadly balanced, with unemployment at 4.3% in April and little sign of stress in claims. Markets now expect tighter monetary policy, with no cuts priced for this year or next and some probability of a hike by late 2026 or early 2027.
U.S. May change in nonfarm payrolls is forecast to ease to 85k from 115k, with average hourly earnings expected at 0.3% m/m, 3.4% y/y vs. 0.2% m/m, 3.6% y/y in April. Average weekly hours is expected to hold at 34.3.
U.S. May unemployment rate is forecast to hold at 4.3%. Labor force participation rate is expected to be unchanged at 61.8%.
U.S. April consumer credit is expected to ease to $17.75bn vs. $24.9bn.
Canada May net change in employment is forecast to rise to 10.0k vs. -17.7k, with the unemployment rate expected to hold at 6.9%, and participation rate is forecast to hold at 65.0%. Hourly wage rate for permanent employees is expected to ease to 4.6% y/y vs. 4.8% y/y.
Canada May Ivey PMI is expected at 57 vs. 57.7 prior.
Central bank speakers: BOE Rate-Setter Swati Dhingra and BOE Governor Andrew Bailey.
Mood: iFlow Mood stabilized near recent lows at -0.328. Risk-off sentiment remains dominant, reflected in continued global equity selling alongside demand for core government bonds.
FX: Selling was concentrated in BRL, CLP and CAD, followed by AUD, NZD and THB, while CHF, MXN and ZAR attracted the strongest inflows. Elsewhere, USD was lightly sold, while EUR, GBP and JPY recorded moderate inflows. APAC FX flows were relatively muted overall.
Fixed Income: Government bond demand remained broad-based, led by Chile, Mexico, China and the Eurozone. Indonesian government bonds continued to face notable selling pressure.
Equities: Selling momentum remained aggressive across LatAm, EMEA and APAC, particularly in Chile, Mexico, Peru, the Czech Republic, Indonesia and South Korea. G10 flows were mixed, with buying in the U.S., Australia and New Zealand offset by light selling elsewhere. Within EM equities, consumer staples, consumer discretionary, industrials and materials were the most heavily sold sectors, while utilities and real estate attracted modest inflows.
“You can’t fast track patience” – Christine Caine
“It’s important to run not on the fast track, but on your track.” – Mike Davies
The euro area’s GDP in Q1 2026 fell 0.2% q/q, reversing the 0.2% expansion recorded in the previous quarter, while EU GDP declined 0.1%. Annual growth slowed sharply to 0.3% in the euro area and 0.7% in the EU, down from 1.2% and 1.4%, respectively in Q4 2025. Household consumption and government spending made small positive contributions to growth, but these were more than offset by weaker investment, inventory drawdowns and a negative contribution from net trade. Among member states, Denmark recorded the strongest quarterly growth at 1.9%, while Ireland contracted 12.1%. Despite the decline in output, labor market conditions remained resilient, with euro area employment rising 0.1% q/q and 0.5% y/y, although hours worked fell 0.2% from the previous quarter. Euro Stoxx 50 -0.25% to 6,088, EURUSD +0.216% to 1.1636, BBG AGG Euro Government High Grade EUR +5.5bp to 3.3%.
The euro area’s services production in March 2026 increased by 0.2% m/m, recovering part of February’s 0.3% decline, while services output in the EU rose 0.4%. Compared with March 2025, services production was up 0.9% in the euro area and 1.4% in the EU. The monthly increase was driven mainly by information and communication services, which rose 1.4% in the euro area, and transportation and storage, which was up 0.7%. In contrast, accommodation and food services fell 0.5%, while professional, scientific and technical activities declined 1.0%. Among member states, the strongest monthly increases were recorded in Hungary, Luxembourg and the Netherlands, while Germany posted a 1.6% decline. On an annual basis, information and communication services remained the strongest performing sector, rising 3.9% in the euro area and 4.3% in the EU.
France’s industrial production in April 2026 increased by 0.1% m/m, while manufacturing output rose 0.4% after a 1.3% gain in March, according to Insee. The monthly rise was driven mainly by transport equipment, which advanced 3.3%, and by a further increase in coke and refined petroleum products, while food production was flat. By contrast, output fell in electrical, electronic and computer equipment, other industrial products, and in utilities, partly because unusually mild weather reduced electricity production. Over the three months to April, industrial output was up 1.2% y/y and manufacturing rose 1.6%, with transport equipment showing the strongest annual gain. CAC 40 +0.23% to 8,263, EURUSD +0.216% to 1.1636, 10y OAT -0.6bp to 3.661%.
Italy’s retail sales for April 2026 came in broadly flat in value on the month and down 0.3% in volume. Food sales edged up 0.2% in value but fell 0.2% in volume, while nonfood sales declined 0.2% in value and 0.4% in volume. From February to April, sales rose 0.8% in value and 0.2% in volume. On a y/y basis, retail sales increased 1.6% in value but slipped 0.3% in volume, with food volumes down 2.2% and nonfood sales up 2.6% in value and 1.2% in volume. Online trade led gains, rising 8.4% in value and remaining the only channel with volume growth. FTSEMIB -0.04% to 50,156, EURUSD +0.216% to 1.1636, 10y BTP -0.8bp to 3.761%.
U.K. house prices in May 2026 were broadly stable, with the Halifax House Price Index showing a 0.1% monthly decline after a similar fall in April, leaving the average home price at £298,806. On a quarterly basis, prices were down 0.2%, while annual growth edged up to 0.5% from 0.4% previously. Halifax said the market remained resilient despite uncertainty tied to Middle East developments, while higher inflation expectations kept borrowing costs elevated and continued to weigh on affordability and demand. Regionally, Northern Ireland led growth at 7.8%, while southern England remained weaker, with London and the South East still posting annual declines. FTSE 100 -0.02% to 10,359, GBPUSD +0.157% to 1.3445, 10y gilt 0bp to 4.898%.
The U.K. DMP survey for May 2026 showed firms reporting realized annual own price growth of 3.8% in the three months to May, up 0.1 percentage points from the three months to April, while the single month measure rose to 3.9%. Year-ahead own-price inflation expectations increased to 4.0%, and year-ahead CPI inflation expectations climbed to 3.7%, although three-year-ahead CPI expectations were unchanged at 2.8%. Annual wage growth eased to 4.2%, expected wage growth stayed at 3.4%, and employment growth remained slightly negative at -0.3%. Firms also said higher prices and lower profit margins were the main expected responses to the energy shock.
Sweden’s housing market strengthened in May 2026, with apartment prices rising 0.3% m/m and house prices increasing 1.2%. Annual price growth also accelerated, with apartment prices up 4.4% from a year earlier and house prices up 2.2%. Regional developments were mixed for apartments, with prices broadly unchanged in Stockholm, rising 2.0% in central Gothenburg and 0.7% in Greater Malmö, while central Malmö recorded a decline of 0.8%. House prices increased by around 1% across all major metropolitan areas during the month. Market activity remained robust, with 49,100 homes sold during March to May, up 9% from the same period a year earlier. Apartment transactions rose 13% to 32,200, while house sales increased 3% to 16,900, indicating stronger turnover alongside moderate price gains. OMX -0.7% to 3,113, EURSEK -0.17% to 10.8747, 10y Swedish GB +0.3bp to 2.877%.
Swedish central government finances for May 2026 posted a surplus of SEK 18.1bn, below the Debt Office forecast of SEK 30.1bn. The shortfall mainly reflected higher disbursements from government agencies, while tax income was also SEK 5bn weaker than expected. The primary balance came in SEK 14.7bn below forecast, and net lending to government agencies was SEK 2.4bn lower than projected. Interest payments on central government debt were slightly below forecast. Over the 12 months to end May 2026, central government payments generated a deficit of SEK 122.3bn, while central government debt stood at SEK 1,221bn at month end.
Sweden’s current account surplus for Q1 2026 came in at SEK 94bn, down SEK 37.4bn from Q1 2025, as higher services imports and weaker capital returns weighed on the external balance. The current account surplus still amounted to 6.1% of GDP on a four-quarter average basis, down from 6.7% previously. The trade balance posted an SEK 88.8bn surplus, while the services balance remained in deficit at SEK 31.3bn. Primary income surplus narrowed to SEK 68.1bn and secondary income deficit eased to SEK 31.6bn. The financial account showed net lending of SEK 192.1bn, and Sweden’s net external assets rose to SEK 4,033.2bn.
Norway’s industrial production fell 0.9% m/m in April 2026 on a seasonally adjusted basis, reversing part of the gains seen earlier in the year. The decline was driven mainly by weaker activity in fabricated metal products, machinery repair and installation, and machinery manufacturing. However, stronger output in petroleum refining, chemicals and pharmaceuticals, up 4.5%, and metals production, up 5.5%, helped limit the overall fall. Despite the monthly setback, industrial activity remained on an upward trend, with production in the February to April period rising 0.4% compared with the previous three months. Growth was led by petroleum refining, chemicals and pharmaceuticals, as production recovered from earlier operational disruptions. Petroleum-related supplier industries also remained resilient, with output rising 1.1% over the three-month period, while industry excluding petroleum suppliers edged down 0.1%. OSE +0.31% to 2,008, EURNOK +0.082% to 10.8587, 10y NGB +0.9bp to 4.381%.
Norway’s industrial turnover for February April 2026 rose 3.9% from the previous three-month period, while the seasonally adjusted monthly gain from March to April was 2.0%, marking the fourth straight month of growth. The index level reached 138.0, up from 132.8 in the prior three-month span. The strongest contribution came from oil refining, chemicals and pharmaceuticals, which jumped 19% over the three-month period and 17% m/m, helped by sharply higher prices for refined petroleum products. Metal industries and ship and oil platform building also supported growth, while machinery repair and installation softened the overall increase.
Hungary’s industrial production for April 2026 rose 0.9% y/y, while falling 1.1% from March on a seasonally and working day adjusted basis. The statistical office said the working day adjusted index matched the non-adjusted measure, indicating no calendar distortion. Output increased in some key manufacturing segments, including transport equipment and computer, electronic and optical products, but declined in several large subsections such as electrical equipment and food, beverages and tobacco. For the first four months of 2026, industrial production was 1.0% above the same period in 2025, suggesting that YTD activity remained modestly positive despite the monthly setback. Budapest SI +0.73% to 134,571, EURHUF -0.105% to 353.89, 10y HGB +3bp to 5.5%.
Czech retail trade ex-motor vehicles fell 0.9% m/m in April, while sales in sale and repair of motor vehicles declined 0.3%. On a y/y basis, retail sales rose 1.6%, but the pace slowed from earlier months. Non-food goods remained the main support, up 5.1%, while automotive fuel and food sales both fell. The Czech Statistical Office said adjusted retail sales continued to expand but at a softer rate, with weaker demand also seen in information and communication equipment stores. Online sales were strong, rising 11.8%, and cosmetic, pharmacy, clothing and other household categories also posted gains. Prague SE -0.31% to 2,528, EURCZK -0.133% to 24.168, 10y CZGB +1.5bp to 4.808%.
Turkey’s inflation for May 2026 came in at 32.61% y/y, up 1.71% m/m, according to Turkstat. The main drivers of annual inflation were food and nonalcoholic beverages, transport, and housing, water, electricity, gas and other fuels, which rose 34.86%, 34.29%, and 45.59%, respectively, and together contributed most to the headline rate. On a monthly basis, food prices fell 0.48%, but transport and housing increased 2.03% and 2.28%. The core CPI measure – excluding unprocessed food, energy, alcohol, tobacco and gold – rose 31.30% from a year earlier and 2.87% on the month. BI 100 -0.28% to 13,833, USDTRY +0.131% to 46.0855, 10y TGB +4bp to 34.37%.
Turkey’s Domestic Producer Price Index for May 2026 rose 28.93% y/y, after a 2.75% increase from April and a 14.04% rise from December last year. The Turkish Statistical Institute said producer prices also increased 26.96% on a 12-month moving average basis. By sector, annual gains were led by mining and quarrying at 42.74% and manufacturing at 30.72%, while electricity, gas, steam and air conditioning rose 6.88%, and water supply gained 35.00%. On a monthly basis, electricity was the strongest driver, up 12.04%, while manufacturing increased 1.99%.
Japan’s leading coincident economic indicator for April 2026, released by the Cabinet Office, rose 1.1 points from the previous month to 117.9, marking a second straight monthly increase. The government judged the economy to be in an upward phase shift, or a potential turning point toward recovery, while keeping its overall basic assessment unchanged. Gains were supported mainly by the investment goods shipment index excluding transport equipment and wholesale sales. The leading index also increased 0.5 points to 115.9, extending its rise to 11 months, while the lagging index fell 0.4 point to 111.2 for a third consecutive decline. Nikkei -1.31% to 66,588, USDJPY -0.05% to 159.94, 10y JGB -0.2bp to 2.672%.
Japan’s monthly labor cash earnings for April came in at ¥312,425, up 3.5% from a year earlier, marking a third straight month of gains above 3% and the strongest pace in 34 years and one month. Scheduled pay rose 3.4% to ¥299,096, while base pay excluding overtime also increased 3.4% to ¥277,916. For regular workers, cash earnings climbed 3.9% and scheduled pay rose 3.7%. Part-time hourly pay increased 4.9% to ¥1,436. Real cash earnings, adjusted by the consumer price index ex-imputed rent, rose 1.9%, supported by CPI inflation of 1.5%.
Japan’s household spending for April 2026 fell 0.5% y/y in real terms, while nominal outlays rose 1.0%, according to the Ministry of Internal Affairs and Communications. Average consumption expenditure for two or more person households was ¥328,969, and seasonally adjusted spending rose 1.6% from the previous month. The decline was led by education, housing-related services, clothing and footwear, and utilities – partly offset by gains in transport and communication, furniture and household items, and recreation. In worker households, real income rose 2.3% to ¥612,163, supporting disposable income growth of 2.3%. The average propensity to consume fell to 73.9%.
Bank of Korea data show that South Korea’s April 2026 balance of payments remained in strong surplus. The current account posted a $28.29bn surplus (vs. $37.93bn in March 2026 or $4.51bn in April 2025), supported by a goods surplus of $33.88bn as exports rose 54.5% y/y to $90.59bn and imports increased 16.1% y/y to $56.70bn. The services account recorded a $2.42bn deficit, while primary income showed a $2.53bn deficit on lower equity income and secondary income a $0.64bn deficit. On the financial account, net assets increased by $25.46bn, led by other investment and direct investment, while reserve assets rose $1.02bn. Also note that outbound equity investment flows rebounded higher to $5.9bn or $34bn YTD. KOSPI -5.54% to 8,161, USDKRW +0.63% to 1,541.35, 10y KTB +9.1bp to 4.227%.
Thailand’s inflation for May came in at 2.79% y/y, easing from 2.89% in April and undershooting the 3.1% median forecast in a Bloomberg survey. The CPI remained within the Bank of Thailand’s 1–3% target range, reducing immediate pressure for a policy response, although officials still expect inflation to rise above target in the second half of the year. The monthly CPI rose 0.17%, while core inflation edged up to 0.92% from 0.83%. Lower fuel, transport, meat, vegetable, egg and dairy prices helped temper inflation, and weak consumer confidence also appears to have restrained spending. SET -0.69% to 1,584, USDTHB -0.083% to 32.635, 10y TGN -8.1bp to 2.229%.
The Philippines’ headline inflation for May 2026 eased to 6.8% y/y from 7.2% in April 2026, bringing the average inflation rate for January to May 2026 to 4.5%. Inflation was still far above the 1.3% recorded in May 2025, but the monthly slowdown reflected softer price growth in transport, which moderated to 16.2% from 21.4%, as well as slower increases in food and nonalcoholic beverages, and housing, water, electricity, gas and other fuels. Offsetting this, several categories, including alcohol and tobacco, health, and restaurants and accommodation services, posted faster gains. Food and nonalcoholic beverages, housing, and transport remained the main contributors to overall inflation. PSEi +0.45% to 5,938, USDPHP -0.231% to 61.479, 10y PHGB +1.8bp to 7.437%.
Taiwan’s consumer price inflation for May came in at 2.20% y/y, up from 1.73% in April, while the monthly CPI rose 0.19% and the seasonally adjusted index gained 0.26%. The increase was driven by higher food prices, especially vegetables and fruit after heavy rain, along with more expensive airfare, entertainment services, housing rents, electricity and gas. Core CPI, excluding vegetables, fruit and energy, rose 2.12%. For the first five months of 2026, CPI averaged 1.52% higher than a year earlier. Producer prices fell 0.07% on the month but jumped 14.11% from a year earlier, as import and export prices also stayed elevated. TAIEX -1.33% to 45,071, USDTWD +0.089% to 31.495, 10y TGB -1.5bp to 1.7%.
Singapore’s retail sales and food and beverage services for April 2026 showed a mixed but broadly firmer domestic consumption picture. Total retail sales rose 5.4% y/y and 0.3% m/m in seasonally adjusted terms, while sales excluding motor vehicles gained 4.5% y/y and 0.4% m/m. Retail turnover was estimated at SGD 4.3bn, with online sales making up 15.4%. F and B services increased only 0.4% y/y, but rose 1.1% m/m, with sales value at SGD 1.5bn and online sales at 19.9%. Gains were led by petrol stations, recreational goods, motor vehicles, and fast-food outlets. STI -0.4% to 5,047, USDSGD -0.055% to 1.2839, 10y SGB +3.7bp to 2.089%.