Market Movers: Less Enthusiastic
Market Movers highlights key activities and developments before the U.S. market opens each morning.
Market Movers highlights key activities and developments before the U.S. market opens each morning.

Bob Savage
Time to Read: 7 minutes
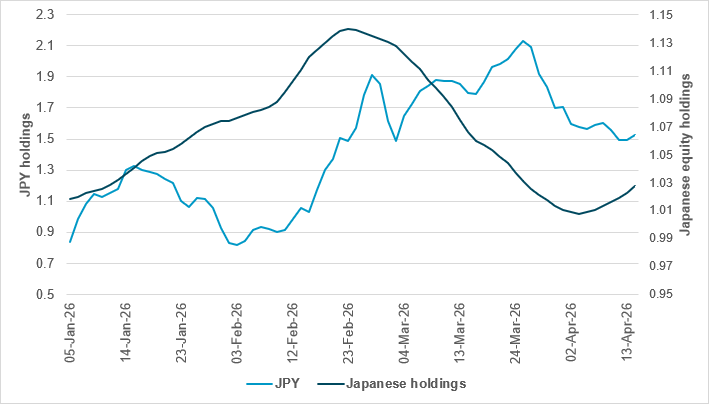
Daily holdings of JPY and Japanese equities
Source: BNY
The Japanese Nikkei share index has rallied to set a new record highs, erasing all the losses from the Iran war. However, our holdings data suggest that investors are not back to February highs. International investors’ asset allocation to Japan was close to the MSCI ACWI index before the conflict, but not today. It will take another 10% shift to get back to those highs.
JPY holdings mostly reflect the hedging of Japan investments abroad. The FX positions are balanced against foreign hedging, which our data show restarted in the last week of March. The holdings figures suggest Japanese outflows into the U.S. and other markets have not been as large as the inflows, adding to pressure on JPY. FX positions remain overheld, led by the significant Japanese hedge.
The risk of intervention by Japan’s finance minister will have less effect until those hedges unwind – with the basis trade in JGBs against U.S. bonds part of the narrative. As such, BoJ rate hike risk should be a key factor for the weeks ahead in setting the course for the dollar.
The rally in global stocks has extended for a tenth successive day, as the U.S. and Iran consider extensions to the ceasefire. However, there is as yet no confirmation of a second round of talks. On top of the peace hopes, investors got stronger-than-expected growth from China in Q1 and the U.K. in February. Ongoing earnings are underpinning the rally, with the focus on TSMC keeping technology at the forefront. However, oil prices remain up 1%, USD is bid and U.S. bonds are stuck in a steepening trade. U.S. stock futures still point higher, but with less enthusiasm.
Bottom line: USD has dropped for eight sessions but that move is stalling today. That difference could be sufficient to see the equity rally run out of steam somewhat today. Curbing the enthusiasm in the U.S. markets will rest on earnings, rates and progress in clearing away the fog of war toward some more sustainable peace. Markets are trying to get back to normal, but the ongoing uncertainty is translating into volatility, casting doubt that momentum factors will suffice. The buy-the-dip phase of the recovery has worked; investors now have to face the same old wall of worry to get further, with inflation and growth the crimps and holds for success.
U.S. Treasury Secretary Scott Bessent has announced warning letters to two unnamed Chinese banks over potential secondary sanctions linked to Iranian transactions. This is part of the U.S. “Economic Fury” initiative targeting foreign financial institutions that are facilitating Iranian oil purchases. The U.S. will reinstate sanctions on Iranian oil by not renewing the waiver that expires on April 19, intensifying the economic pressure on Iran. Secondary sanctions are forcing entities to choose between U.S. business and sanctioned parties, leveraging the U.S. dollar’s global role. This move precedes a planned Trump-Xi meeting in mid-May amid heightened U.S.-Chinese tensions. The U.S. is also maintaining a naval blockade of the Strait of Hormuz, risking ceasefire breaches. S&P Mini +0.08% to 7067, DXY +0.122% to 98.174, 10y UST -0.6bp to 4.278%.
The U.S. Treasury’s Office of Foreign Assets Control (OFAC) has sanctioned over two dozen individuals, companies and vessels linked to Iranian oil smuggling led by Mohammad Hossein Shamkhani, as it targets a multi-billion-dollar network enriching Iranian regime elites. The action also targets Hezbollah’s gold smuggling scheme, which benefits Iran’s IRGC-Quds Force, involving oil-for-gold trades with Venezuela. The sanctions relate to front companies in the UAE, India and the Marshall Islands that are facilitating shipping and evasion tactics, as well as vessels transporting Iranian and Russian petroleum products. These measures under Executive Orders 13902 and 13224 aim to disrupt Iran’s illicit oil revenues and terror financing.
ECB officials are leaning toward holding interest rates steady at their April 29-30 meeting, delaying decisions amid uncertainty over the impact of the Iran war on economic growth and inflation. Despite a March rise in headline inflation to 2.5% y/y in the euro area, underlying price pressures remain limited. ECB President Christine Lagarde has emphasized agility without a bias toward hikes, while Governing Council member François Villeroy de Galhau has called for more data before acting, citing risks from volatile oil prices and potential negative effects on demand and growth. The ECB’s Isabel Schnabel has said the ECB can afford to take time to analyze the Iran shock and does not want to impose unnecessary costs on the economy. Investors still anticipate two quarter-point hikes later this year. Euro Stoxx 50 +0.27% to 5956, EURUSD +0.034% to 1.1781, BBG AGG Euro Government High Grade EUR -7bp to 3.265%.
Taiwan Semiconductor Manufacturing Company (TSMC) has reported a 58% rise in Q1 net income to NT$572.48bn, beating estimates, on strong AI chip demand. Revenue reached NT$1.134tn ($35bn), marking a fourth consecutive quarterly record and a 35% y/y increase. Advanced chips (7nm or smaller) accounted for 74% of wafer revenue, with 3nm chips at 25%. High-performance computing, including AI and 5G, made up 61% of sales. TSMC has raised its 2026 outlook, which features over 30% revenue growth and Q2 revenue of $39-40.2bn. Despite Middle East supply concerns, no near-term operational impact is expected. TAIEX +1.12% to 37132, USDTWD +0.298% to 31.556, 10y TGB +0.2bp to 1.505%.
U.S. April New York Fed services business activity forecast at -20 points from -22.6.
U.S. weekly initial jobless claims are expected to ease to 213k vs. 219k.
U.S. April Philadelphia Fed business outlook forecast to ease to 10 points vs. 18.1.
U.S. March industrial production is expected to ease to 0.10% m/m vs. 0.20% m/m while manufacturing production is expected to ease to 0.10% m/m vs. 0.20% m/m and capacity utilization is expected to hold at 76.30% vs. 76.30%.
Central bank speakers:
The ECB’s Mārtiņš Kazāks speaks in Washington, DC, on “Reinventing Bretton Woods Committee – 2026 Global Macro Session: The Dollar, China, Europe and the World’s Savings: A New Balance of Power?”
The ECB’s Isabel Schnabel speaks in Washington, DC, on “The future economic architecture of the eurozone.”
The ECB’s Olli Rehn speaks in Washington, DC, on “Reinventing Bretton Woods Committee – 2026 Global Macro Session: The Eurozone.”
The ECB’s Philip Lane and the BoE’s Alan Taylor Speak in Washington, DC, on “Reinventing Bretton Woods Committee – 2026 Global Macro Session: Monetary Policy Challenges.”
The ECB’s Martin Kocher and Dimitar Radev speak in Washington, DC, on “Atlantic Council event: A more global euro starts at home.”
The ECB’s François Villeroy de Galhau speaks in Washington, DC, on “IMF debate on the global economy.”
The Bundesbank’s Joachim Nagel and German Finance Minister Lars Klingbeil speak in Washington, DC.
The ECB’s Philip Lane speaks in Washington, DC, on “Rethinking Macro Policy Frameworks for a Transforming, Shock Prone World.”
U.S. Treasury sells $80bn 4-week bills and $75bn in 8-week bills.
Mood: iFlow Mood has surged to 0.217, taking it firmly into risk-on territory for the first time since end-February. This was driven by strong equity demand alongside continued selling of core sovereign bonds.
FX: Moderate inflows overall, led by CHF, AUD, CLP, INR and MYR, and offset by outflows in USD, COP, BRL and IDR. EUR is seeing building inflow momentum, while USD selling has resumed as a trend.
FI: Strong demand for Eurozone and Hungarian sovereign bonds, followed by Poland, China, Mexico and Peru. In contrast, Australian, Philippine and Indian government bonds saw notable outflows.
Equities: Broad-based buying across the G10 and LatAm, with mixed flows in EMEA and APAC. Strong demand in Australia, Sweden, Hungary, Türkiye, China and Taiwan. In DM, financials and industrials led inflows, while consumer staples was the only sector to see outflows.
“Enthusiasm is the yeast that makes your hopes shine to the stars.” – Henry Ford.
“Success consists of going from failure to failure without a loss of enthusiasm.” – Winston Churchill
In the U.K., real GDP grew by 0.5% in February 2026 (m/m), following a 0.1% increase in January 2026 (revised up from 0.0%) and 0.1% in December 2025. For the three months to February 2026, GDP expanded by 0.5% (q/q), up from 0.3% in the three months to January 2026 and zero growth in the three months to December 2025. The services and production sectors each grew by 0.5% in February, while construction rose by 1.0%. Over the year to February 2026, GDP increased by 1.0%. Services led growth, supported by the wholesale and retail trade, information and communication, and transportation subsectors. FTSE 100 +0.21% to 10582, GBPUSD +0.03% to 1.3552, 10y gilt -1.5bp to 4.799%.
U.K. goods imports rose by £2.3bn (4.7%) in February. Growth came from both EU (+£0.6bn, 2.3%) and non-EU countries (+£1.7bn, 7.5%), driven by machinery, chemicals and fuel. Goods exports fell by £0.5bn (1.5%), with declines to both EU (-£0.1bn, 0.7%) and non-EU countries (-£0.4bn, 2.3%), notably in chemicals and machinery. Exports to the U.S. increased by £0.5bn (11.3%), with growth coming principally in machinery and transport equipment, while imports from the U.S. decreased by £0.4bn (8.2%), led by lower aircraft imports. The three-month trade deficit narrowed to £2.8bn, with a wider goods deficit (£57.1bn) offset by a larger services surplus (£54.2bn).
The U.K. index of production for February showed a 0.5% m/m increase following falls in January (-0.1%) and December (-0.4%). Production output rose 1.2% q/q in the three months to February, driven by manufacturing (+1.2%), electricity and gas (+3.6%) and water supply (+0.1%), partly offset by mining and quarrying (-2.1%). Within manufacturing, transport equipment led gains (+8.9%); in particular, motor vehicles (+18.8%) recovered from a cyber incident in September 2025. February’s monthly rise was supported by mining and quarrying (+3.9%) and electricity and gas (+1.5%) while manufacturing dipped slightly (-0.1%).
The U.K. index of services output increased by 0.5% m/m in February, following rises of 0.1% in January and 0.3% in December. Over the three months to February, services output grew 0.5% q/q. Ten out of 14 sectors expanded, led by wholesale and retail trade (+1.4%) and information and communication (+1.6%). Four sectors saw falls, above all administrative and support services (-0.8%). M/m gains were recorded in 12 sectors, with administrative and support services (+2.0%) and wholesale and retail trade (+0.7%) contributing most. Accommodation and food services fell 0.3%.
U.K. construction output fell by 2.0% in the three months to February 2026, marking the fifth consecutive quarterly decline. New work decreased by 3.4%, while repair and maintenance remained flat (0.0%). Six out of nine sectors fell, with private new housing down 6.5%, representing the largest drag. However, monthly output rose 1.0% in February 2026, following a revised 0.5% increase in January and a revised 1.3% fall in December 2025. Both new work and repair and maintenance contributed to February’s m/m growth, increasing by 1.0% and 0.9%, respectively.
Switzerland’s producer and import price index for March rose by 0.2% m/m, driven mainly by higher prices for petroleum products, petroleum and natural gas. Compared with March 2025, the overall price level was down 2.7% y/y. Producer prices decreased for pharmaceuticals, chemicals and meat products, while petroleum products and electricity prices increased. Import prices rose due to petroleum, natural gas, basic metals and certain agricultural products, whereas prices for rubber, plastics, paper, pharmaceuticals and chemicals decreased. SMI -0.11% to 13205, EURCHF -0.066% to 0.92219, 10y Swiss GB -1.5bp to 0.421%.
Italy’s consumer prices rose by 0.5% m/m and 1.7% y/y in March, confirming the initial estimate, from 0.7% m/m, 1.5% y/y in February. The inflation increase was mainly driven by higher prices in regulated and non-regulated energy and unprocessed food, while recreational, cultural, personal care services and transport services prices slowed. Core inflation excluding energy and fresh food eased to 1.9% y/y from 2.4% y/y. Goods prices turned positive at +0.8% y/y, while services growth slowed to +2.8% y/y. The harmonized index (IPCA) rose 1.7% m/m and 1.6% y/y. Q1 inflation for lower-spending households was +1.0%, and +1.6% for higher-spending ones. FTSE MIB +0.25% to 48277, EURUSD +0.034% to 1.1781, 10y BTP -2.8bp to 3.789%.
Eurozone inflation rose to 2.6% y/y in March from 1.9% in February (2.2% in March 2025) , driven by higher prices in services (+1.49 percentage points), energy (+0.48 percentage points), food, alcohol and tobacco (+0.45 percentage points) and non-energy industrial goods (+0.13 percentage points). Monthly inflation was 1.3% in March. Core inflation excluding energy remained stable at 2.3% y/y. Food inflation stood at 2.4% y/y, with unprocessed food at 4.2%. Energy inflation sharply increased to 5.1% m/m, reversing previous falls. Inflation rates varied across member states, with Romania highest at 9.0% and Denmark lowest at 1.0%. Euro Stoxx 50 +0.27% to 5956, EURUSD. +0.034% to 1.1781, BBG AGG Euro Government High Grade EUR -7bp to 3.265%
The Netherlands’ March 2026 unemployment rate decreased slightly to 4.0% from 4.1% in February, with 407,000 unemployed people (seasonally adjusted). Employment increased by an average of 3,000 per month over the past three months, while unemployment decreased by 1,000 per month. The labor force grew marginally (+1,000). The reduction in unemployment was driven by more unemployed people finding jobs and fewer people entering the labor force seeking work. AEX +0.23% to 1018, EURUSD +0.034% to 1.1781, 10y NGB -1.9bp to 3.148%.
China’s GDP grew 1.3% q/q, 5.0% y/y in Q1, accelerating from 1.2% q/q, 4.5% y/y in Q4 2025, supported by strong exports. Primary, secondary and tertiary industries rose by 3.8%, 4.9% and 5.2% y/y, respectively. Industrial production accelerated (+6.1% y/y), led by equipment (+8.9%) and high-tech manufacturing (+12.5%). Services grew 5.2% y/y, with strong gains in leasing, IT and finance. However, the growth profile remains uneven. Activity indicators softened: retail sales rose 1.7% y/y in March (February: 2.8%), while industrial output eased to 6.1% y/y (February YTD: 6.3%). Fixed asset investment increased by 1.7% y/y YTD (February: 1.8%), with property investment again contracting, at -11.2% YTD. The urban unemployment rate edged up to 5.4% (February: 5.3%). Exports grew 14.7% y/y in Q1 but slowed sharply to 2.5% in March, reflecting higher energy and logistics costs amid the Iran conflict. Overall, Q1 marked a solid start to the year, but momentum is unbalanced, driven by exports, while domestic demand and investment remain soft. The National Bureau of Statistics has cautioned about the complex and volatile external environment, saying the imbalance between strong supply and weak demand is still acute and the foundations for economic growth are yet to be consolidated. CSI 300 +1.1% to 4737, USDCNY -0.002% to 6.8191, 10y CGB -0.2bp to 1.781%.
China’s real estate market showed continued contraction between January and March 2026. Real estate development investment totaled ¥1.772tn, down 11.2% y/y, with residential investment falling 11.0%. Construction area decreased by 11.7% y/y, new housing starts by 20.3% y/y and completions by 25.0%. New commercial housing sales area declined by 10.4%, with the residential sales area down 13.1%. The sales value dropped 16.7% y/y, with the residential sales value down -18.5% y/y. At end-March, commercial housing inventory was nearly flat (-0.1% y/y). Developer funding fell by 17.3% y/y, with domestic loans down 23.7% y/y, self-raised funds down 5.3% y/y, deposits and pre-sales down 20.1% y/y and mortgage loans down 34.6% y/y.
China’s new home prices fell 3.59% y/y in March 2026, slightly down from a 3.46% decrease in February. M/m, new home prices decreased by 0.21% in March, improving from a 0.28% drop in February. New home prices in tier-one cities rose for the second straight month at 0.2% m/m, in the best monthly gain since April 2023. These cities saw a 2.15% y/y decline, with Beijing down 2.10% y/y while Shanghai rose 3.70% y/y. Second-tier and third-tier cities experienced falls of 3.29% and 4.04% y/y, respectively. Existing home prices fell 6.33% y/y in March, which was stable compared with February’s 6.31% drop; first-tier cities experienced steeper falls.
Australia’s seasonally adjusted unemployment rate remained steady at 4.3% in March. Employment rose by 18,000, driven by a 53,000 increase in full-time jobs, partly offset by a 35,000 reduction in part-time employment. Full-time employment gains were seen in both males (+29,000) and females (+24,000), while part-time jobs fell for males (-19,000) and females (-16,000). Hours worked increased by 0.5%, with full-time hours up 0.4% and part-time hours up 0.6%, reflecting longer hours per part-time worker. The participation rate edged down 0.1 percentage points to 66.8%. Annual hours worked grew 2.0%, outpacing employment growth of 1.4%. The employment-to-population ratio remained at 64.0%. ASX +0.25% to 5668, AUDUSD +0.477% to 0.7172, 10y ACGB +2.5bp to 4.955%.
Australia’s April consumer inflation expectations increased by 0.7 percentage points to 5.9% (30% trimmed mean), reaching its highest level since November 2022. This rise was mainly driven by the recent spike in oil prices. Meanwhile, trimmed mean wage expectations have remained stable over the past five months. Rising inflation expectations further affirm a near-term RBA tightening bias.