Supply shock doesn’t imply flow shock
FX: G10 & EM, published every Thursday, provides a detailed analysis of global foreign exchange movements in major and emerging economies around the world together with macro insights.
FX: G10 & EM, published every Thursday, provides a detailed analysis of global foreign exchange movements in major and emerging economies around the world together with macro insights.

Geoff Yu
Time to Read: 5 minutes
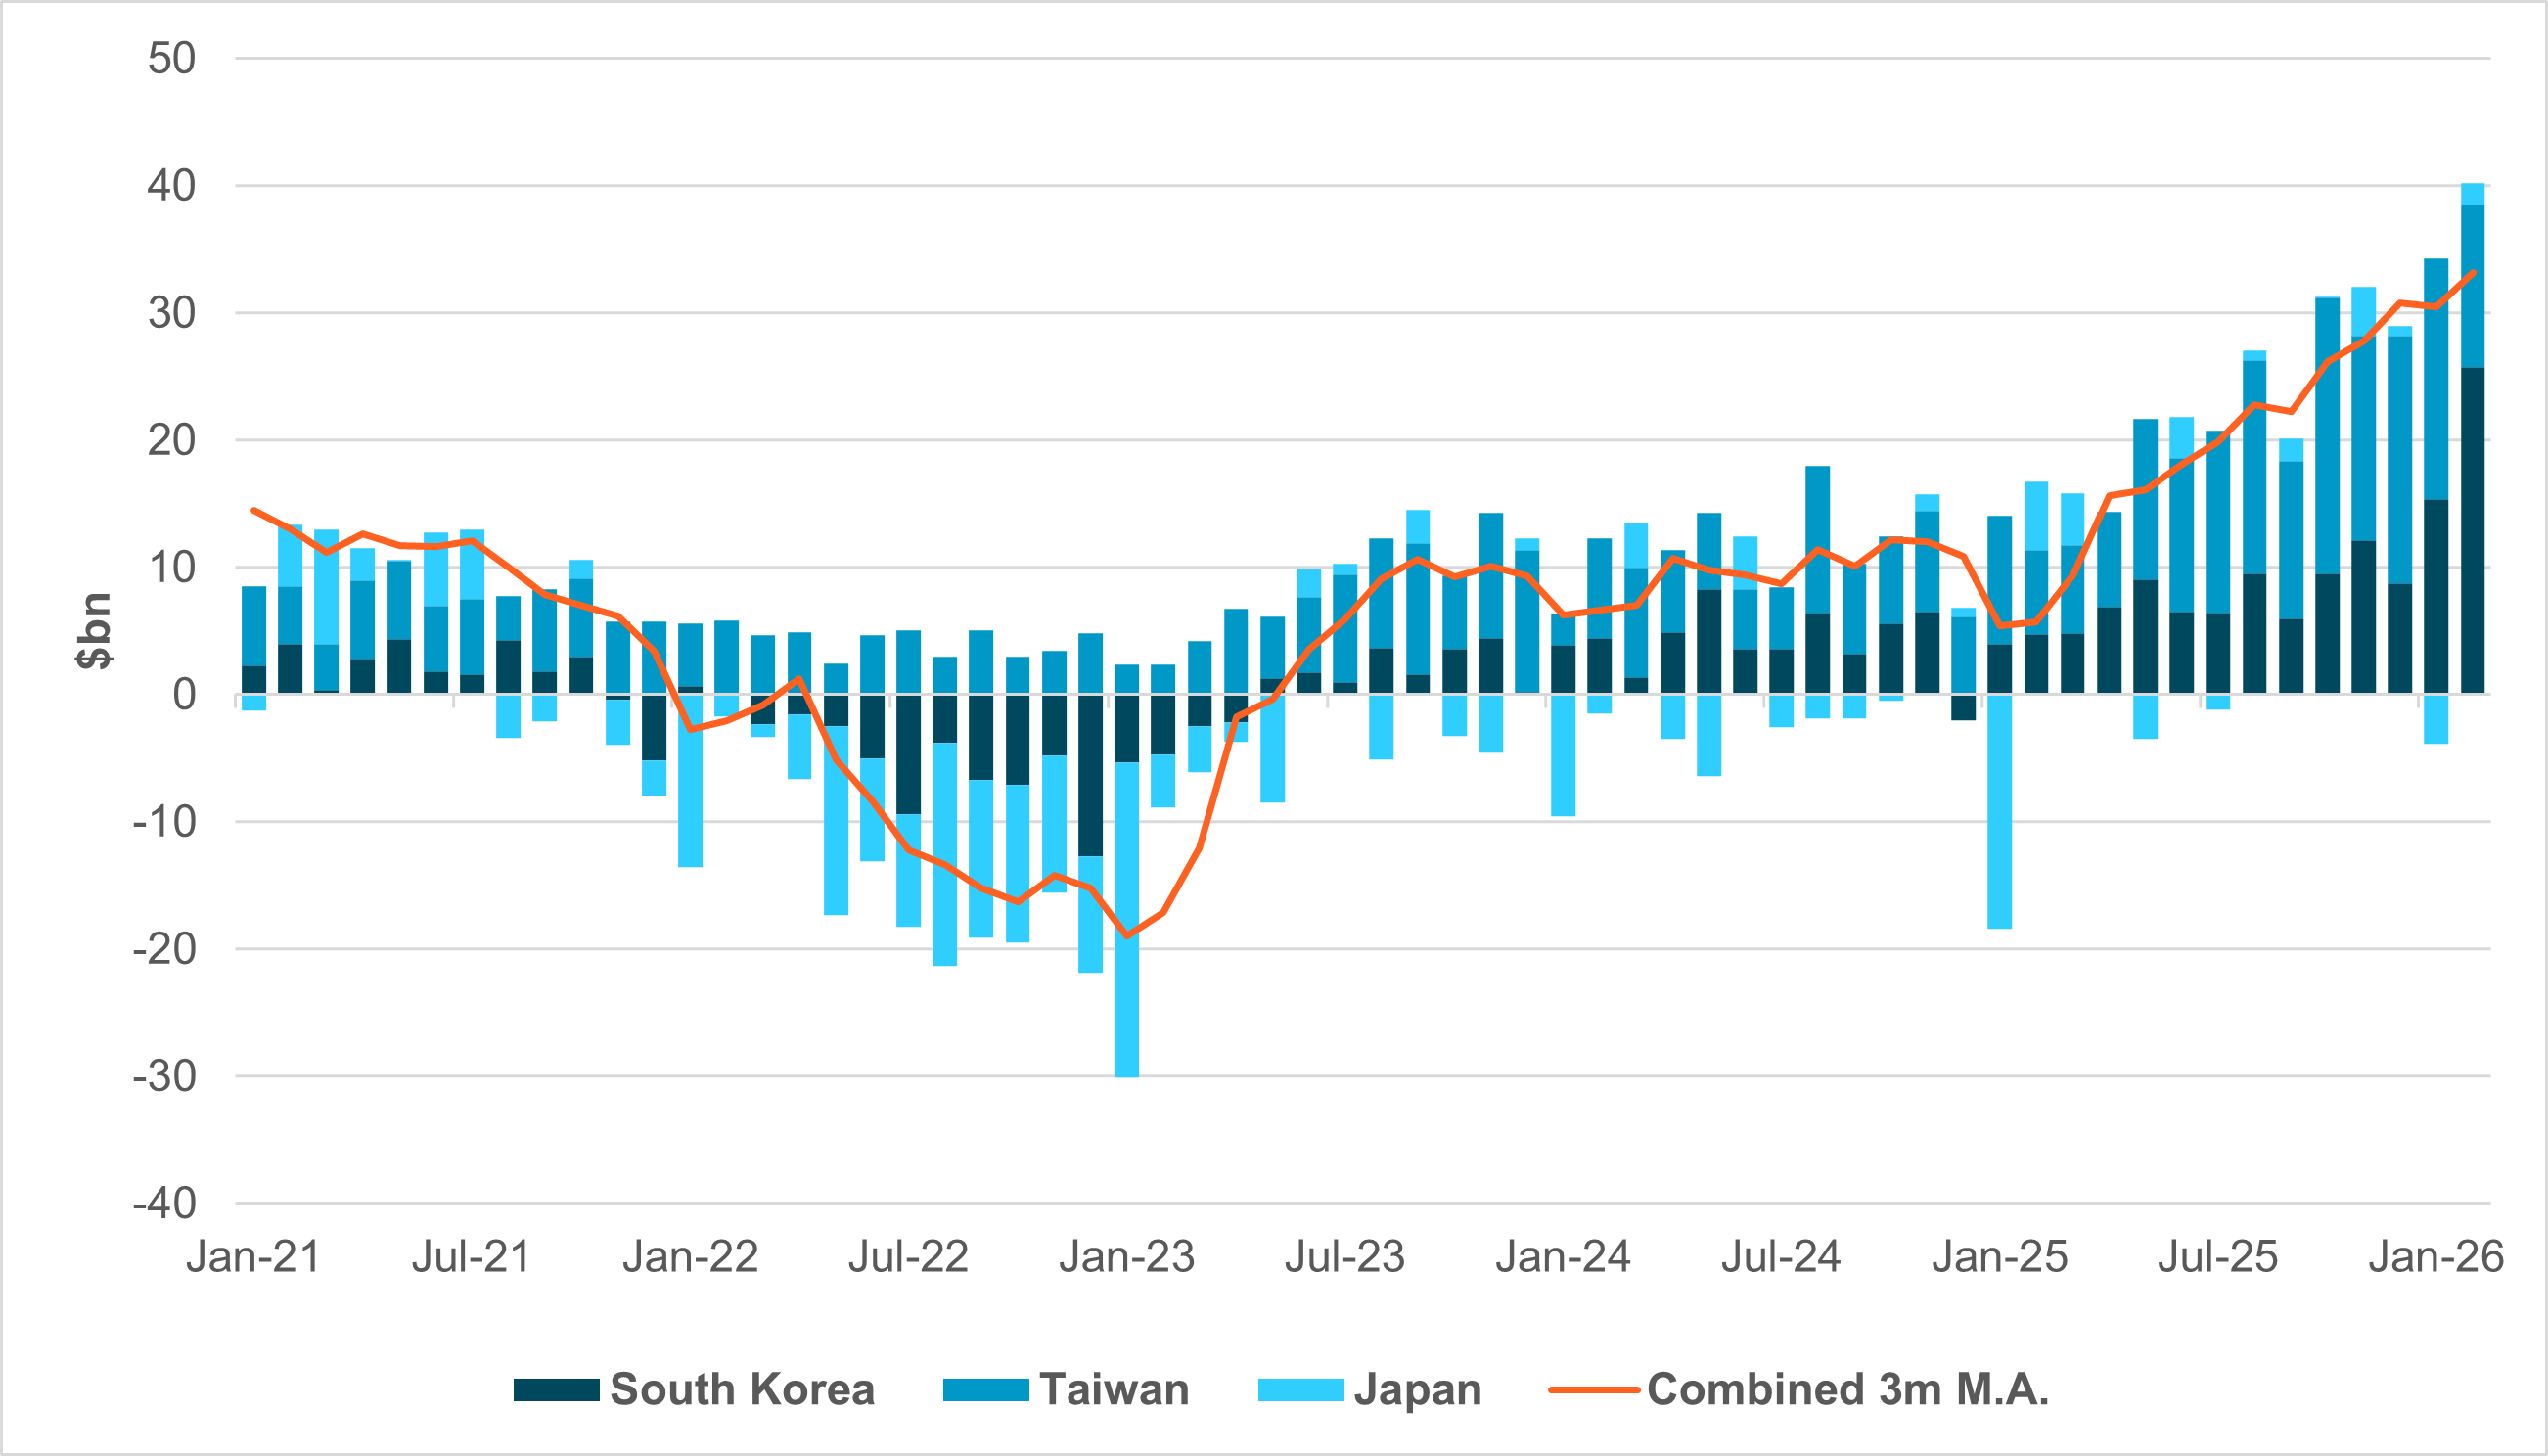
EXHIBIT #1: MONTHLY TRADE BALANCE – SOUTH KOREA, TAIWAN AND JAPAN
Source: BNY, Bloomberg
Our take
The world is reconciling with the view that the current supply shock is likely to extend through much of the year and significant changes to balance of payments should be expected. The outlook has already affected currency valuations, but second-order effects from the global capital recycling of trade surpluses are less clear.
In recent years, the U.S. has been the biggest beneficiary of flows from global trade surpluses seeking to participate in “U.S. exceptionalism.” APAC semiconductor exporters have been among the largest sources of these flows. There is some circularity in place, whereby U.S. technology firms take advantage of easier financial conditions to increase investment, and much of this will be re-directed back to Asia, which produces hardware for its technology stack.
The sharp drop in exports from China to the U.S. (unadjusted for trans-shipments) has increased the share of surpluses generated by Japan, South Korea and Taiwan for the U.S. Against all trading partners, they stood at a combined $40bn in January (Exhibit #1), with the rolling three-month average surplus also hitting $30bn.
Forward Look
The risk is that all of this could now move sharply into reverse. At the recent Bank of Korea (BoK) meeting, Governor Rhee Chang-yong, whose term ends this week, warned that the current shock would be even more severe than in 2022–2023. If this scenario is realized, the capital flow swing due to surpluses shifting into trade deficits across APAC would be material. At the time, the region was exposed to direct Russian energy exports and faced a secondary import shock from rising prices, driven by a post-pandemic demand surge rather than higher input costs.
As Exhibit #1 shows, the shock from the Ukraine conflict extended well into early 2023, with January the worst month. Demand tends to pick up in winter due to heating needs, and policymakers will hope for a resolution before colder months. On a combined basis, the deficit hit $30bn in January 2023, and the three economies faced a combined $60bn deficit on a three-month rolling basis.
Taking Governor Rhee at his word, if the deficit for South Korea and its peers is even worse than 2022, a maximum swing from $40bn in combined surpluses to more than $30bn in combined deficits would represent a single-month drop of $70bn in capital outflows (assuming full recycling). On a three-month rolling basis, the combined swing could reach $150bn (from a $30bn positive three-month average to -$20bn). Considering that the combined surplus drop for China, Taiwan and South Korea for intervention purposes already exceeded $100bn in March alone, a $150bn loss in recycling flow is not unrealistic.
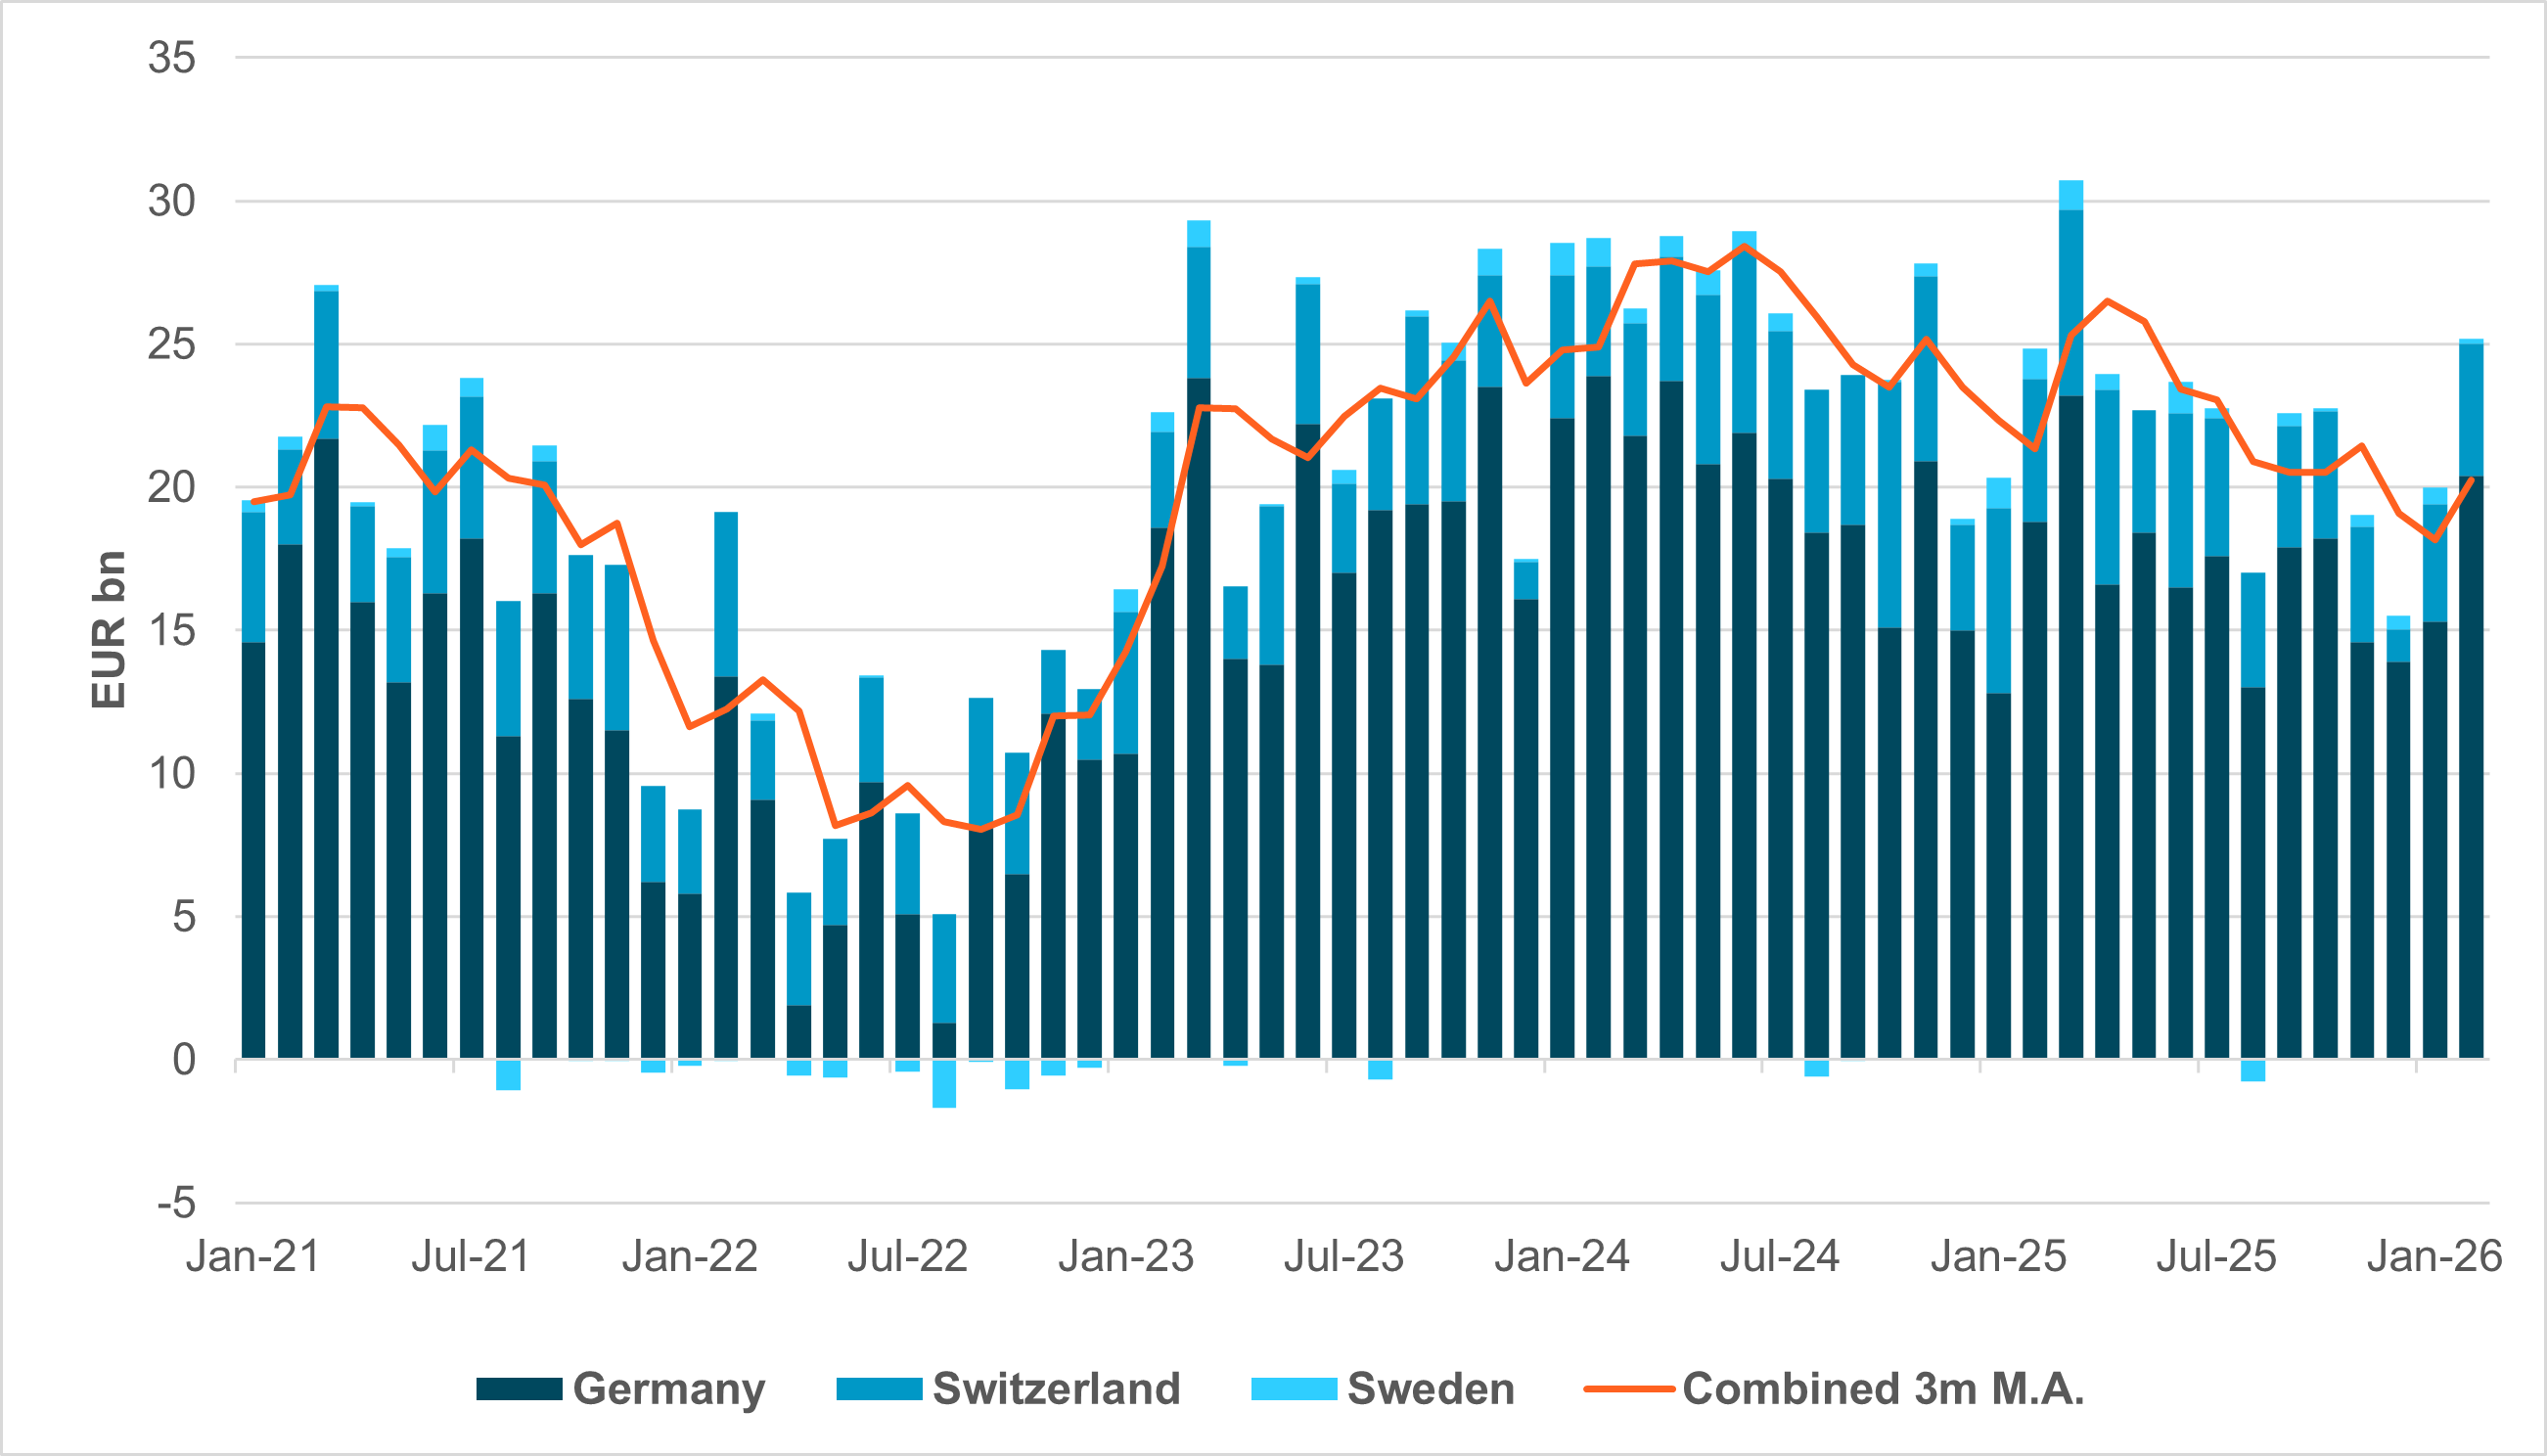
EXHIBIT #2: MONTHLY TRADE BALANCE – GERMANY, SWITZERLAND AND SWEDEN
Source: BNY
Our take
Europe as a source of capital recycling flow should not be dismissed either, given Germany’s manufacturing prowess and consistent surpluses. The EUR’s weakness throughout the conflict suggests markets are already pricing in a repeat of 2022, though for now, the European Commission and national governments do not foresee a more adverse scenario. Central bank officials note that the import excess will not be as severe, given the different point in the cycle.
Furthermore, unlike North Asia (ex-China), the key European exporting bloc of Germany, Switzerland and Sweden never moved into large deficit on an aggregate basis in 2022-2023 (Exhibit #2). Sweden had a few lightly negative months, especially through mid-2022, which was the weakest period for the region that year: the combined trade surplus for the three dropped from a stable €20bn monthly average (three-month average basis) to €10bn.
Forward Look
If Europe faces a shock on par with 2022–2023, then the month swing will be around €10bn per month. However, we believe the long-term trajectory for surpluses and any subsequent capital recycling flows from Europe will be softer. Switzerland’s surpluses could face increasing volatility due to uncertainty over bullion and pharmaceutical exports to the U.S., while German manufacturing exports also face structural decline amid intensive Chinese competition. These factors will have a much larger impact on surpluses, capital recycling and currency valuations over the long term.
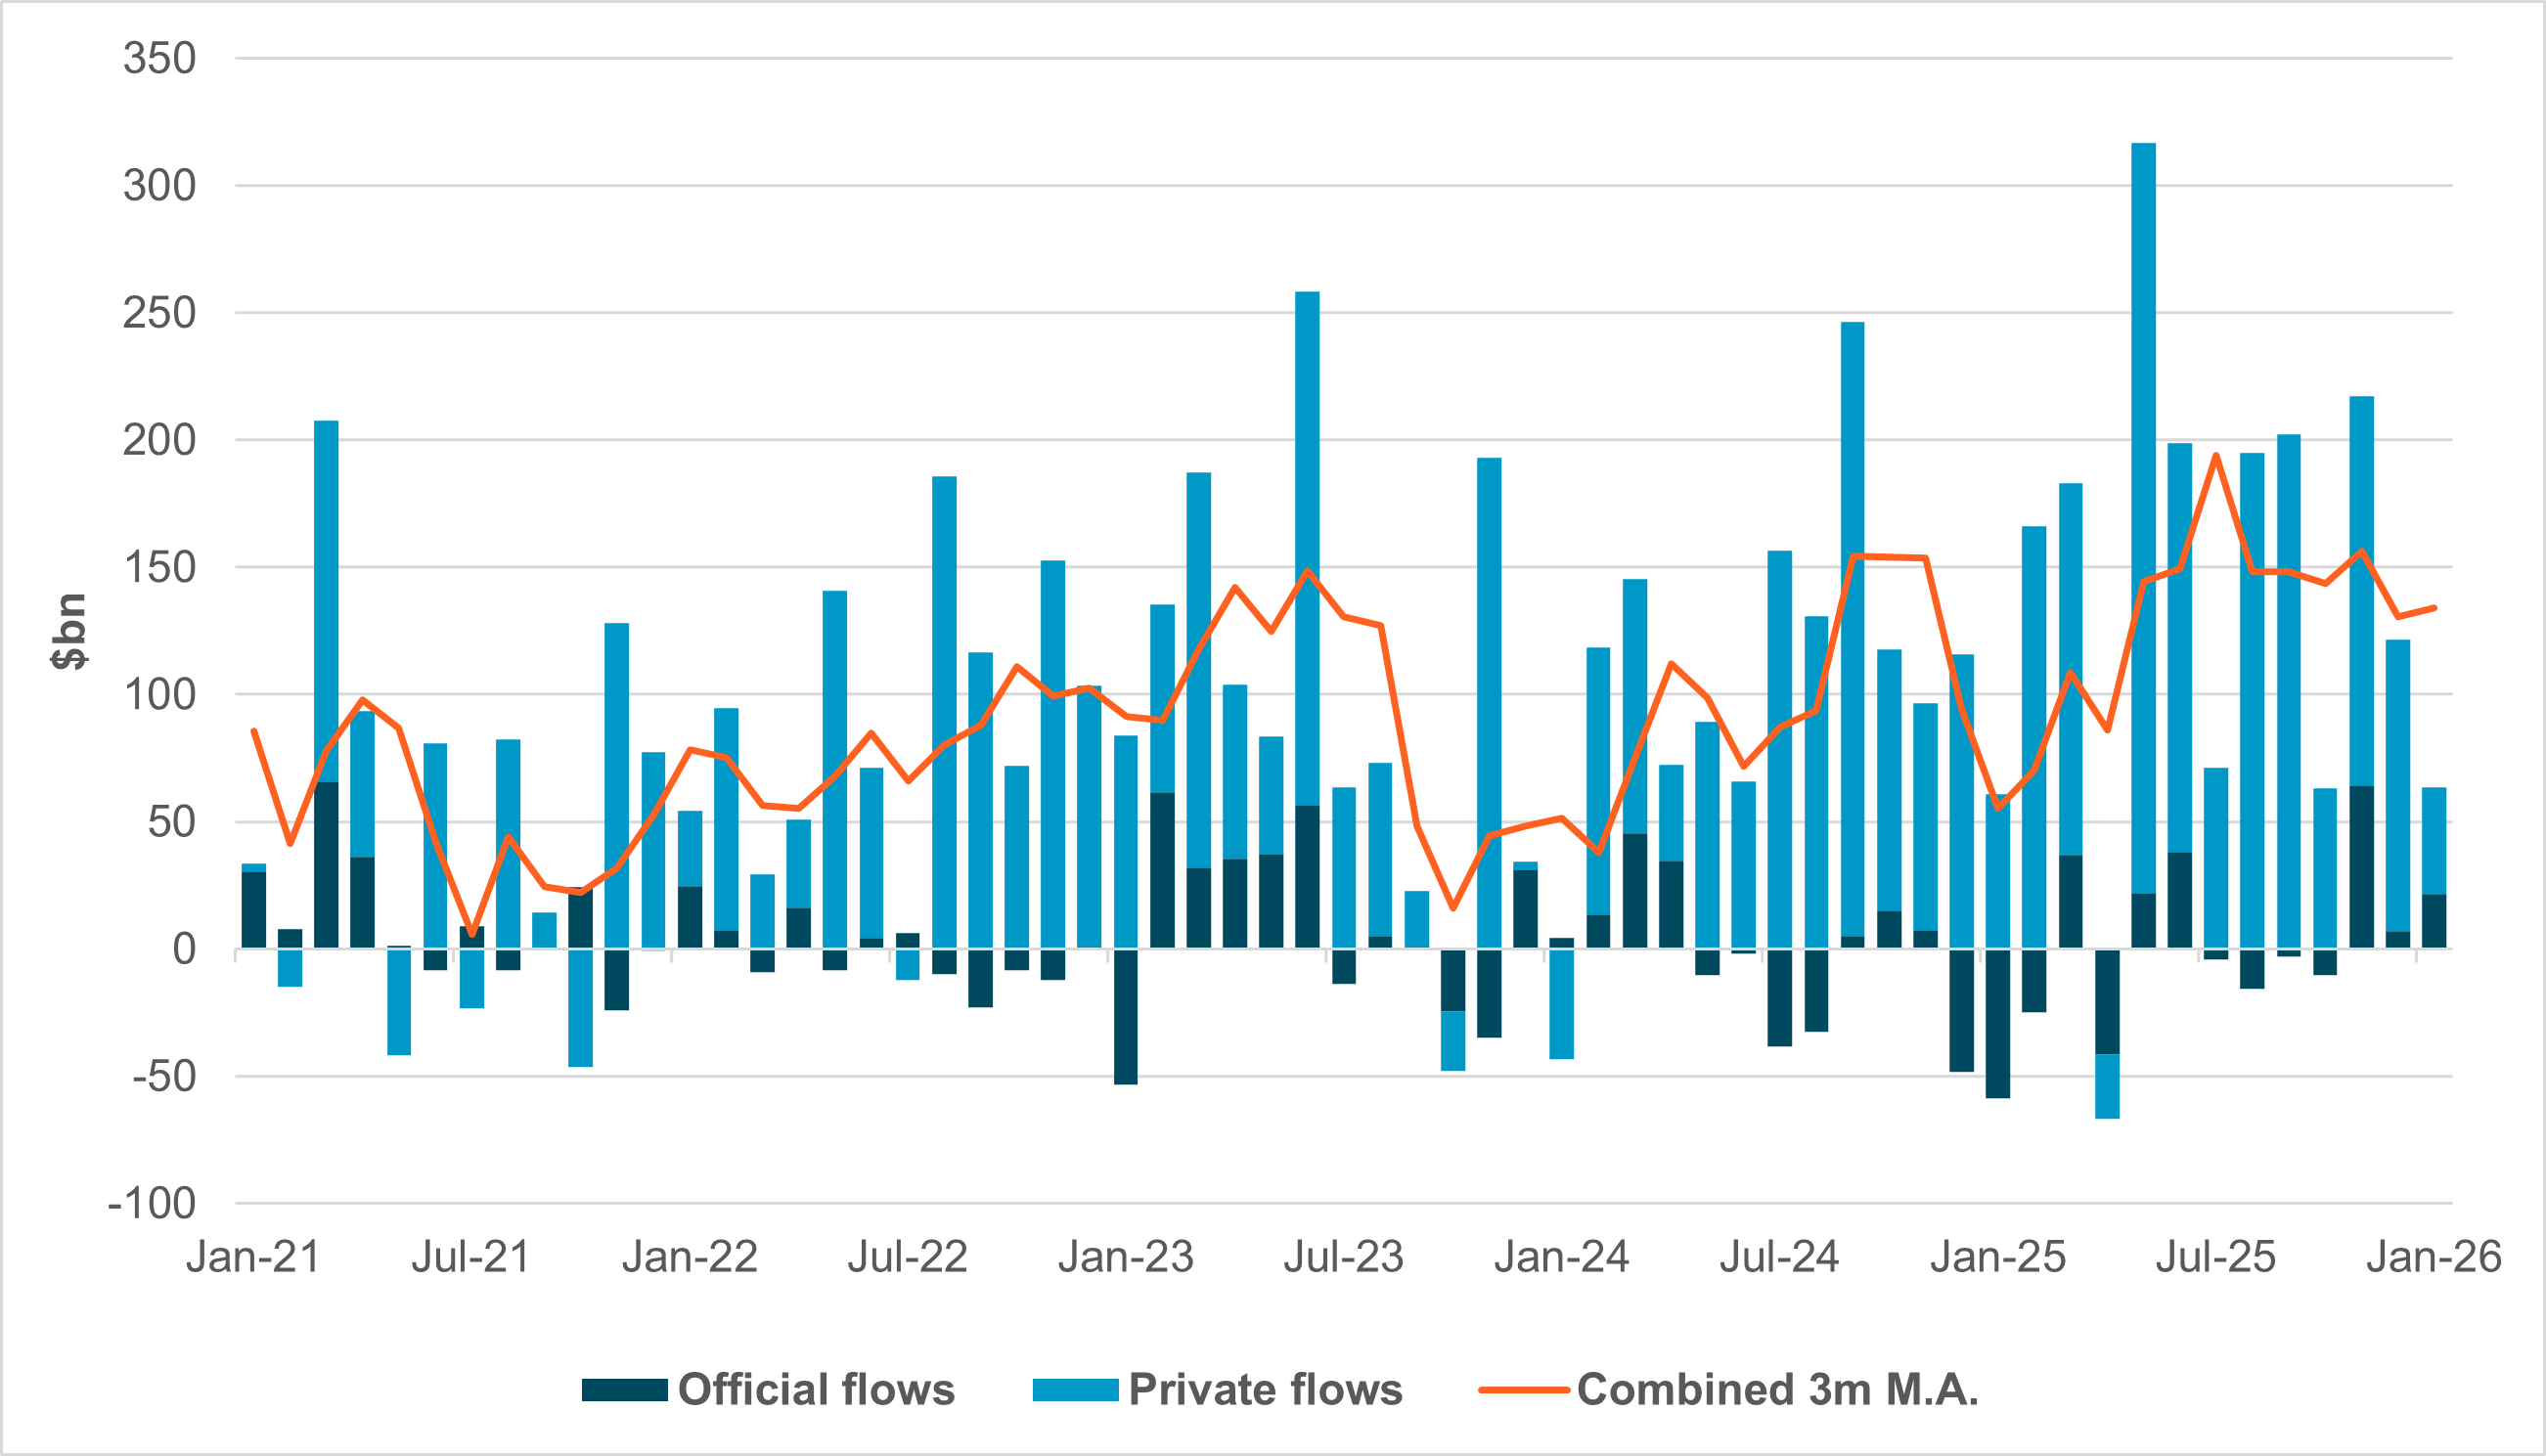
EXHIBIT #3: TREASURY INTERNATIONAL CAPITAL OFFICIAL VS. PRIVATE FLOWS
Source: Bloomberg, BNY
Our take
During rounds of immediate risk-off from a supply shock, reserve managers’ aggressive FX sales may support the dollar due to currency rebalancing. But as dollar-denominated assets such as U.S. Treasurys face swift liquidation, there could be a direct adverse effect on U.S. asset prices. Additional factors – such as tighter financial conditions from higher yields – will also pressure U.S. equity markets, and a prolonged decline in surpluses normally recycled back into the U.S. would compound that challenge.
While liquidity stress was pronounced during the most extreme weeks of the pandemic, based on Treasury International Capital figures, the U.S. did not face massive liquidation flow in 2022 (Exhibit #3). Returns in 2021 were weaker, perhaps because the world was reopening – making risk-reward attractive for portfolio accounts in markets and asset classes seen as benefiting from reopening “earlier” than the U.S. Private flows were consistently strong into the U.S. from 2021 onwards, and the 2022 supply shock – when APAC and European surpluses declined – did not impact capital recycling into the U.S. from external savings. We also note there was a sharp rise in official flows in H1 2023, which matches surge flows from petro-producers at that point. In hindsight, while the quantum of global surpluses remained high, they simply shifted from APAC/Europe to petro-producers – yet flows ended up in the U.S. either way, as its asset markets continued to offer the strongest performance.
The only points of decline were in 2023–2024 as Fed rates peaked.
Forward look
Heading into the current conflict, private flows remained strong, compared to light official flows. There is no clear tariff impact beyond April 2025, and those outflows were easily offset in subsequent months as global investors returned strongly to U.S. equities. In the near term, we expect private sector savings to continue favoring the U.S. This needn’t come at the expense of energy-resilient markets such as China. However, one constraint could derail the base case of tech/AI-led U.S. outperformance case – an acute shortage of specific goods required for semiconductor production, driven by supply-chain and logistics disruptions. If realized, the dollar could face significant pressure as private capital inflows ease, with no offsetting official flows while trade surpluses remain subdued.