Supply Shocks and Chips
iFlow > Equities
An in-depth look each Friday at the factors shaping equities markets in developed and emerging economies around the world.
iFlow > Equities
An in-depth look each Friday at the factors shaping equities markets in developed and emerging economies around the world.

Bob Savage
Time to Read: 5 minutes
Technology’s leadership in global equities is difficult to ignore. In nine weeks of S&P 500 gains, just ten companies have led the move, with only 28% outperforming the index. The rally’s breadth is historically narrow – in the first percentile over the last 30 years. The AI investment theme, combined with the war-related energy push, has lifted equities to record highs in May.
The semiconductor shortage predates the Strait of Hormuz oil crisis and seems likely to outlast it. The supply crisis is most acute downstream: advanced packaging constraints, a lack of high-end testing solutions, and HBM (high bandwidth memory) integration issues. This bottleneck reflects AI’s inelastic demand – supply can’t respond fast enough regardless of price. Midstream wafer fabrication is a factor in the supply shock, though less so than in the Covid-linked crisis of 2021–2022. Upstream semiconductor supply issues are linked to materials – specialty gases, helium and rare-earths like gallium and germanium. The war has compounded those concerns alongside ongoing AI demand. Long lead times for lithography machines complicate the supply, with legacy effects still running through autos and industrial sectors. Markets are once again testing the old rule that the solution to high prices is even higher ones.
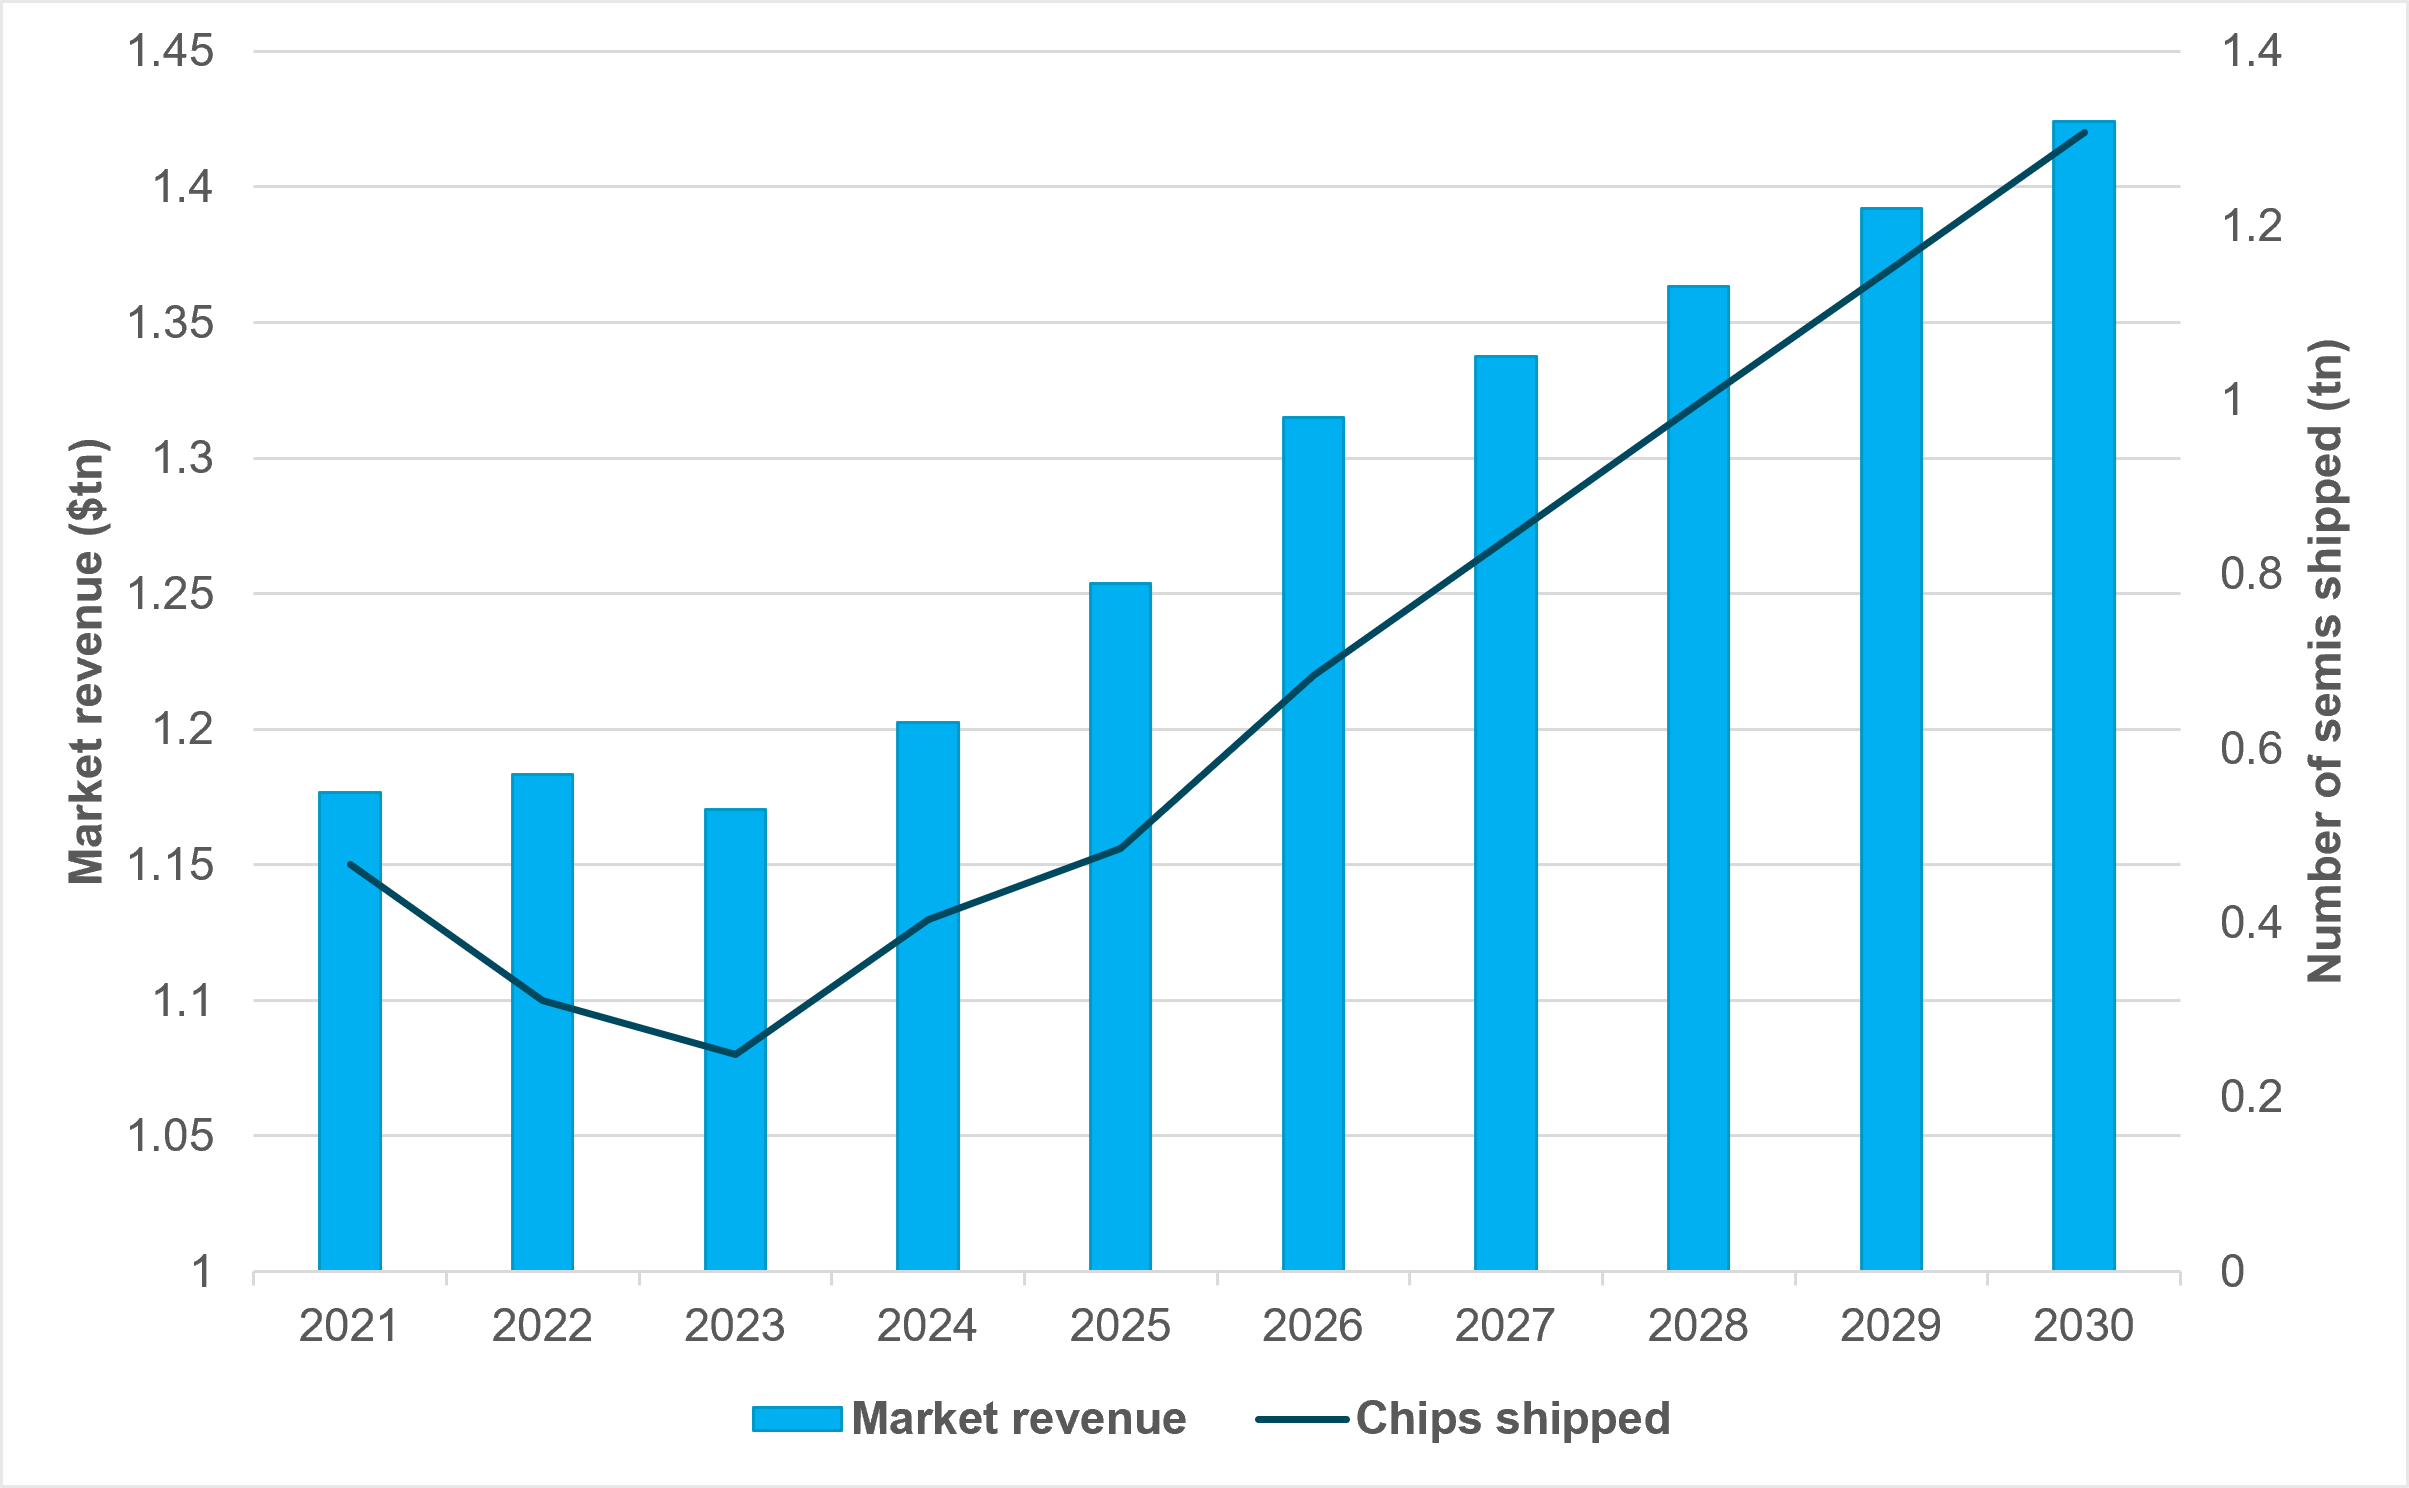
EXHIBIT #1: SEMICONDUCTORS SHIPPED ANNUALLY VS. MARKET REVENUE
Source: BNY, WSTS, Bloomberg
Our take
The semiconductor industry is in an unprecedented growth phase. In terms of overall units and market valuation, demand is projected to grow significantly over the next few years. The supply of chips isn’t expected to match the revenue trend until 2030. This suggests a longer runway for investment returns and growth in semiconductor manufacturing for the next five years. AI is the key driver: data center and memory demand are lifting selling prices faster than unit growth. Hyperscaler buildouts are driving demand now, but as AI adoption broadens, it will flow through to PCs and smart appliances. The next wave comes from the automotive sector and internet of things (IoT).
Forward look
The central question for chip demand is in the transition from centralized AI data centers to a more edge AI approach. Smartphones and PCs will turn over their device cycles requiring new specialized neural processing units (NPUs) for AI applications. The same transition extends to IoT – autonomous EVs are estimated to use around 2,000 chips each, while traditional internal combustion vehicles use 300–500 chips. Automotive chip demand alone is growing at a CAGR of 10.5%. Demand looks set to outstrip supply for some time to come.
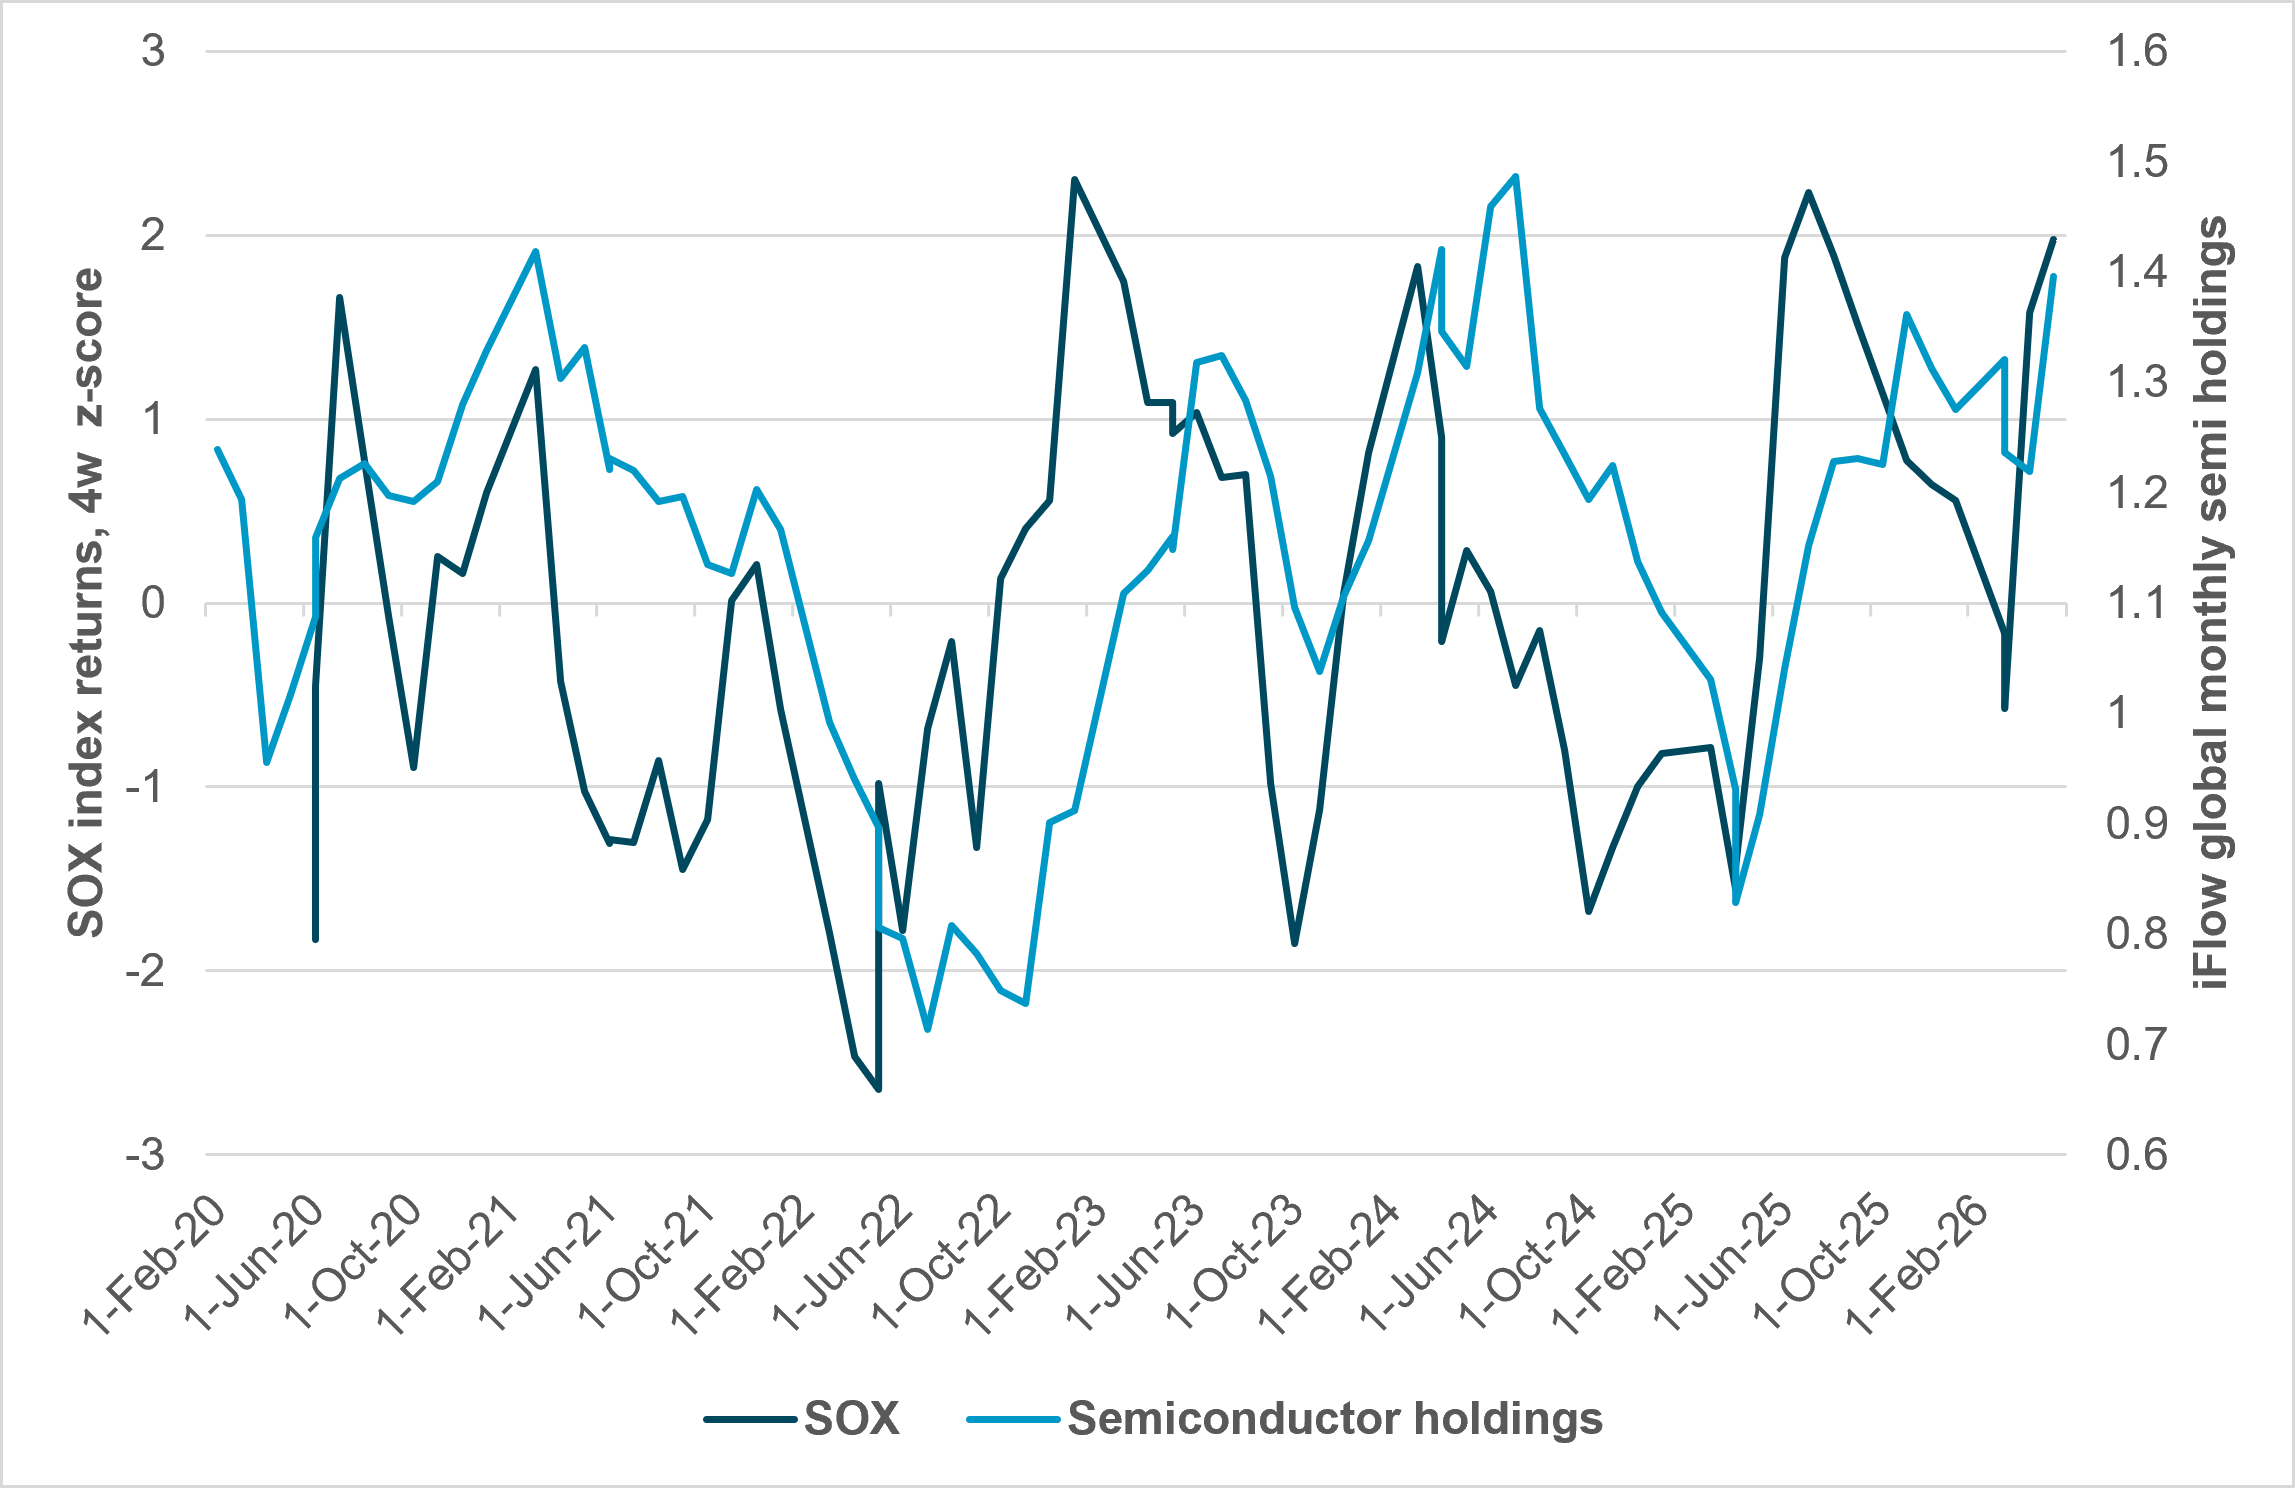
EXHIBIT #2: SOX VS. IFLOW GLOBAL EQUITY HOLDINGS OF SEMICONDUCTOR COMPANIES
Source: BNY, Bloomberg
Our take
Semiconductor holdings and performance are moving together, but investors haven’t fully reloaded yet. The chip cycle has seen two notable drawdowns – the 2022 inflation-driven selloff and the 2025 disruption from tariffs and trade fragmentation. iFlow data show holdings haven’t returned to their historic highs from 2024 despite continued margin expansion.
Forward look
The chip cycle still has room to run. Operating margins for the five biggest semiconductor companies tell the story of the chip cycle better than demand figures alone.
EXHIBIT #3: OPERATING MARGINS FOR KEY SEMICONDUCTOR COMPANIES
Source: BNY, Bloomberg
Our take
Four of the five in this group are now in the $1tn market cap club, and their May performance reflects it. The Q1 earnings reports have justified much of the optimism. The five-year assumptions will be critical in any valuation modeling.
Forward look
The last five years have been a sea change in how semiconductors underpin the global supply chain. AI demand has pushed the industry’s role into high gear. Estimates show leading-edge 300mm wafer processing capacity must nearly triple, from about 5.1mn wafer equivalents per year to 13.7mn. This requirement fuels the current frantic push for global “megafab” construction (such as TSMC in Arizona and Intel in Ohio). To hit these five-year volume targets, global wafer manufacturing capacity must expand dramatically.
The semiconductor supply chain spans multiple specialized stages, each concentrated in different parts of the world.
Several cost drivers will determine future margin direction for the industry. Many of these have less to do with materials and more to do with design.
For equity markets, the key implication is that semiconductor earnings may remain structurally stronger than previous cycles despite elevated valuations. Margin expansion among leading memory and foundry companies suggests that investors are increasingly rewarding technology leadership, advanced manufacturing capability, and supply-chain control rather than pure unit growth. While volatility tied to geopolitics, tariffs, and trade fragmentation will remain significant, the secular demand backdrop for semiconductors appears durable and increasingly embedded across multiple sectors of the global economy.