Price Over Payouts in 2026
iFlow > Equities
An in-depth look each Friday at the factors shaping equities markets in developed and emerging economies around the world.
iFlow > Equities
An in-depth look each Friday at the factors shaping equities markets in developed and emerging economies around the world.

Bob Savage
Time to Read: 4 minutes
The recession fears that dominated last year have given way to a broad consensus of economic resilience. Expectations for a soft landing in 2026 – anchored by roughly 2% U.S. growth and near-3% global growth – remain intact, supported by ongoing fiscal stimulus, accelerating AI-driven productivity gains, and the prospect of Federal Reserve easing. The challenge for equity investors is the increasingly K-shaped nature of growth into the second half of 2025, which complicates labor-market dynamics and heightens liquidity pressures for both households and corporations.
An additional structural risk is the shift in retirement savings behavior, as baby boomers transition from contributing to drawing down 401(k) balances – reducing passive inflows and tying equity demand more directly to labor-force participation among workers aged 55 and older. Meanwhile, elevated valuations and a shifting global rate cycle are reinforcing the importance of rotation strategies for 2026, as investors weigh the relative return trade-offs between dividends and buybacks.
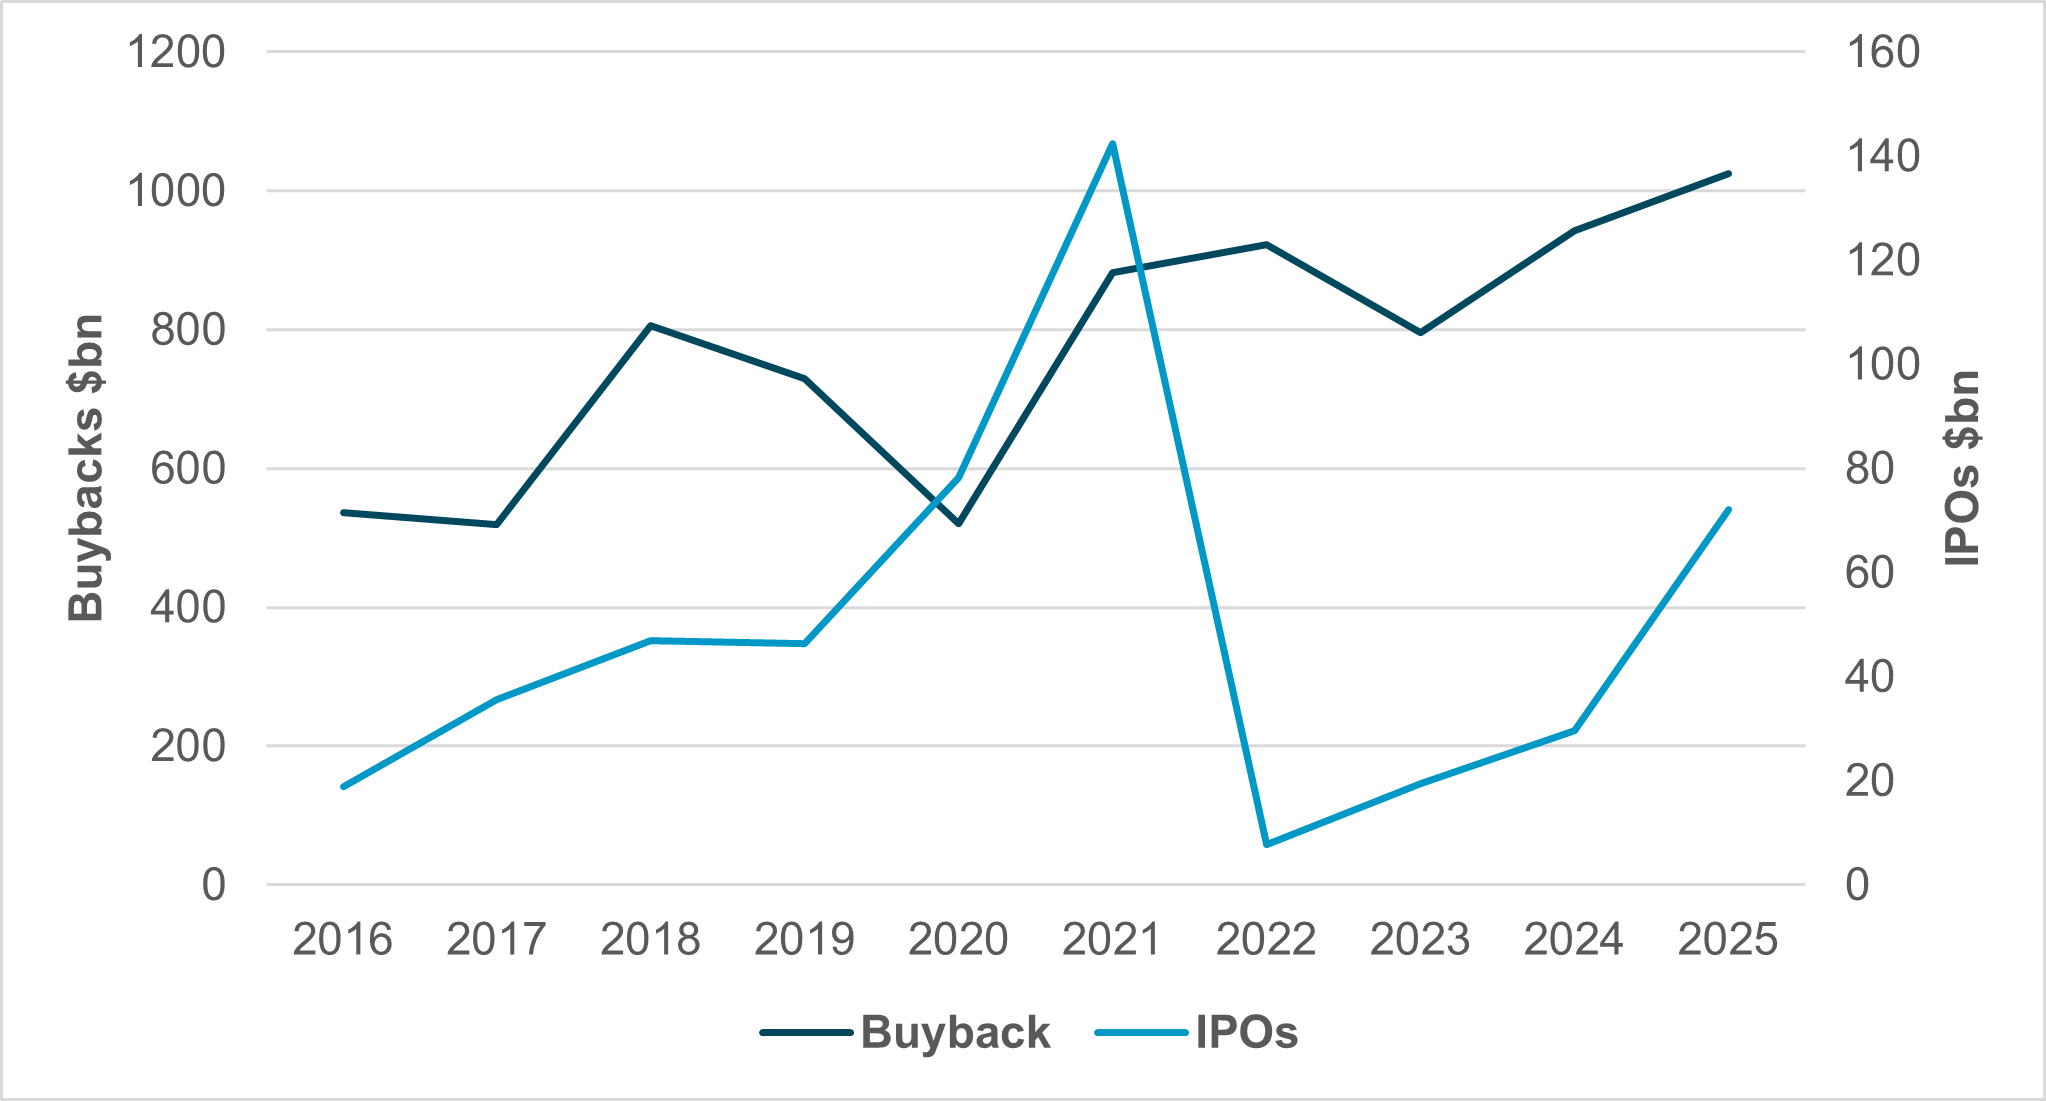
EXHIBIT #1: SHARE BUYBACKS HAVE DWARFED INITIAL PUBLIC OFFERINGS
Source: BNY, Bloomberg, SEC
Our take
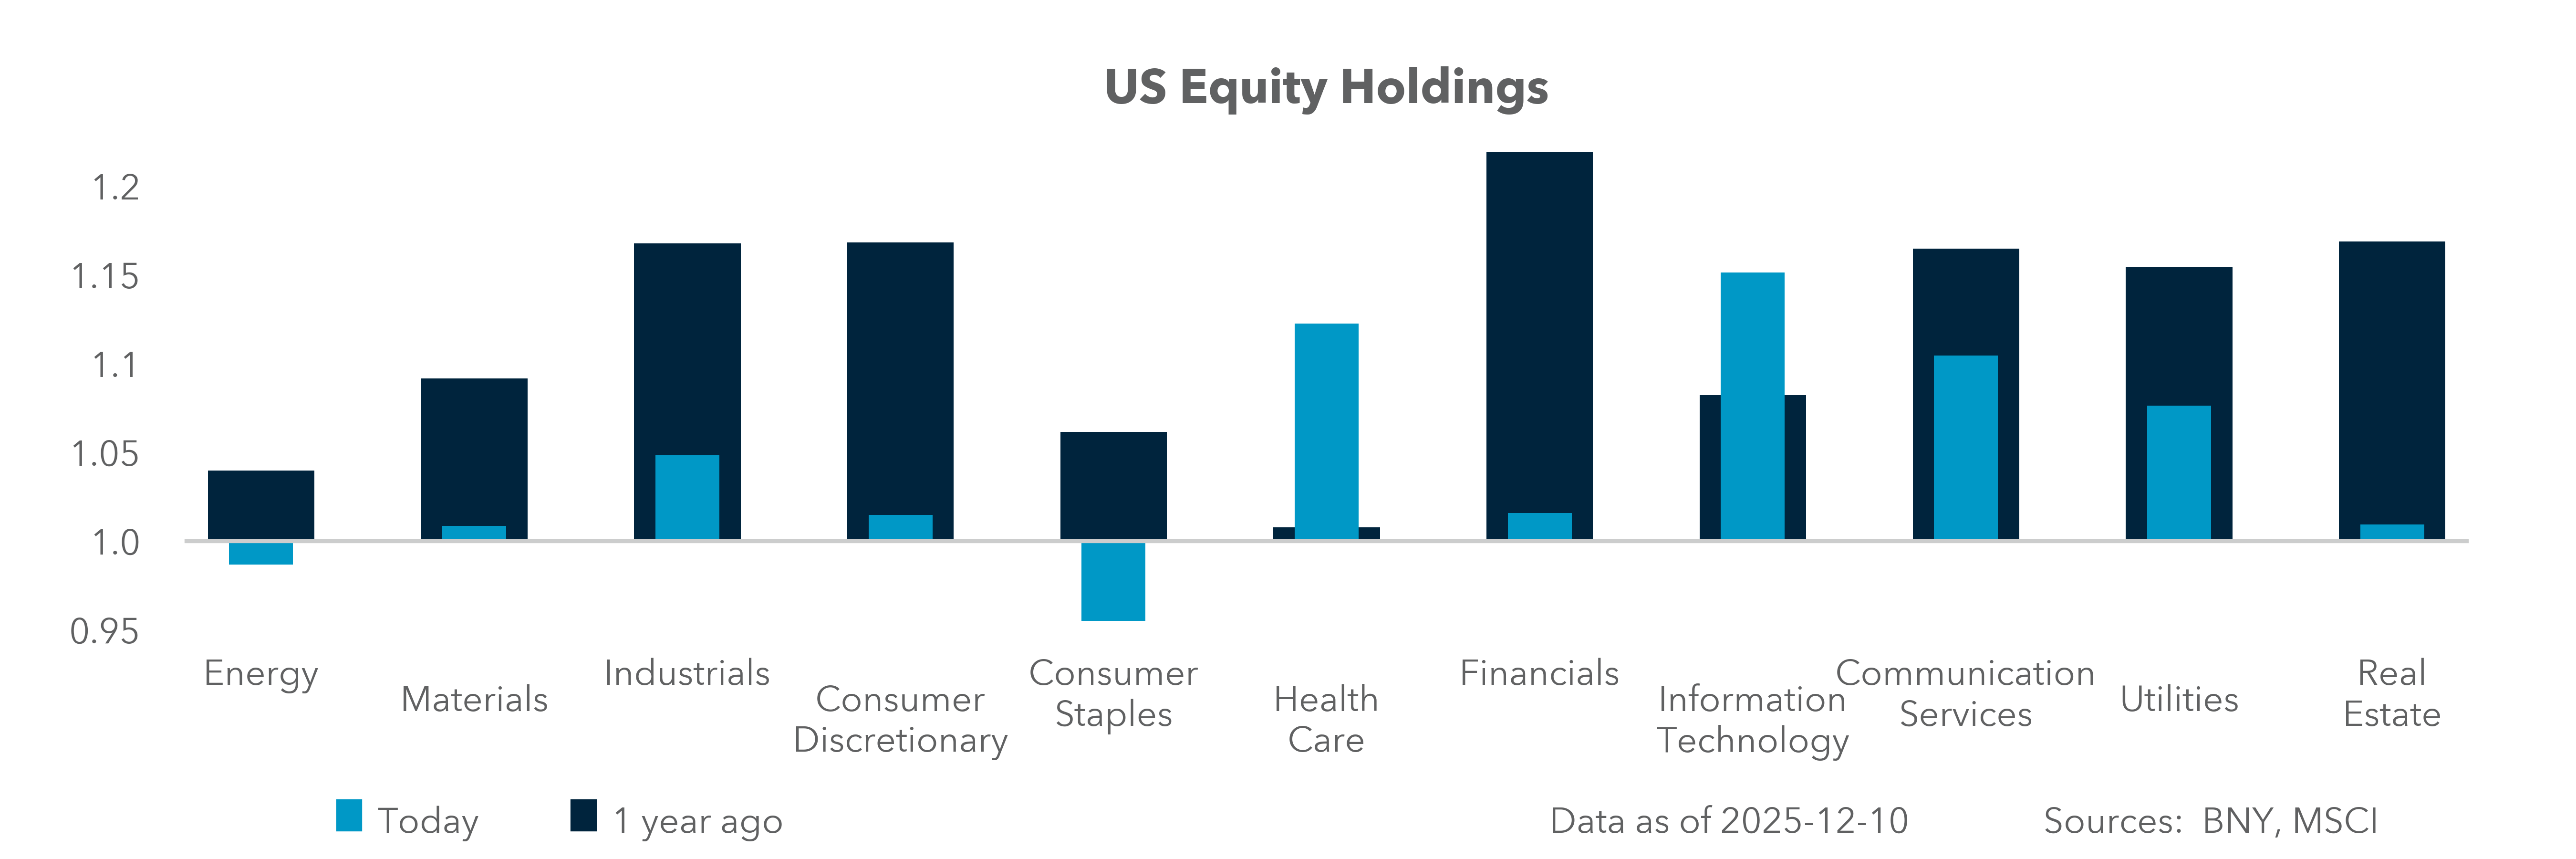
Over the last 10 years, U.S. share buybacks dwarfed IPOs, and in 2025, they will exceed $1tn. Negative net equity supply has changed how valuation metrics work. This persistent supply contraction has supported valuations, buyback-yield factor performance, index-level EPS growth, and contributed to U.S. equity market resilience even amid rate volatility. The size of the buybacks matters, with over $6tn in the last 10 years, half the $13tn in U.S. retirement savings. Buybacks show up in iFlow data as net positive flows in Technology, Communications and Health Care – all overheld – while high-dividend proxies such as Energy, Financials and Real Estate are underheld.
Forward look
The key sensitivity for buybacks comes from the cost of capital and corporate free cash flow. If those tighten, buybacks slow materially, as seen during each recession, most recently in the COVID-19 period. Concerns about 2026 are heightened by expectations that mergers will increase, given the last cycle’s pressures on companies and private credit. More IPOs will add to equity supply, likely slowing the pace of future equity gains, as supply and demand converge on a lower equilibrium price over time. Sectors likely to see M&A in 2026 include Energy (oil and gas), Health Care (Biotech and Pharma), and Information Technology (software and digital infrastructure). All three are in favor for increased mergers, but IT and Health Care are overheld by 10% relative to their long-term average.
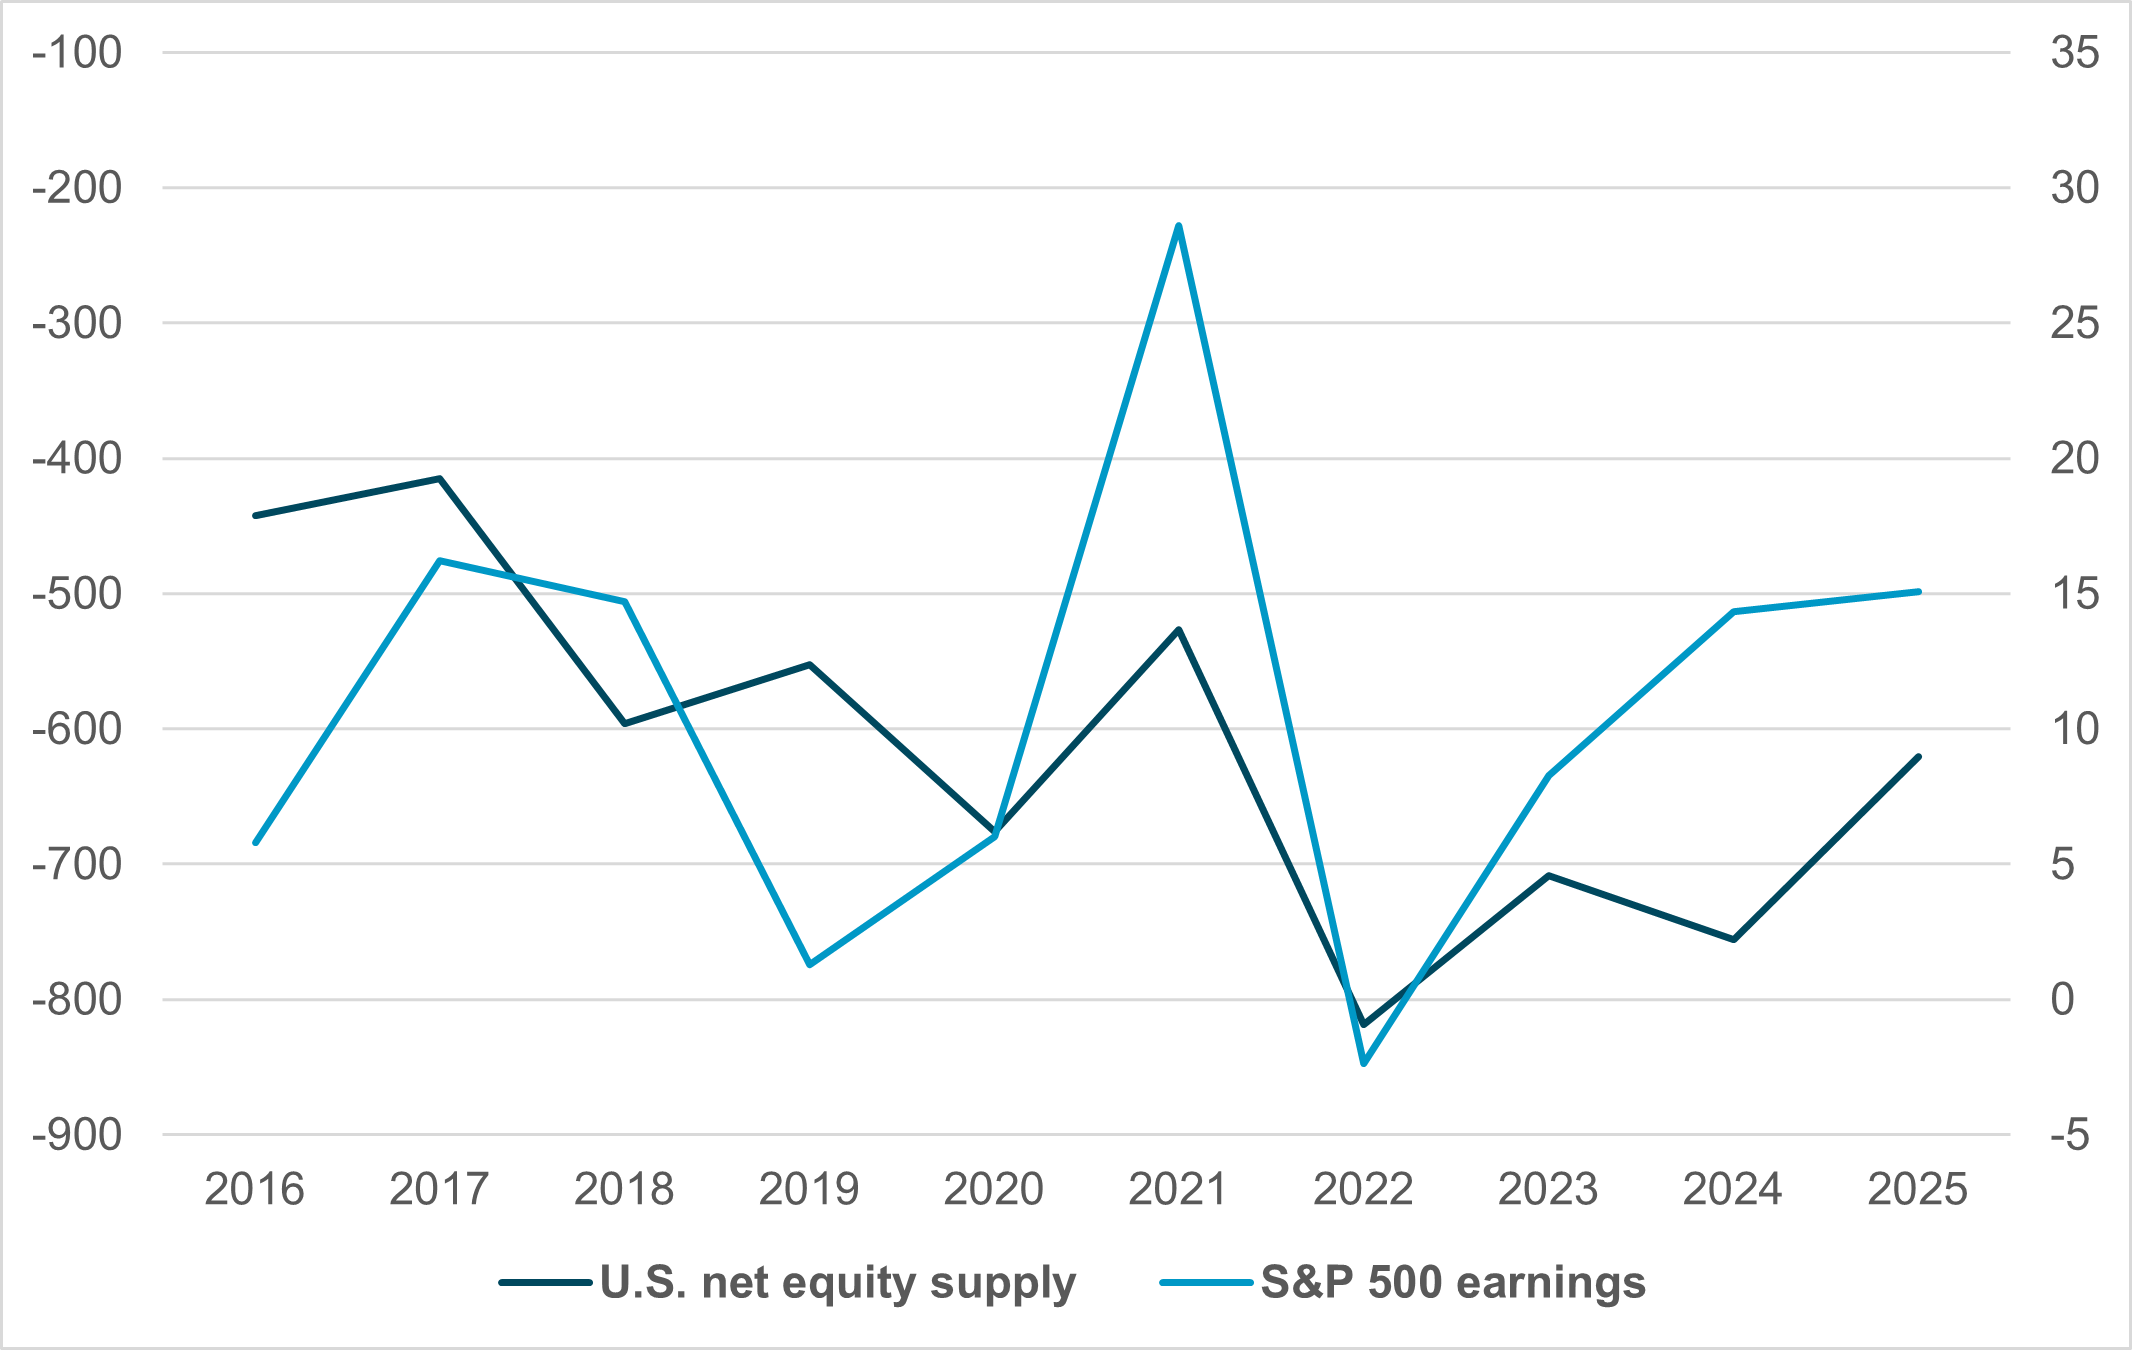
EXHIBIT #2: AN UNEVEN RELATIONSHIP BETWEEN EQUITY SUPPLY AND EARNINGS
Source: BNY, St. Louis Federal Reserve
Our take
The decline in equity share supply alongside rising S&P 500 earnings has mattered since 2022, but logically, the causality should run in reverse. Buybacks return capital to investors, and higher earnings typically enable more buybacks, though this relationship has been inconsistent. It depends on cash, capex and outlook certainty. Excess earnings from COVID-19-driven government stimulus pushed rates higher and made equity financing more attractive.
That spike was short-lived. By 2025, earnings returned to levels last seen in 2017 and the first Trump administration, with 2026 resembling the risk landscape of 2018 and 2019.
Forward look
Higher earnings and increased equity supply both depend on elevated equity prices to be sustained. For earnings to lead equity returns, modest volatility is also needed to justify higher valuations. Growth expectations in iFlow for 2026 are at odds with the overall mood for risk. Defensive positioning, rather than aggressive recovery, is priced into the U.S. sectors. Resolving this anomaly may prompt sharper rotation.
A resolution could come through lower interest rates or improved profit margins. Both factors are in play as 2026 begins, with AI investments banking on improved productivity and the Fed maintaining an easing bias, with terminal rates near 3%. The ability of earnings to continue exceeding expectations remains the key driver of 2026 equity returns.
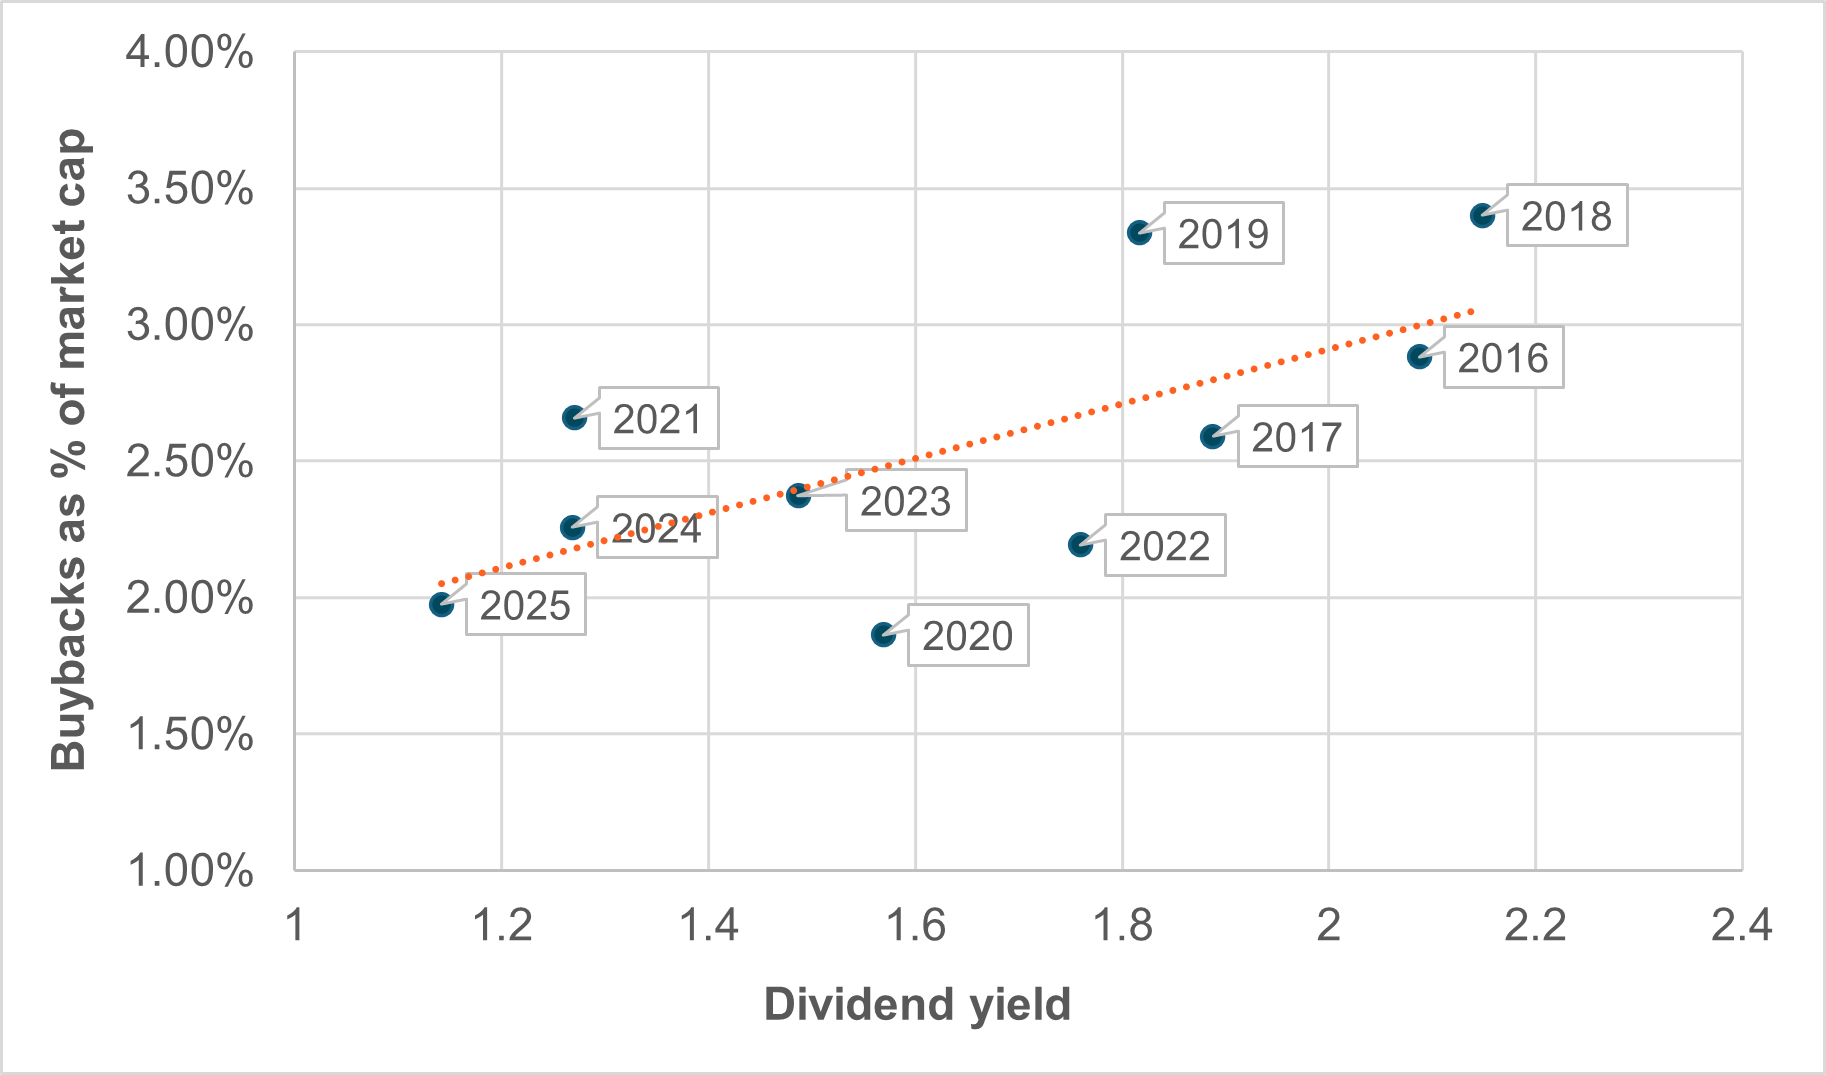
EXHIBIT #3: WHAT IMPACT WILL EASING HAVE ON BUYBACKS AND DIVIDENDS?
Source: BNY, Bloomberg
Our take
Historically, the S&P 500 tends to bottom after the Fed’s third rate cut, with 75 bp of easing typically sufficient to stabilize growth – a pattern seen since 1998. The policy trajectory for 2026 will be pivotal. Past easing cycles in 2019 and 2021 coincided with stronger buybacks and above-trend equity yields, while weaker growth periods like 2020 and 2022 saw declining returns and softer capital flows. Inflation is the chief risk to the 2026 consensus view. Expanded fiscal support, when combined with Fed easing, raises the probability that price pressures will reaccelerate, complicating both real growth and capital-return outlooks.
Forward look
Over the long term, S&P 500 dividend yields have averaged roughly 3% – 4.2% from 1970 to 1990 and 2% from 2009 to 2019 – making today’s 1.15% yield historically low. This implies muted baseline return potential, shifting 2026 performance reliance toward price appreciation rather than dividends or buybacks – essentially requiring FOMO-driven market participation to deliver the consensus 5–10% gains. Valuation models anchored in P/E or similar metrics suggest returns closer to 5% or below, while the upside scenario hinges on a late cycle “blowoff” led by IT and AI investment, reminiscent of 1999’s parabolic dynamics.
The risk, however, is growing concentration: the Magnificent Seven now represent 23% of global equity market cap, and AI-linked flows remain circular – running from investors into hyperscalers and chipmakers and then back into index weightings. This concentration, together with narrow market leadership, forms the core of a potential bubble that concerns investors, even if few expect an imminent unwind.
Equity market performance in 2026 will hinge on whether robust earnings, resilient buyback capacity, and an accommodating Fed can offset rising equity supply from IPOs and M&A, especially in an uneven, K-shaped economy. Sectors facing merger waves – Energy, Health Care and IT – may come under valuation pressure where positioning is already crowded, while earnings durability becomes the key determinant of index-level upside.
The balance between passive and active investment flows – both shaped by demographic constraints – will also come into focus in 2026. With dividend yields historically low and buyback activity sensitive to tighter financial conditions, price momentum rather than payout support will drive returns.
This sets the stage for a narrow but powerful upside skew – one that depends on falling rates, improving margins and ongoing AI-related productivity gains to sustain the optimism embedded in current valuations. The timing of any potential spike or bubble will shape how other factors, such as politics and monetary policy, play out in the year ahead.