Premature to Declare the Existence of a 'Sell America' Trade
Special Report

John Velis
Time to Read: 5 minutes
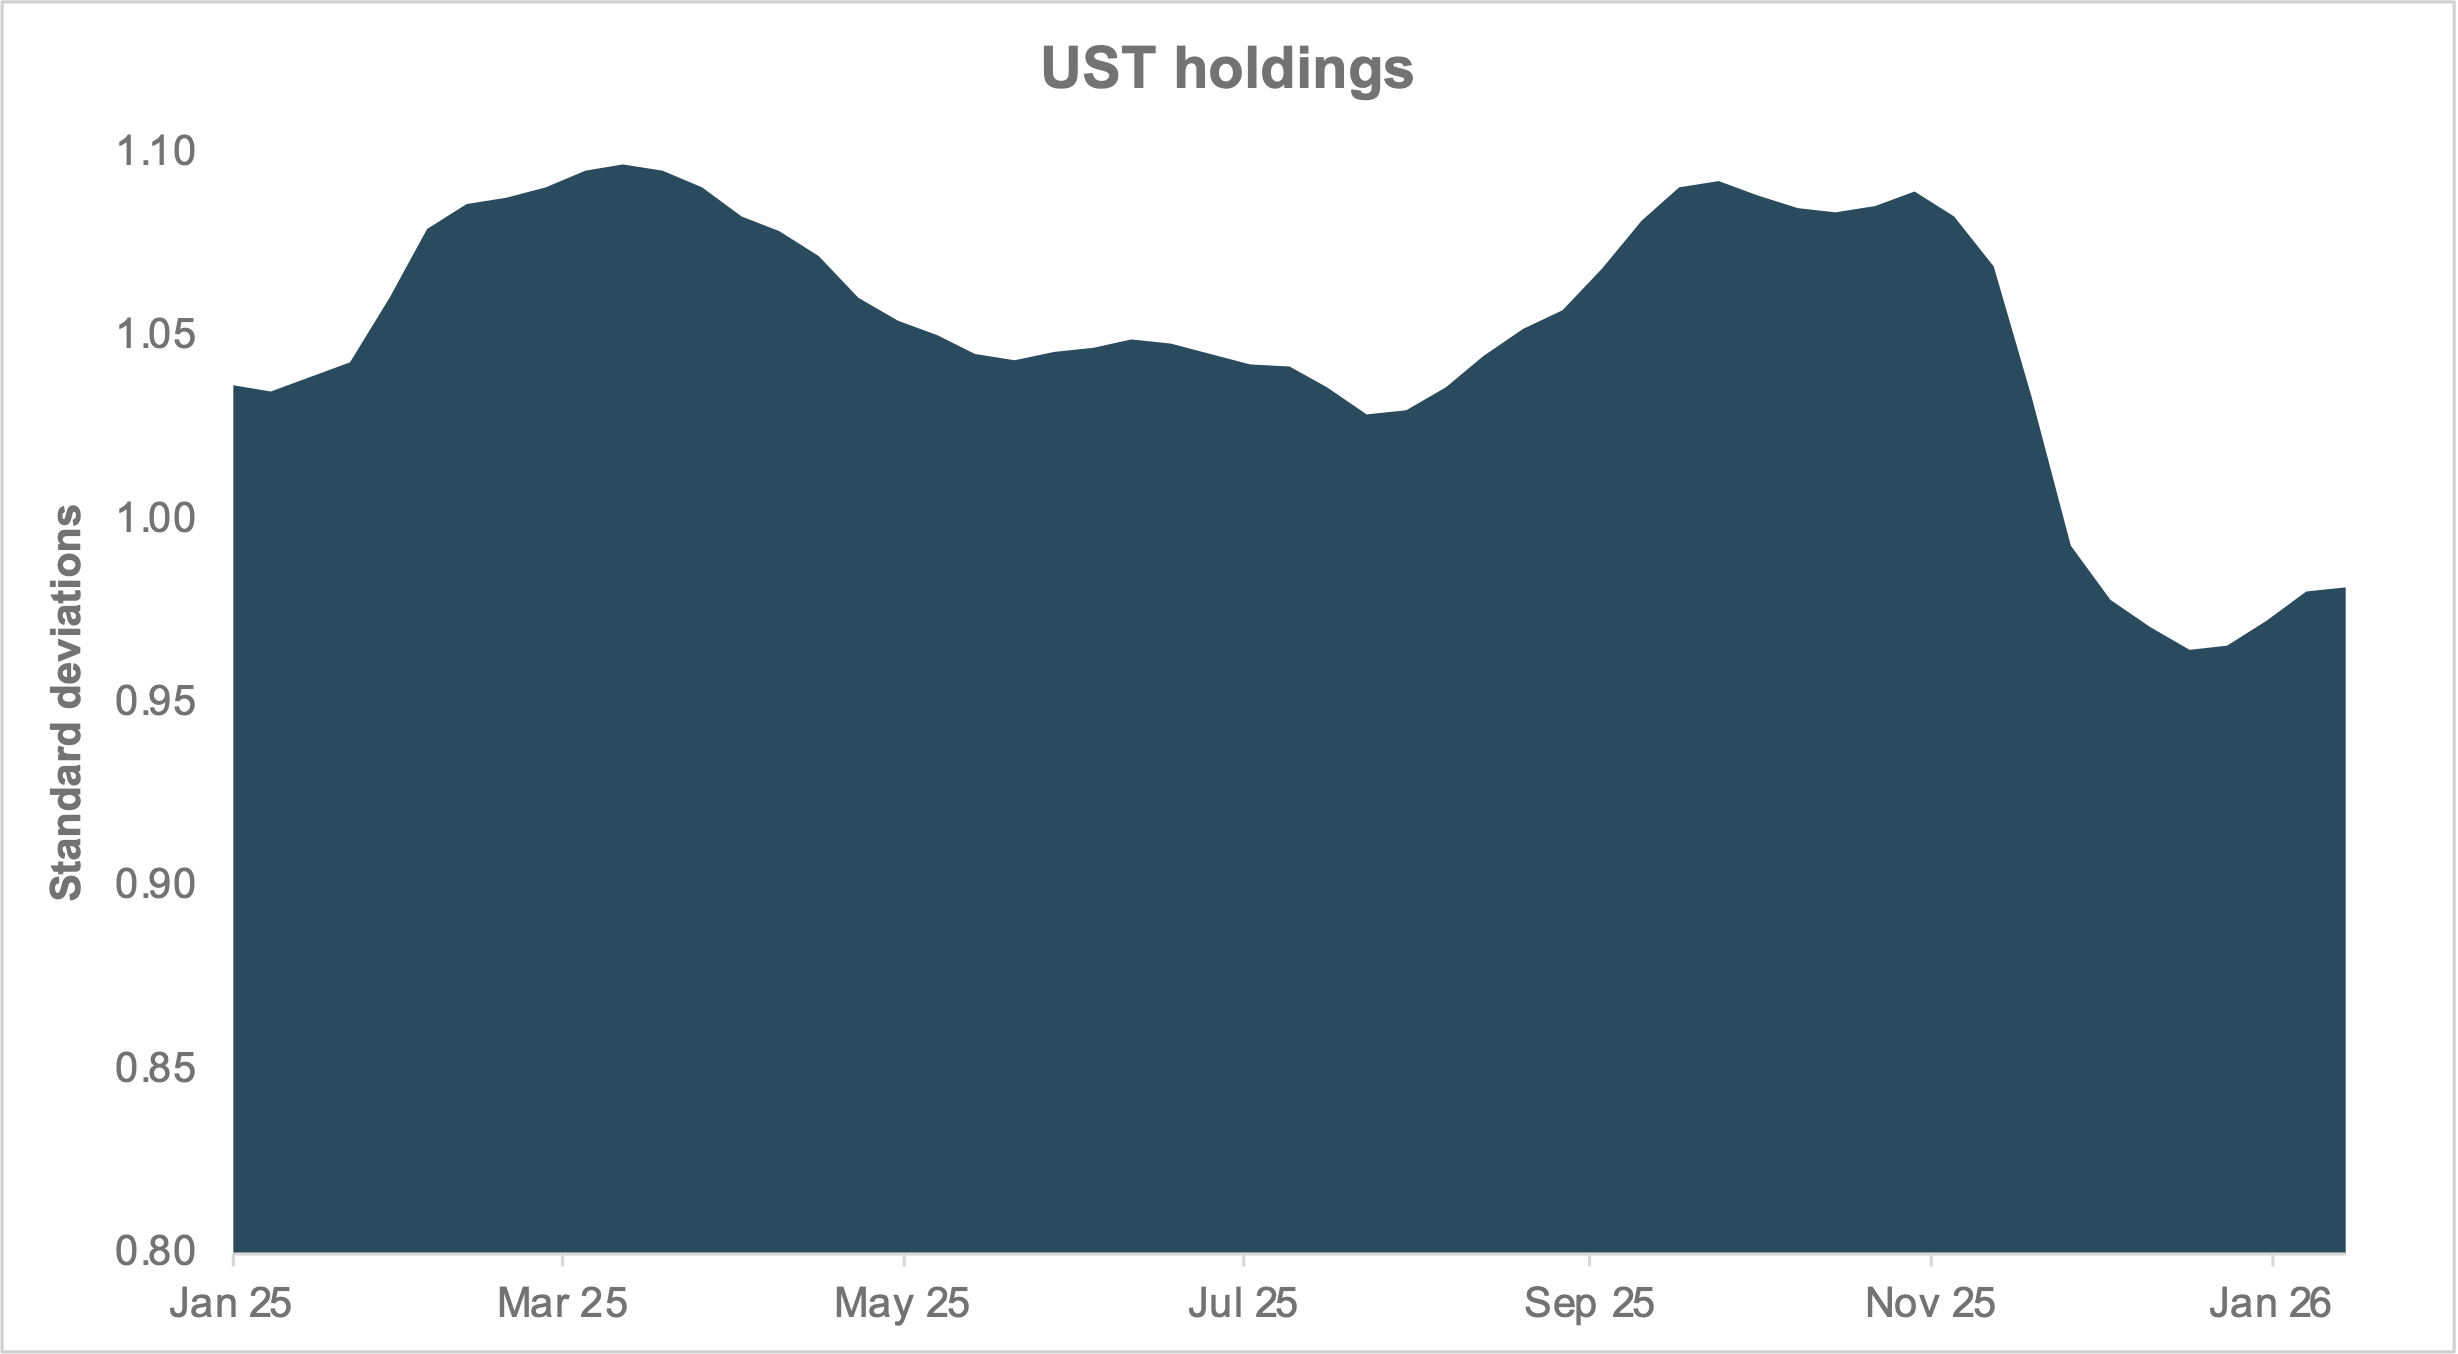
EXHIBIT #1: TOTAL HOLDINGS OF USTS IS LOW RELATIVE TO RECENT HISTORY
Source: BNY Markets, iFlow
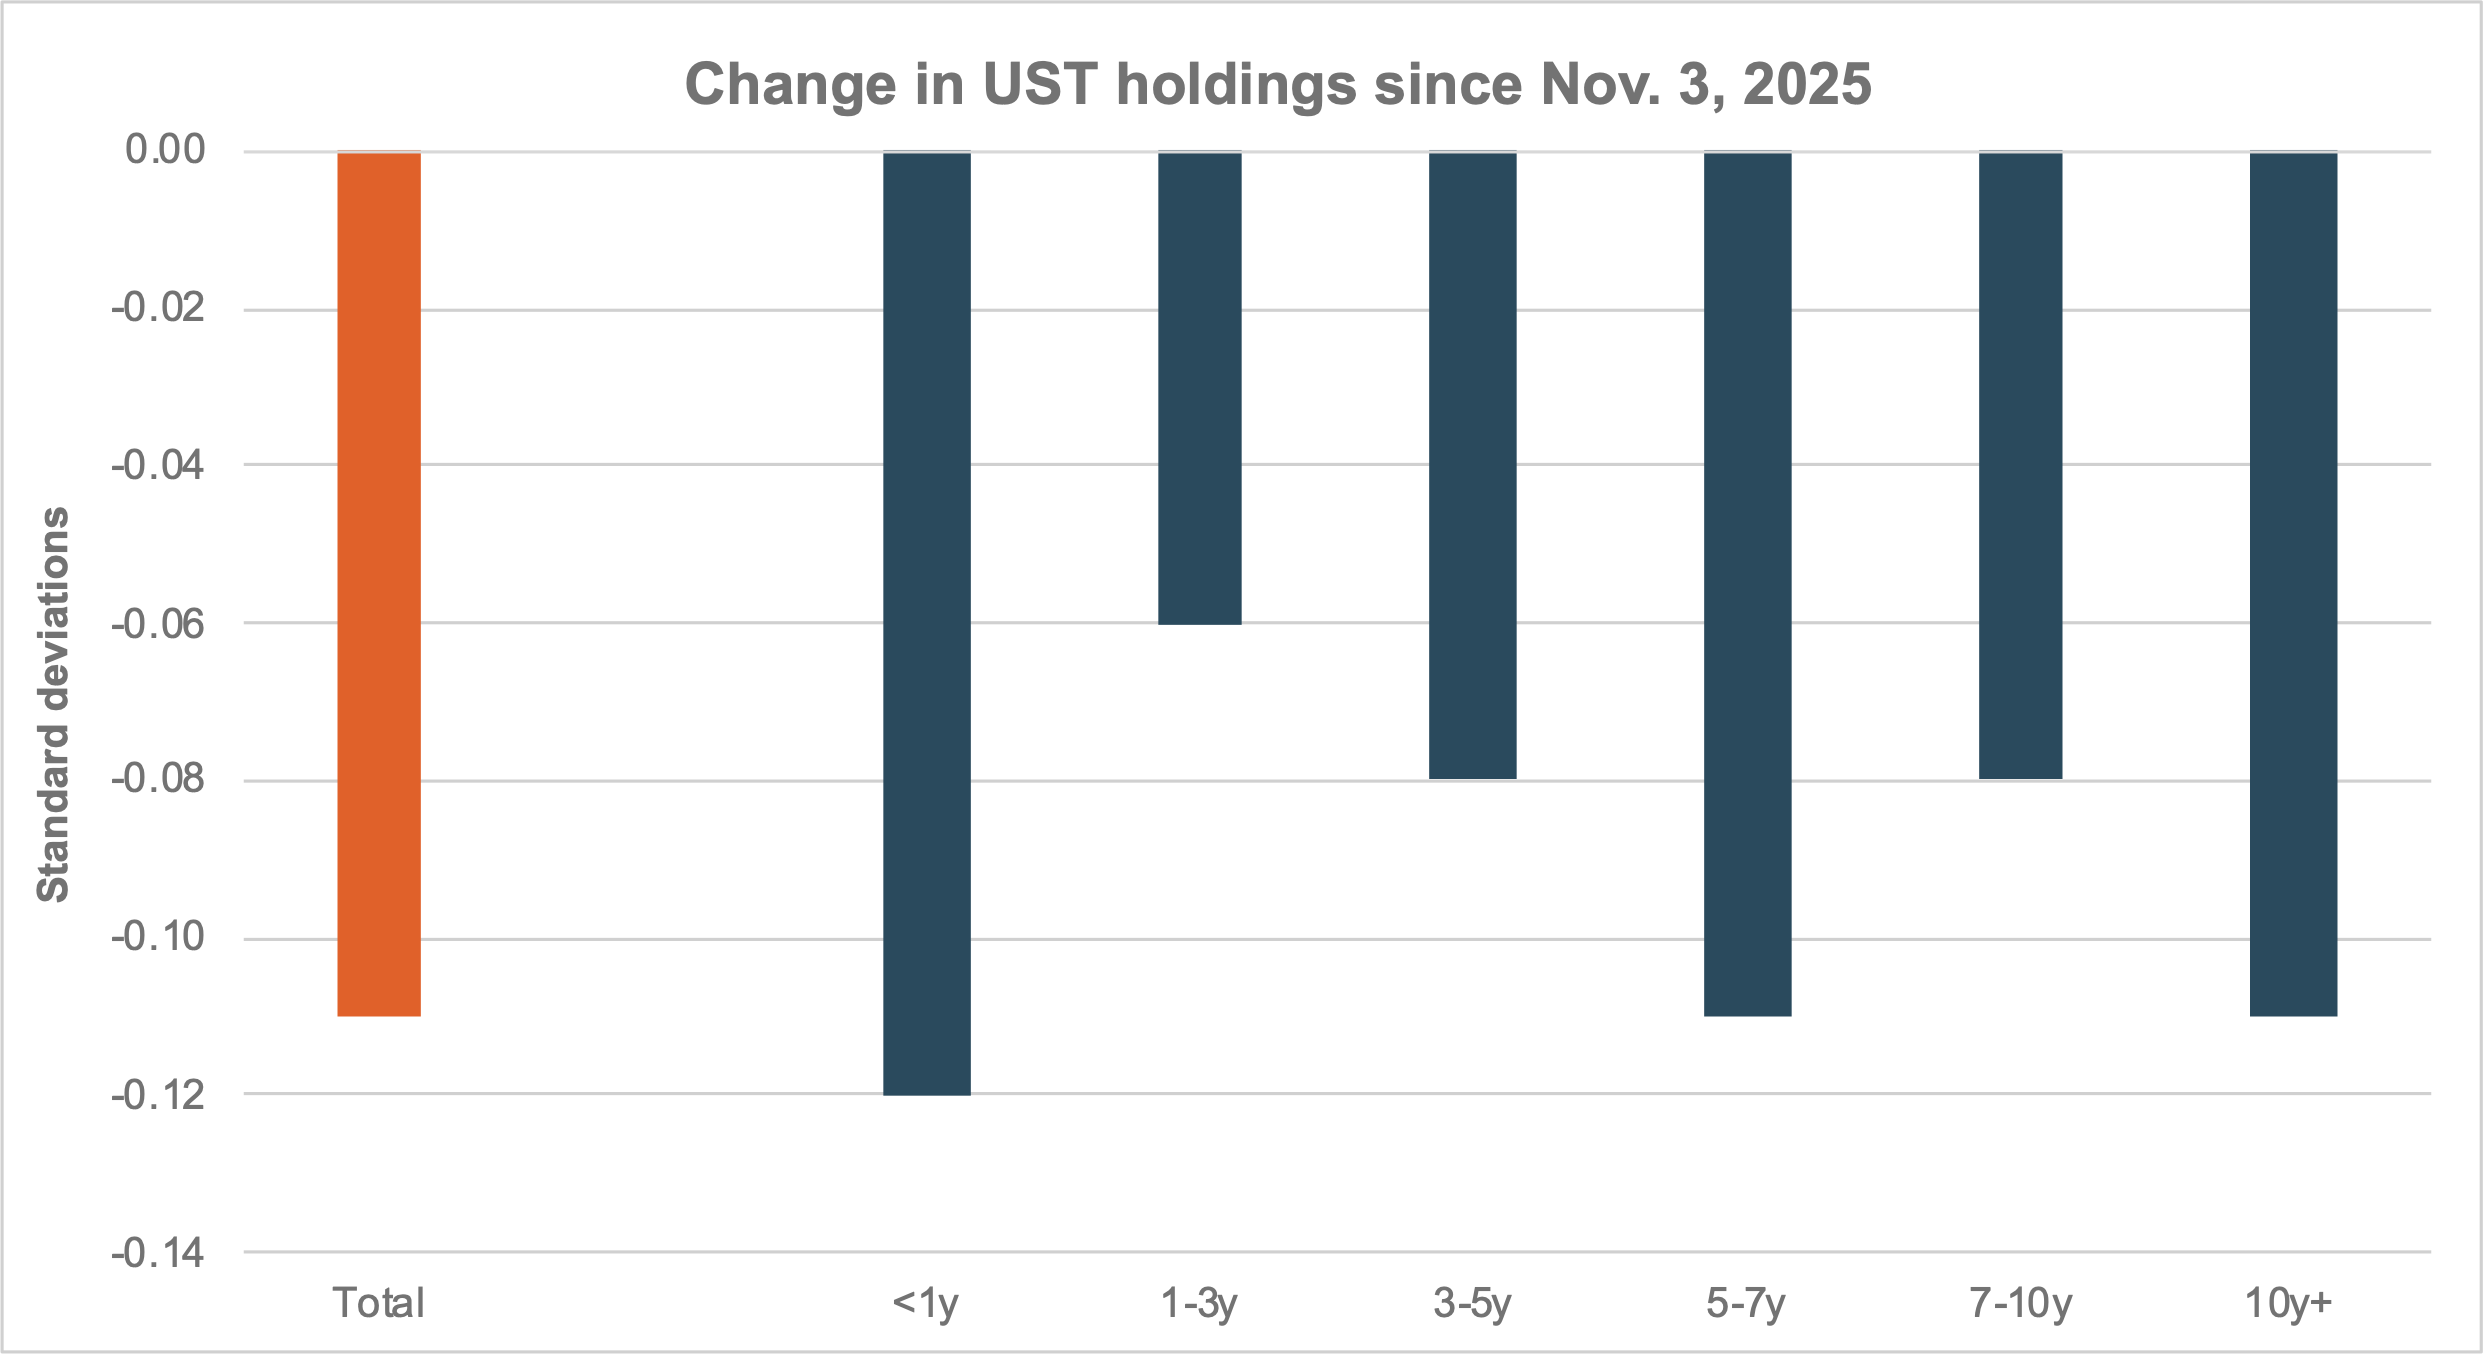
EXHIBIT #2: ACROSS THE CURVE, POSITIONS HAVE BEEN REDUCED SINCE NOVEMBER
Source: BNY Markets, iFlow
The U.S. administration’s announcement of tariffs on select European countries over the Greenland issue has led to a risk-off spell in financial markets. Given the Monday bank holiday in the U.S. this week, today provides an early look at the market reaction, with equities generally lower, bond yields higher and the dollar lower. Much has been made of a reprisal of the “sell America” trade, but we’re not sure today’s action confirms this. Rather, we see it is a logical move lower in risk given this past weekend’s policy shock, with U.S. Treasurys also caught up in the significant move higher in long-term Japanese government bonds (JGBs). Our flows and holdings data will be worth watching going forward as a gauge of any potential “sell America” trade.
We like to look at holdings of U.S. Treasurys over the past year to get a sense of how positions have evolved – especially since April last year – and identify where selling pressure might originate. From Exhibit #1, we see that there has been strong selling of USTs overall since early November. Much of that has to do with limited issuance over the last few months of 2025 – especially of T-bills. Note that in the spring of 2025, holdings fell significantly during the April tariff-induced turmoil. Exhibit #2 shows the change in holdings since the beginning of November last year across major buckets of the term structure.
Digging deeper, looking at the difference between domestic and foreign investors, we see that domestic UST holdings have remained stable since September 2025, following full recovery from “Liberation Day” selling, when U.S. asset managers observed a temporary rotation from T-bills to cash and other short-term assets. Again, as above, this reflects declining – and ultimately negative – net T-bill issuance over the fourth quarter of the curve.
Foreign Domiciled Institutional Investors (FDII) have sold UST since the recent peak in November 2025, with sales accelerating substantially in January and outflows concentrated across EMEA insurance, asset owners and asset managers (largely mutual funds and pension funds). European asset managers and asset owner were selling across the curve in January, declining by –6% in January alone (–9% since November). However, foreign holdings remain elevated and are 8% higher compared to the start of 2025. Foreign sovereign wealth funds remain invested in USTs, with holdings increasing throughout 2025 (+15%) and remaining stable in recent months.
There has been very minor (<1%) selling by APAC real money investors over the past few days, although holdings have been increasing steadily throughout December (with foreign selling concentrated across the EMEA/EU client base), while foreign bank holdings remain relatively stable across both EMEA and APAC domiciled clients.
Our data suggest positions are lighter than they have been in over a year, indicating limited “dry powder” left to liquidate.
Our analysis includes Institutional BNY custody clients with “foreign domiciled investors” defined as funds located outside the United States. The data and analysis include institutional UST holdings in absolute terms (no scaling or normalization). Client type mapping uses a mix of BNY official entity type framework and Asset Servicing segmentation.
Our UST trading desk reports that on the day, Treasury yields have decisively broken out of their long-term range, rising to the highest levels since August of last year. It is not clear if this is because of Trump’s newly announced tariffs over control of Greenland or the meltdown in JGBs. The move in U.S. yields is relatively moderate compared to the jump in JGBs, with the yield on 30y Japanese bonds closing 38bp lower than last Friday.
The move in the U.S. curve has mirrored the steepening in JGBs, but at a much smaller magnitude. U.S. 2s10s briefly traded above 70bp, but is now “only” 4.5bp steeper on the day. 5s30s had traded around 7bp steeper this morning, but is now 3bp steeper. The market was given a cautionary example of what European market-based, economic retaliation might look like when it was reported that a Danish pension fund planned to sell its UST holdings; the 10y yield spiked to 4.31%, before a follow-up report revealed that the fund in question only held $100mm in USTs and move reversed.
Looking forward, the market is still awaiting the Supreme Court’s ruling on the use of tariffs under the International Emergency Economic Powers Act (IEEPA), which is now unlikely to come before February. If yields continue to rise in the near term, we are also likely to see an increasing focus on Treasury’s upcoming Quarterly Refunding Announcement and the longer-term implications of higher rates and increased borrowing needs. Additionally, the tightening of the mortgage basis, which the market enjoyed after the announcement of FN/FR purchases, has now been erased in outright mortgage rates by the jump in UST yields, so it will be worth keeping an eye out for further administration efforts to lower mortgage rates.