Introducing iFlow FX Hedge Ratios
iFlow > Special Report

Geoff Yu
Time to Read: 9 minutes
Why hedge ratios matter. Hedging can be as important for currencies as the underlying asset flow. Cross-border investors may be the marginal buyers of a currency, but purchasing foreign assets doesn’t create lasting FX demand if the exposure is offset through forwards or swaps. Changes in hedge ratios can therefore move markets: higher ratios add forward selling, while lower ratios remove that pressure or reverse it. The starting point matters, too. Heavily hedged investors may have little need for more protection and can unwind hedges if the outlook improves; lightly hedged investors remain more exposed to currency weakness and may hedge more aggressively.
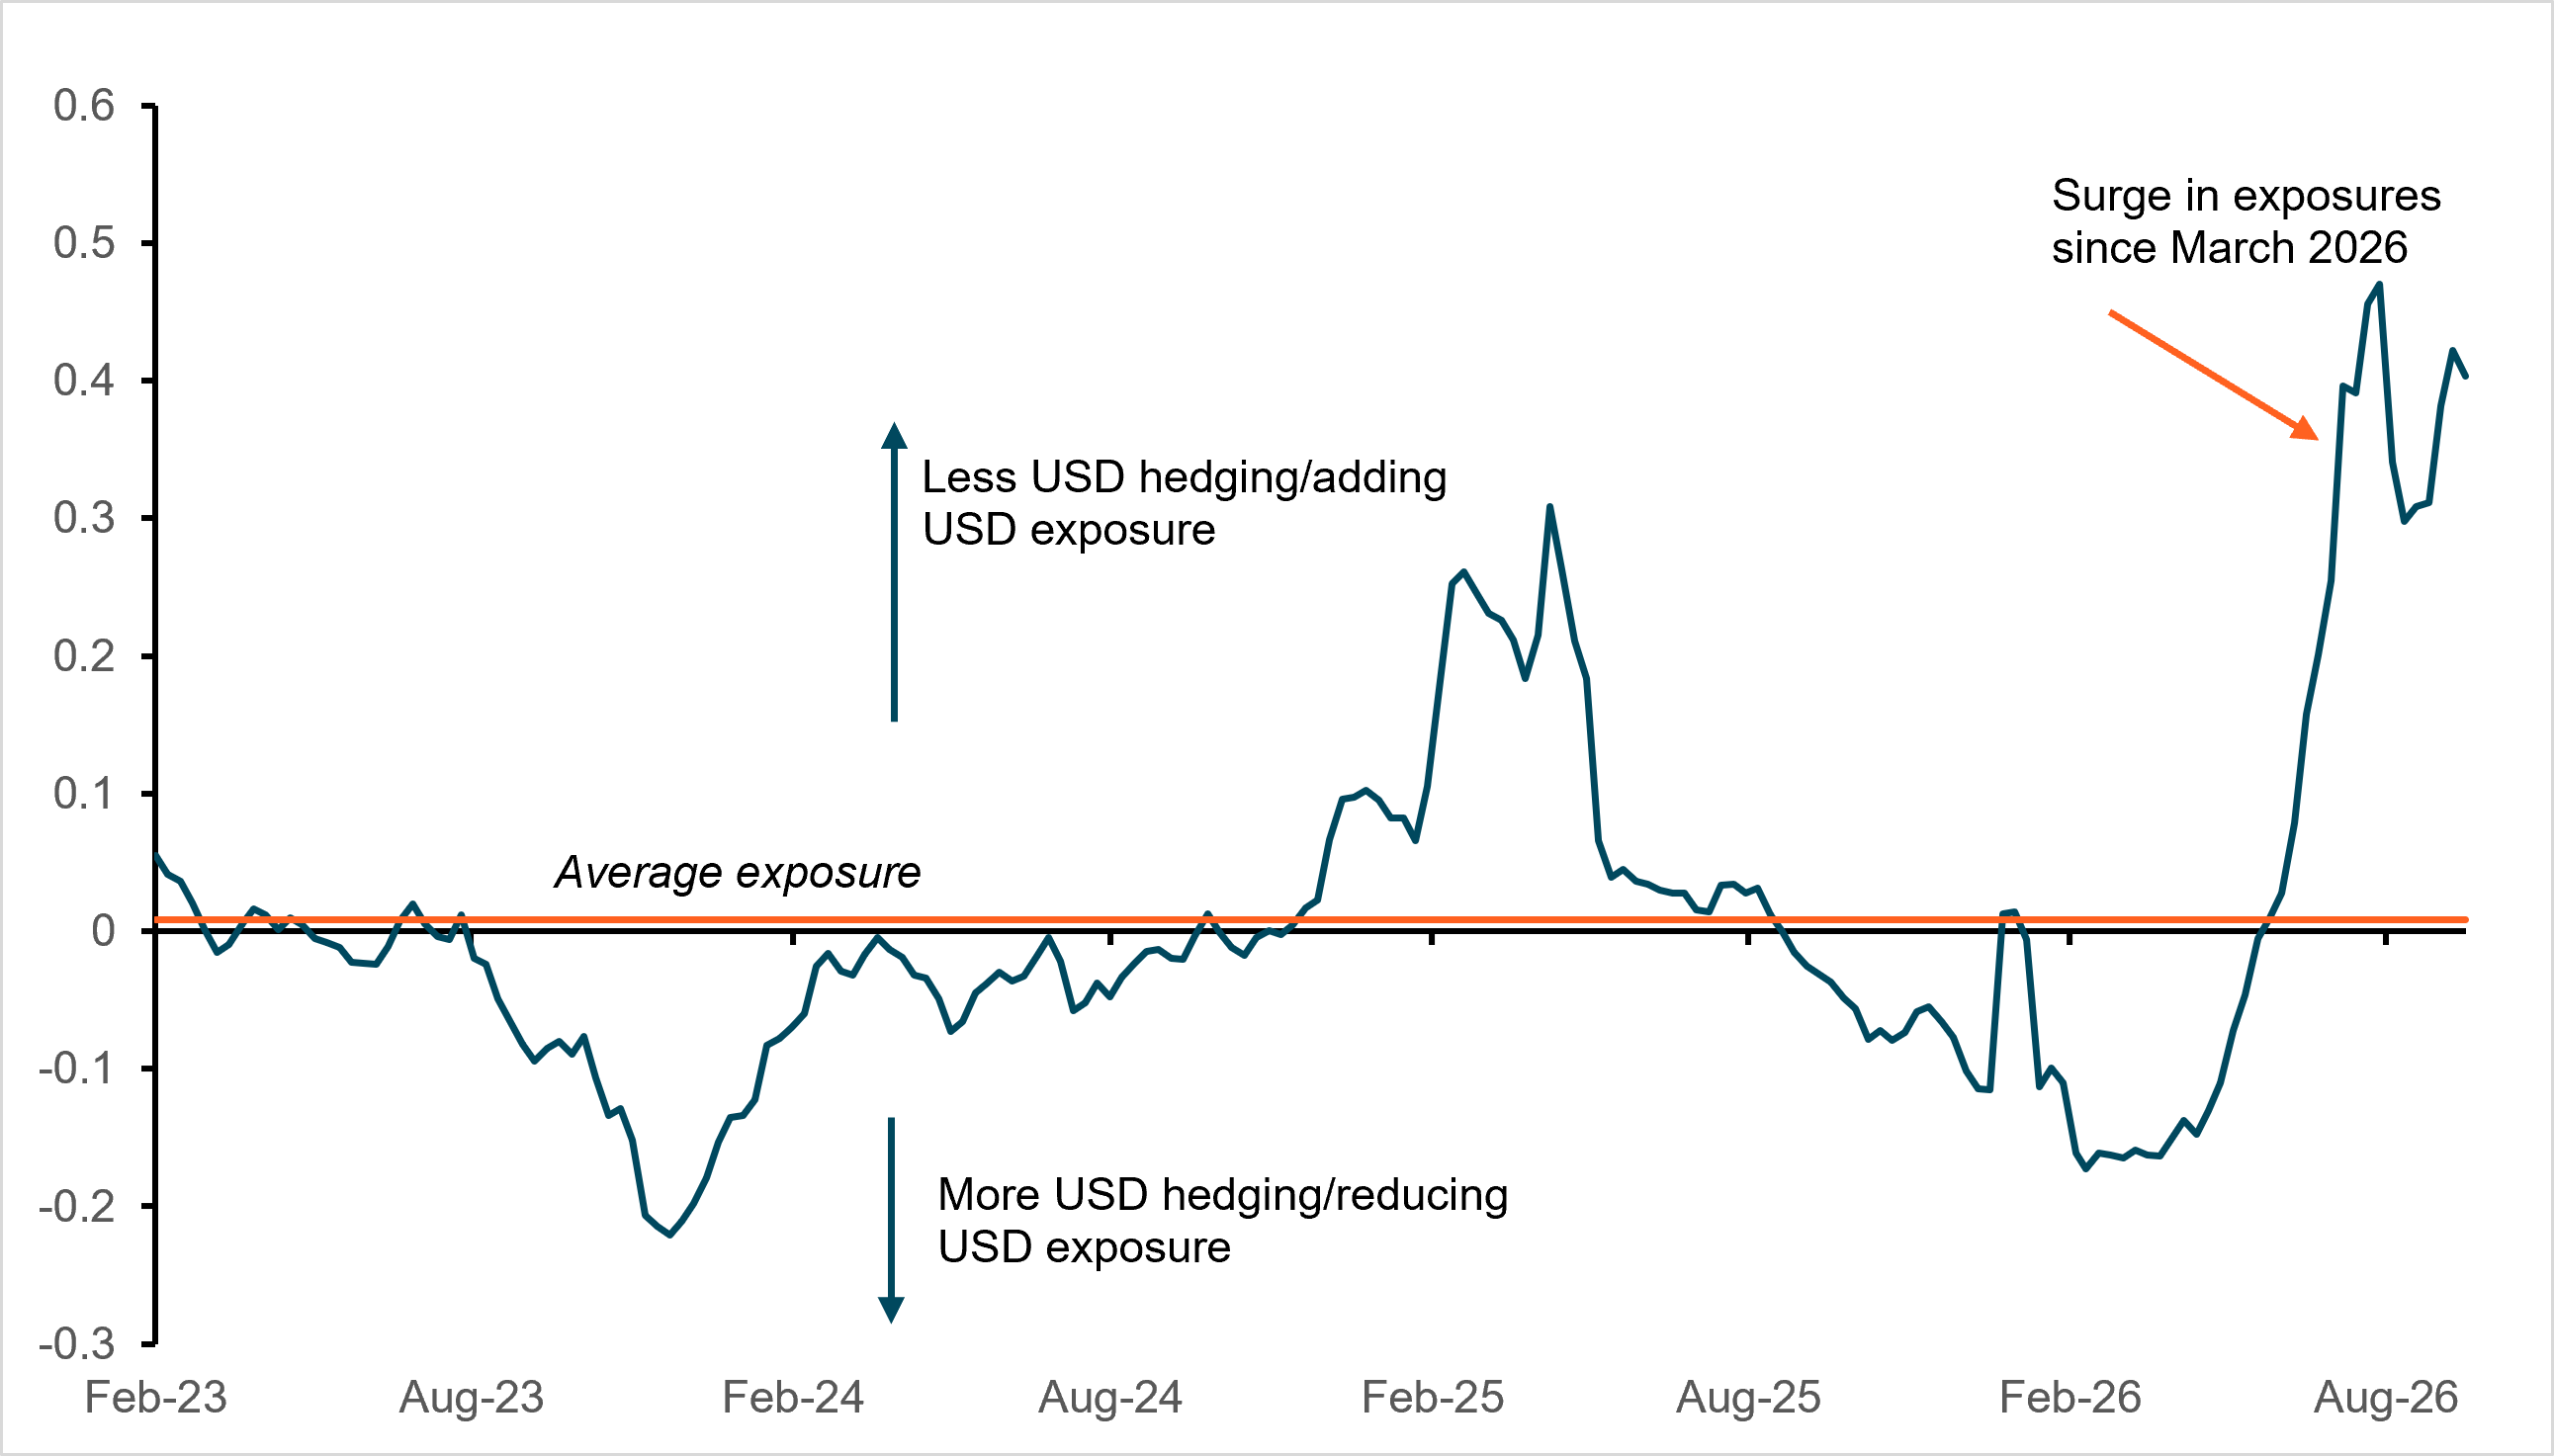
Recent examples and the dollar risk. Europe shows how quickly hedge adjustments can matter. Cross-border investors entered 2025 heavily hedged on European exposures, then reduced those hedges as fiscal expansion and strategic autonomy improved the regional outlook, helping the euro outperform sharply in the first half of the year. The dollar now presents the opposite setup. Our earlier proxies suggest investors retain substantial dollar exposure relative to their U.S. asset holdings (Exhibit 1). Net U.S. exposures are near multi-year highs, pointing to material underhedging; given the scale of foreign ownership, even a modest rise in hedge ratios could generate meaningful dollar-selling pressure.
EXHIBIT #1: NET U.S. ASSET EXPOSURE NEAR A MULTI-YEAR HIGH
Source: BNY as of Sept. 25, 2026; cross-border U.S. equity and fixed-income holdings net of USD holdings.*
A new hedge ratio. iFlow can now measure hedge ratios directly and systematically rather than rely on proxies. The challenge has always been linking observable foreign asset holdings to FX positions whose purpose may be unclear: a forward or swap can hedge equities, bonds or a combined portfolio, and at times may add currency exposure rather than reduce it. Built on BNY’s proprietary data covering $62tn in assets under custody and administration, iFlow solves this by connecting holdings and FX positions at the client and currency level. Its daily T+1 indicators span FX, equity and fixed-income markets, allowing us to introduce FX Hedge Ratios based on BNY custody flow and positioning data.
Core idea. The FX Hedge Ratio estimates how much of an investor’s foreign-currency asset exposure is offset through FX forwards and swaps by linking client-level holdings directly to client-level FX positions. Consider a Canadian fund holding U.S. equities: it carries both equity and dollar risk. To reduce the currency exposure, it can sell dollars forward or take the equivalent position through the far leg of an FX swap. The indicator compares that short USD position with the value of the underlying U.S. equity holdings; the same logic applies to foreign bond portfolios.
How to read it. A hedge ratio near 100% means nearly all FX exposure is hedged. A ratio above 100% means the position is overhedged. A negative ratio means the FX position is reinforcing, rather than offsetting, the asset exposure. That can happen when investors take an “all-in” view on both the country’s assets and its currency.
What iFlow covers and why it matters. The value-weighted indicator shows how much of the market’s overall foreign-currency asset exposure is hedged, giving larger investors and positions greater influence. It covers 34 currencies and can be viewed pairwise – for example, Canadian investors’ USD exposure or Japanese investors’ EUR exposure – or as a cross-border aggregate focused on the currency being hedged. This helps explain why asset demand doesn’t always become spot FX demand and why shifts in hedging can drive currency performance.
More detail. The fuller methodology, including how we treat multi-asset portfolios and allocate hedges across equities and fixed income, is set out in the Appendix.
Case study 1: Cross-border hedging of U.S. portfolios has fallen
U.S. exposure and the FX implication. U.S. asset exceptionalism remains intact, but holdings alone overstate the associated dollar demand. iFlow shows that nearly 65% of equity assets are invested in the U.S. and about 75% of sovereign bond holdings are in Treasurys, with no meaningful retreat after the 2025 “liberation day” tariffs or the geopolitical shocks of 2026. Yet investors buy dollars spot for the asset and then decide separately whether to hedge. The incremental currency effect therefore depends on changes in hedge ratios, not on asset holdings alone.
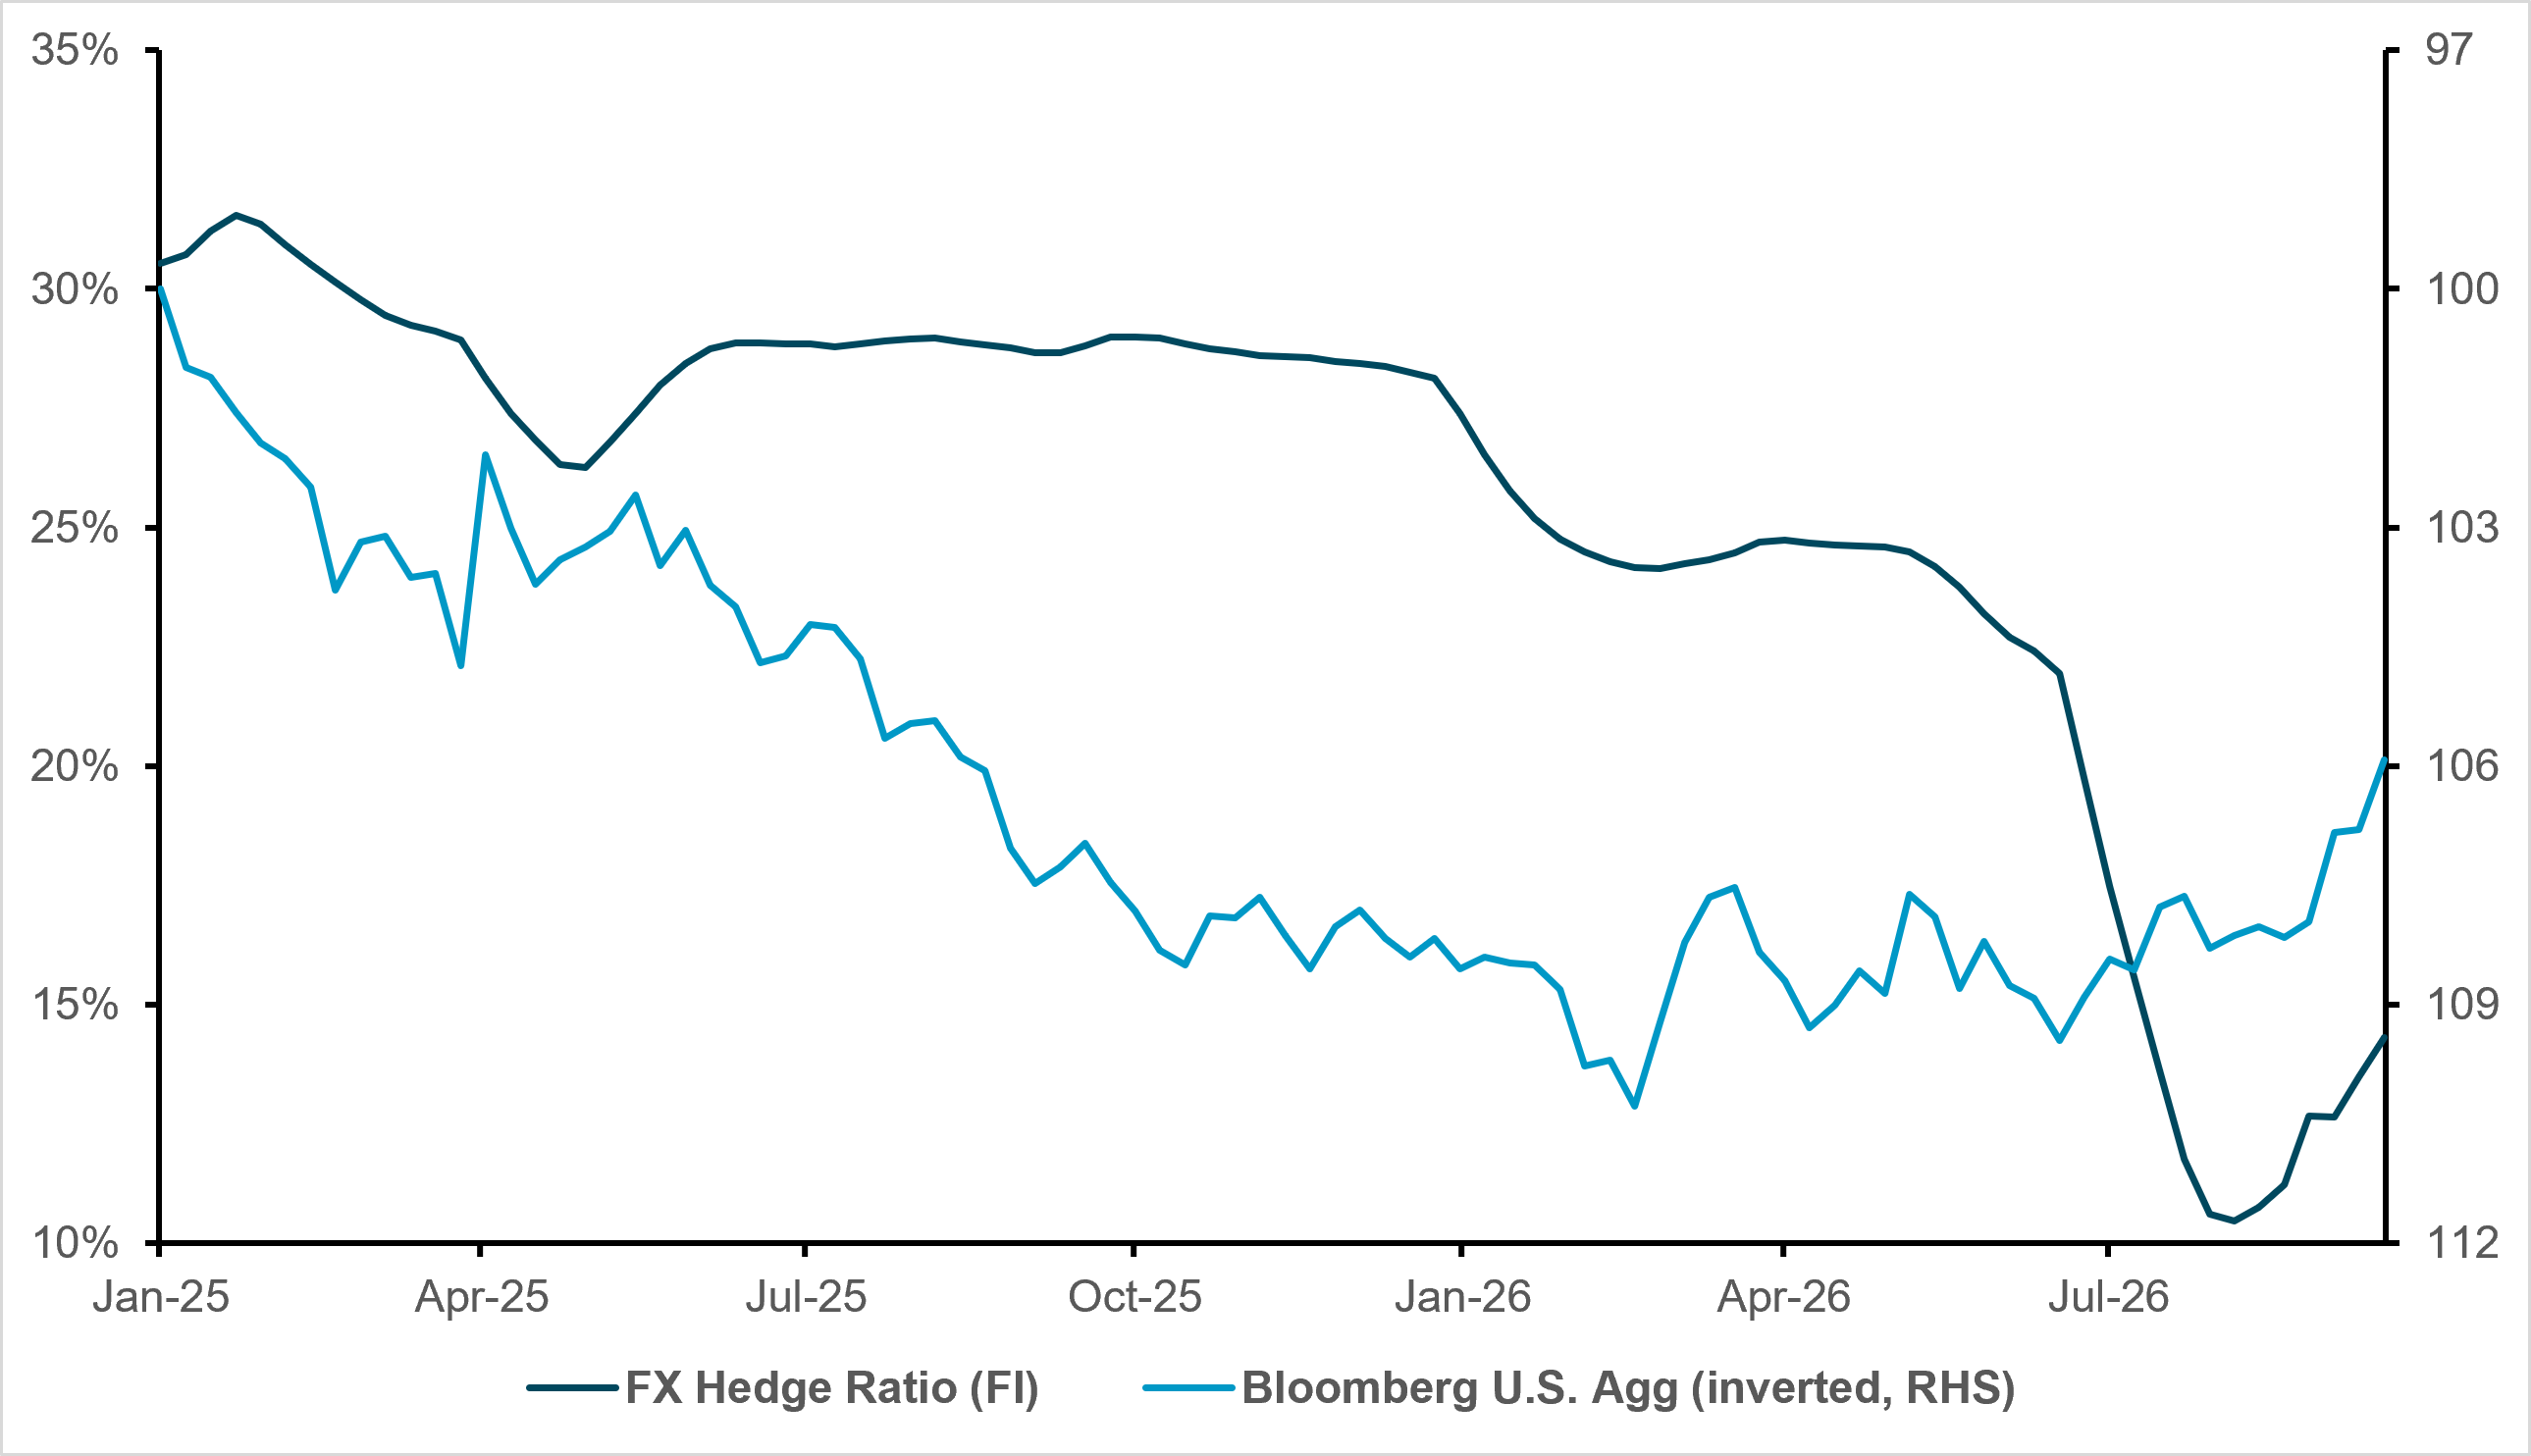
Treasury hedging. This is especially relevant for Treasurys. Our estimates indicate that cross-border hedging of U.S. fixed-income positions remained near 30% throughout 2025, but has fallen sharply over the past six months, broadly in line with shifts in U.S. rate expectations. There has been some rebound since mid-August, but at roughly 15%, current hedge ratios remain around half last year’s levels (Exhibit 2).
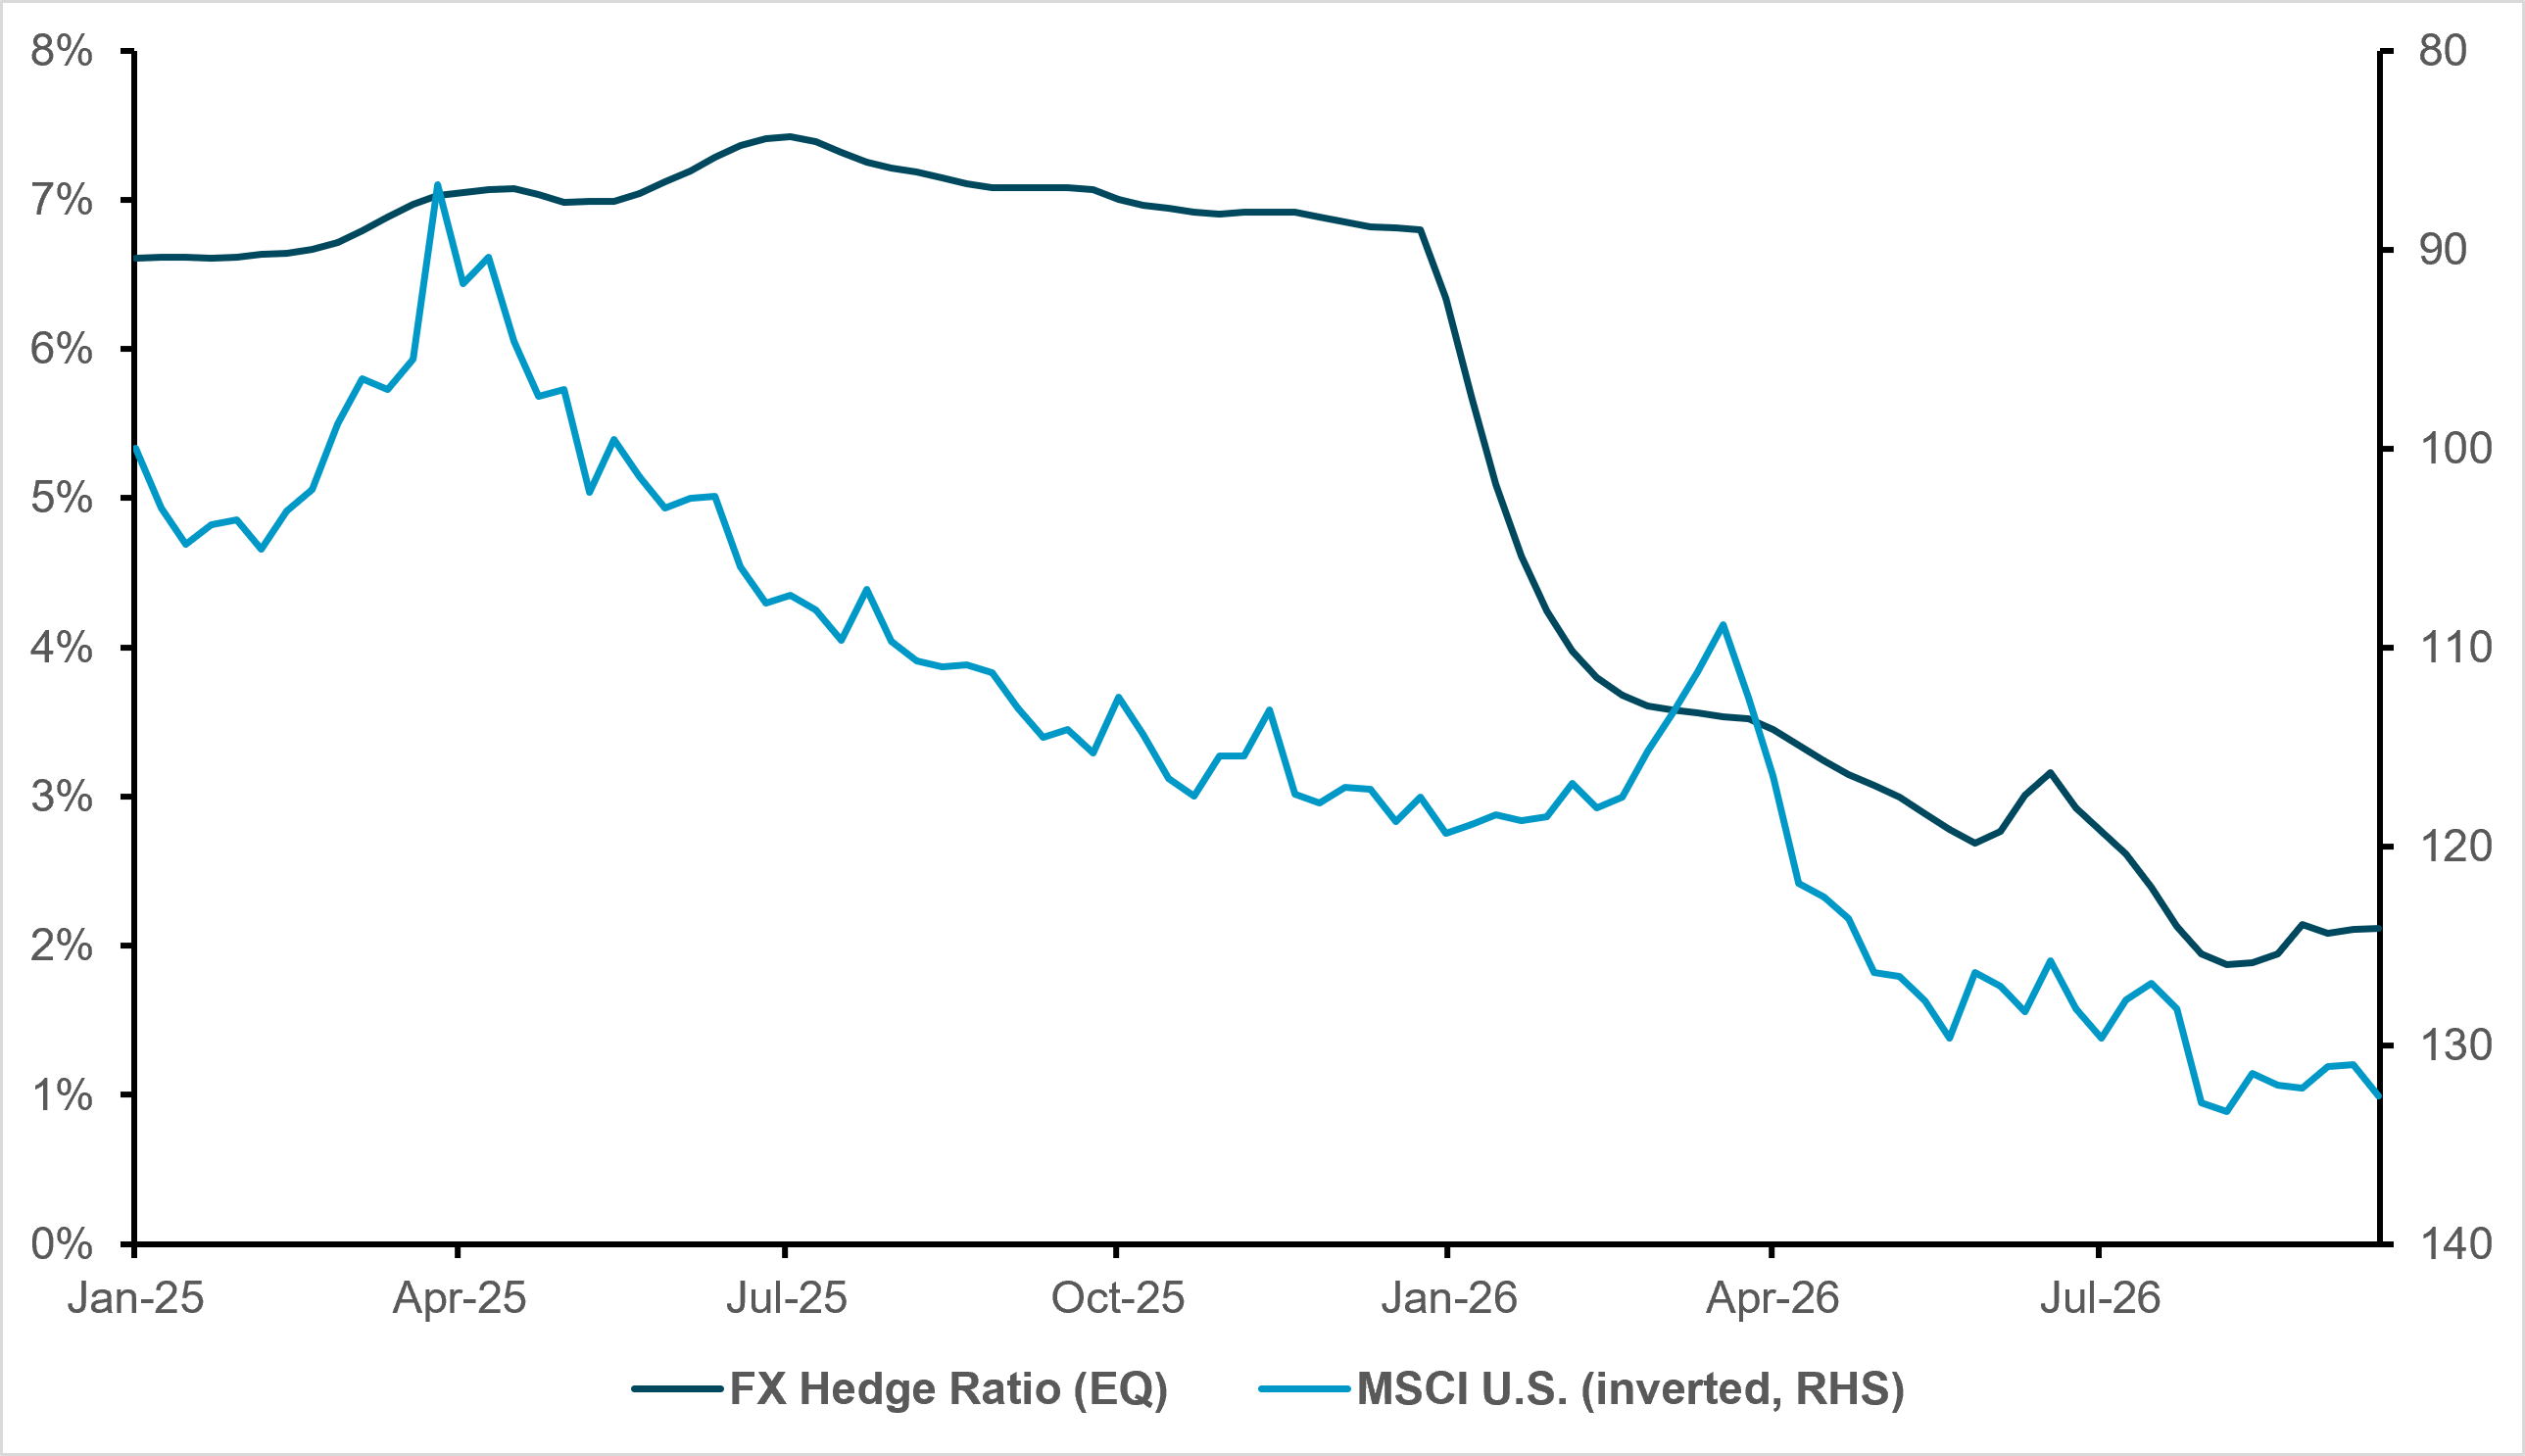
Equity hedging. Hedging of U.S. equities remains even more limited. The starting point was already low, with hedge ratios near 7% through 2025 before falling sharply in early Q1 this year. That move coincided with softer dollar performance amid “debasement” concerns, even as U.S. equities remained relatively stable. More recently, the decline in hedge ratios has tracked stronger equity performance (Exhibit 3), suggesting that outright hedge levels may have remained broadly stable while forward dollar sales failed to keep pace with the rising value of the underlying positions.
EXHIBIT #2: U.S. HEDGE RATIO HAS ROUGHLY HALVED
Source: BNY as of Sept. 25, 2026, Bloomberg; hedge ratio is for all cross-border clients*
EXHIBIT #3: U.S. EQUITY HEDGE RATIO FALLS AS STOCKS RALLY
Source: BNY as of Sept. 25, 2026, Bloomberg; hedge ratio is for all cross-border clients*
Case study 2: U.S. investors moved into naked KRW longs in South Korean equities
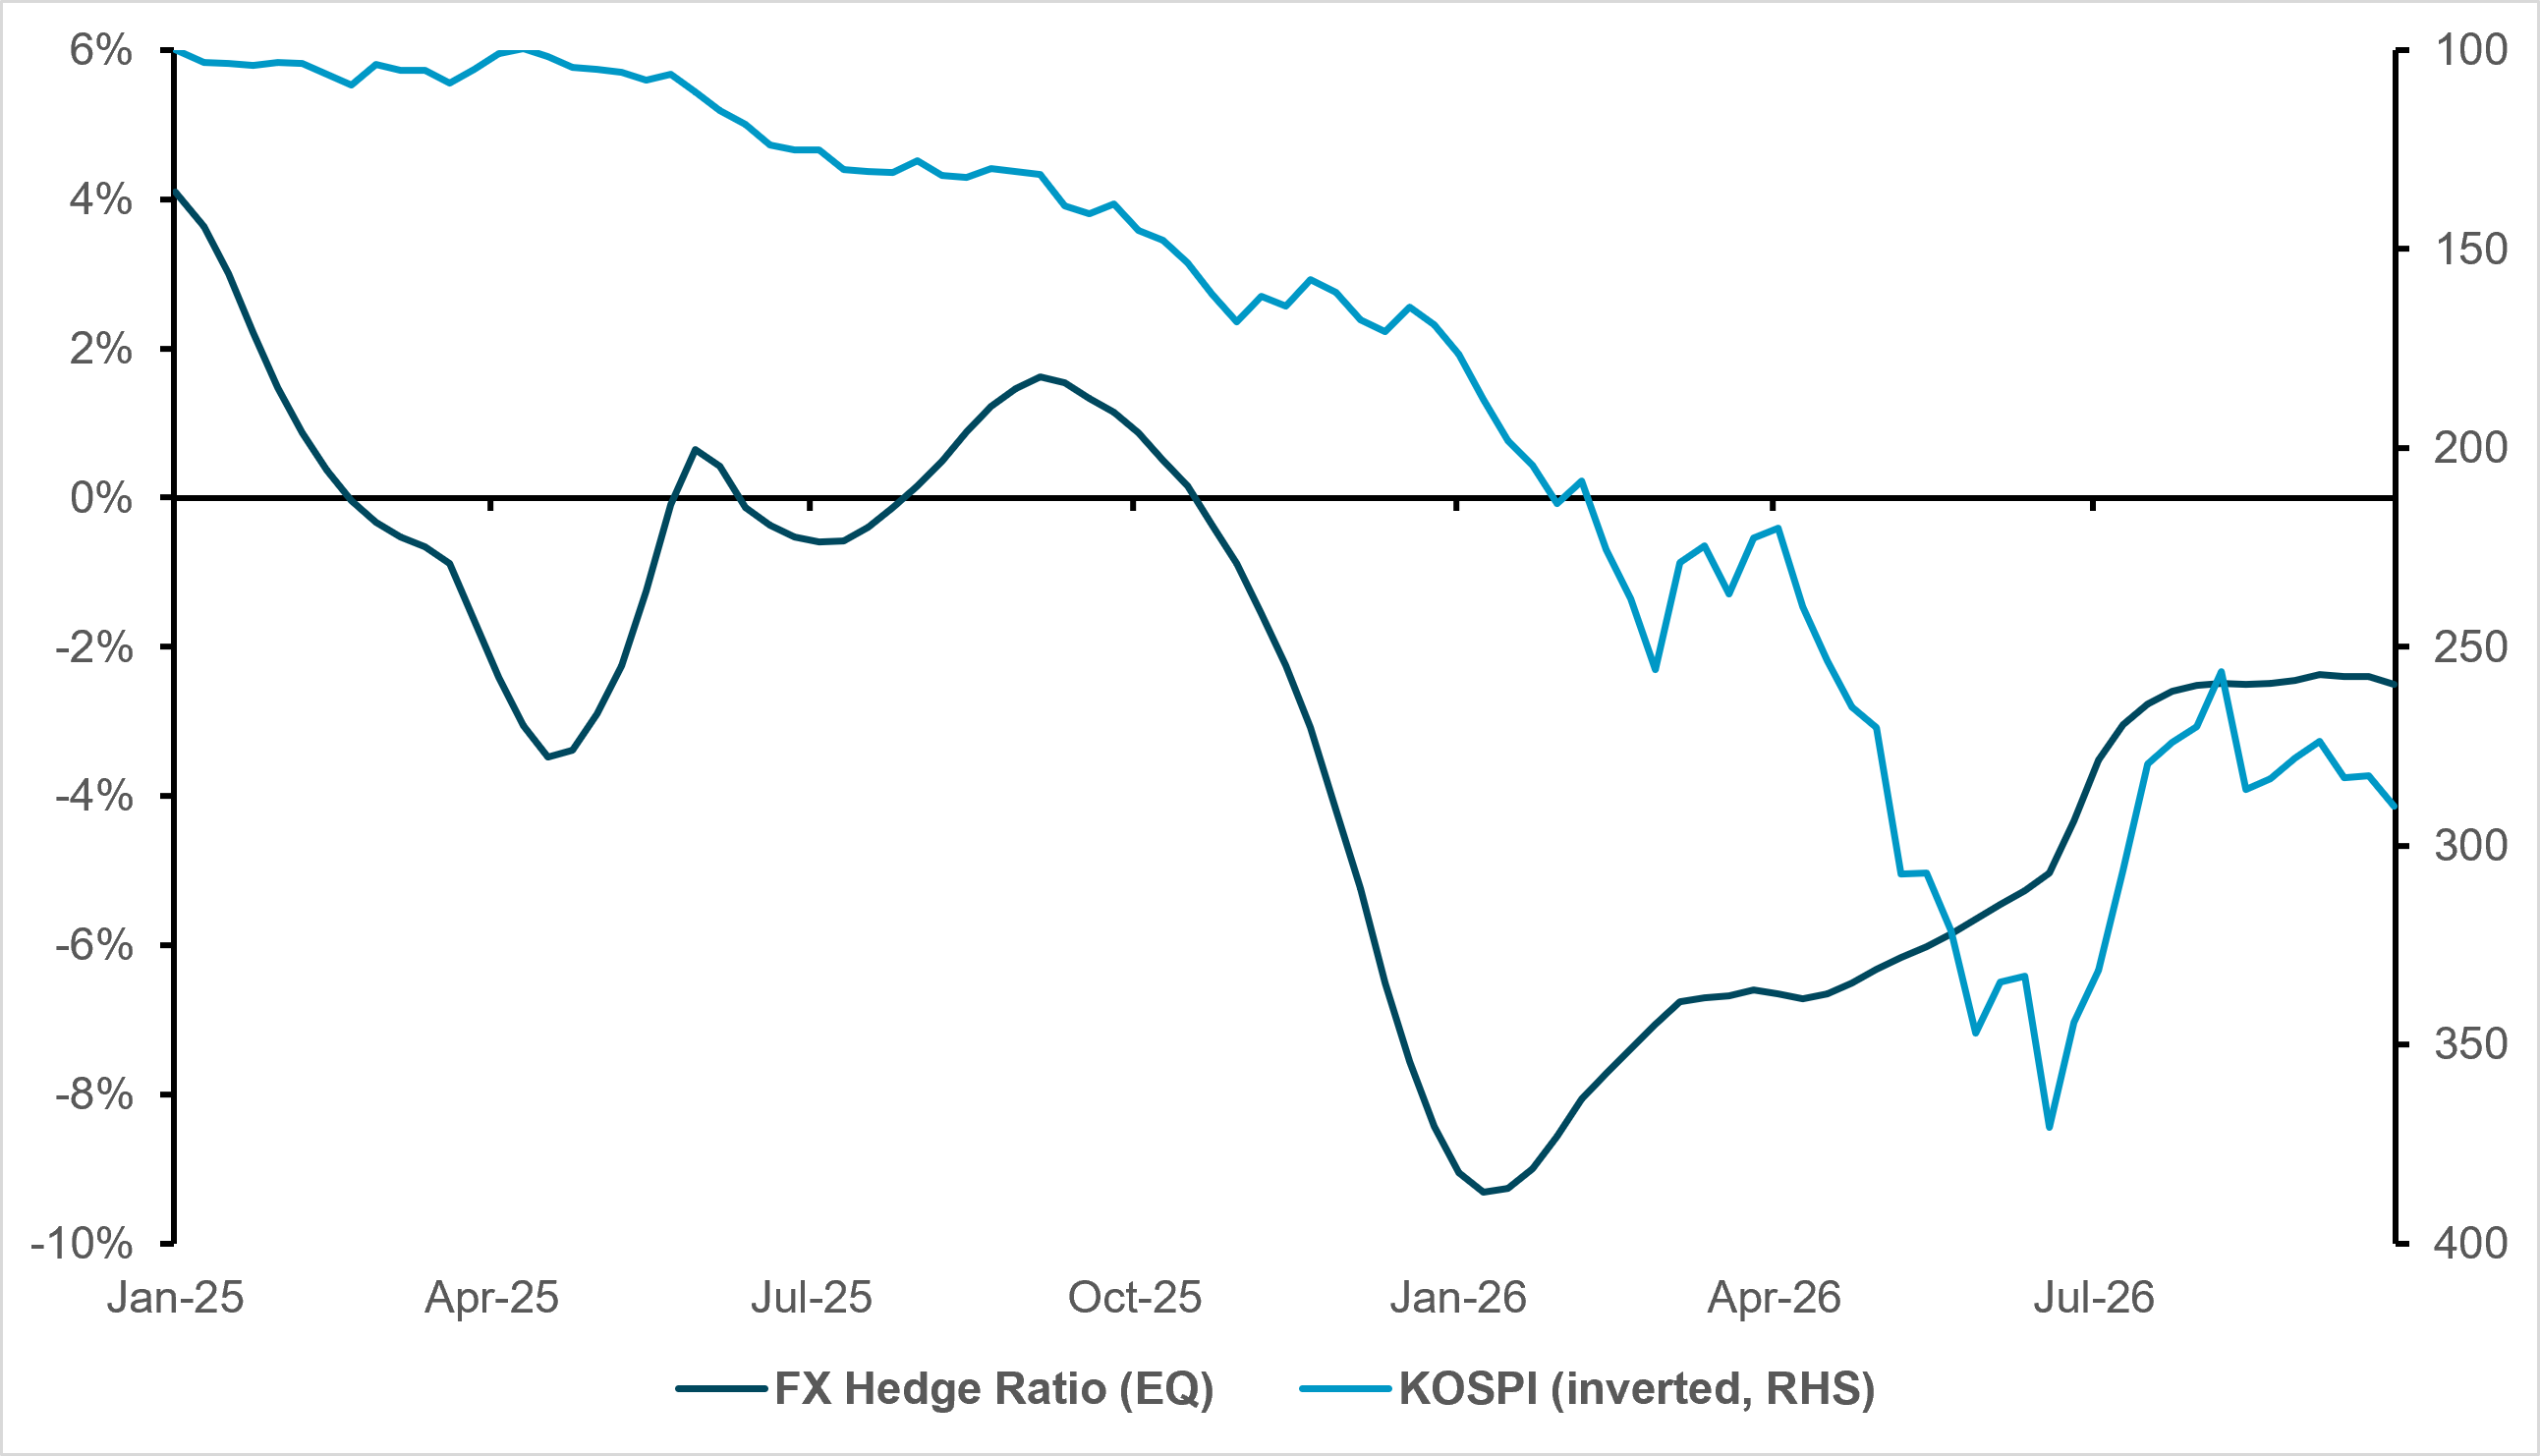
South Korea trade. U.S. investors have moved beyond simply leaving South Korean equities unhedged: they are running outright KRW longs alongside the position. At the start of 2025, before the South Korean “memory trade,” they hedged roughly 4% of their exposure. As KOSPI strengthened, the ratio turned negative despite yield differentials that might normally have encouraged more hedging (Exhibit 4). The result fits our broader view that dollar weakness should produce a larger adjustment against Asian funding currencies than against the traditional majors. Even after the recent equity correction moderated KRW exposure, investors still appear willing to hold naked currency risk while the won screens as materially undervalued.
EXHIBIT #4: LOW YIELDS DIDN’T LIFT SOUTH KOREAN HEDGE RATIOS
Source: BNY as of Sept. 25, 2026, hedge ratio is for USD-based clients only*
Case study 3: Hedging of JGBs mean-reverts with JPY valuations
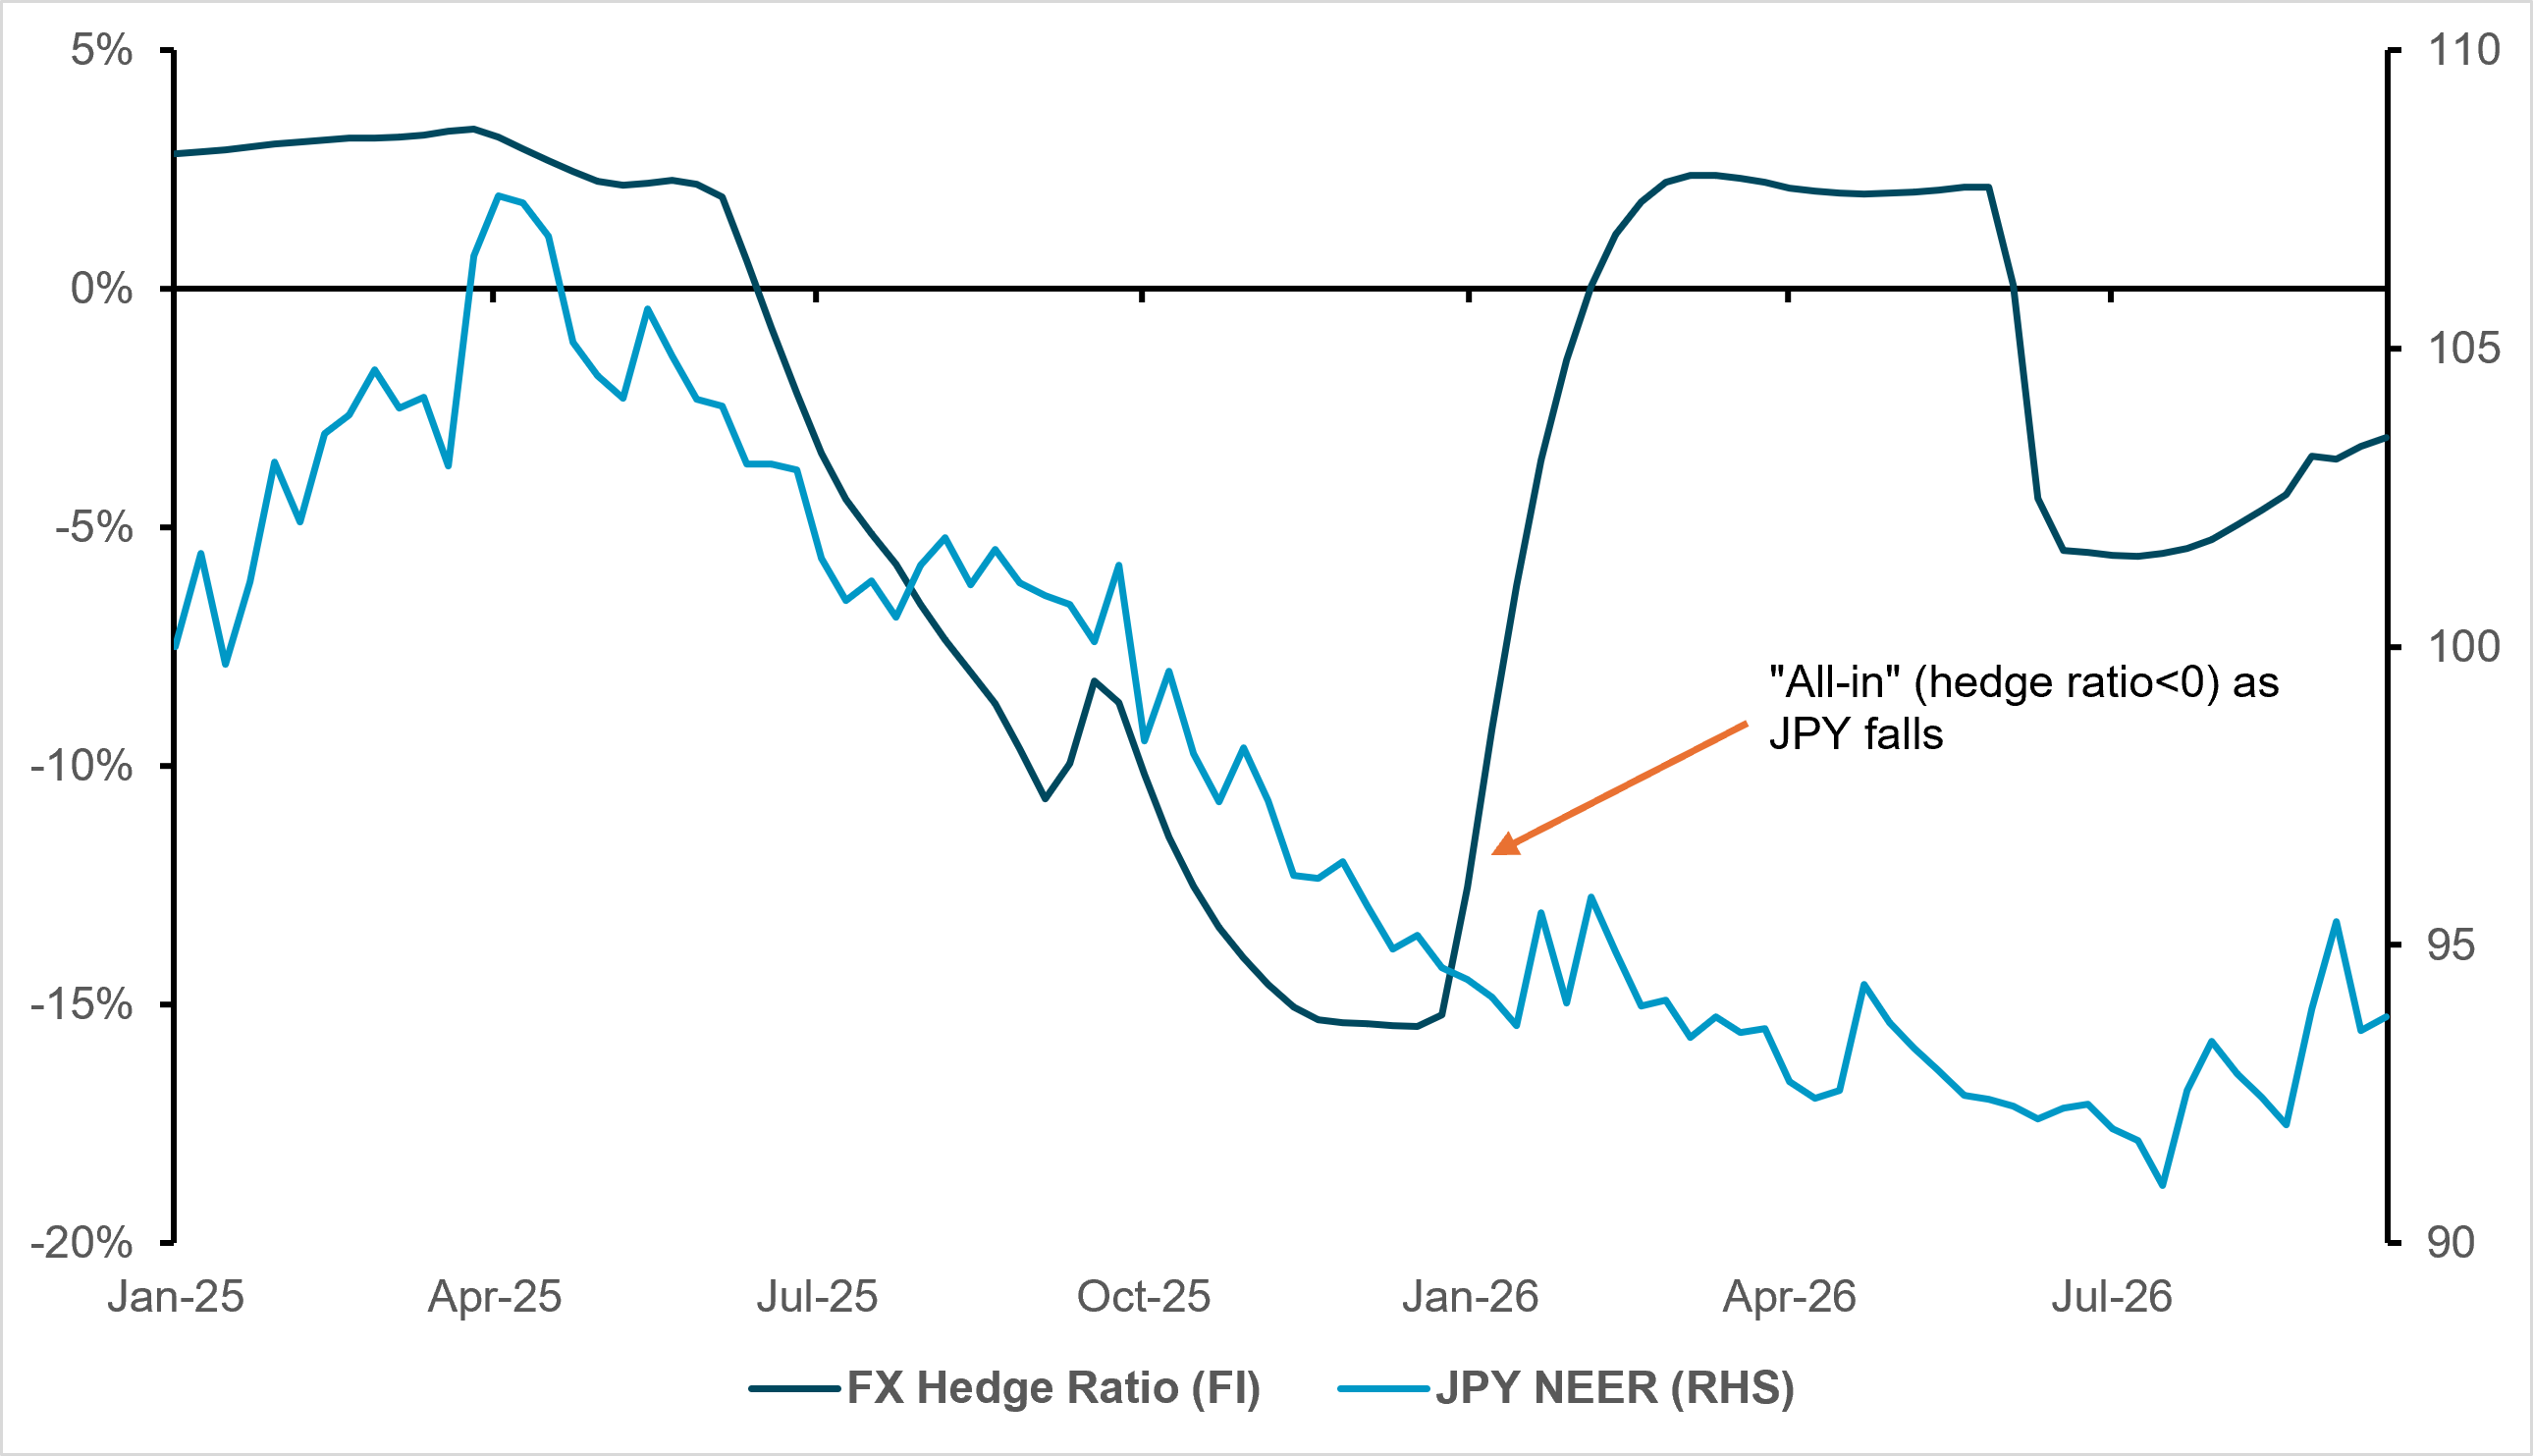
JPY valuation and intervention risk drive JGB hedging. From Q2 2025, cross-border investors moved toward naked JGB exposure as yields became more attractive and the yen weakened (Exhibit 5), effectively judging that the potential for JPY recovery outweighed the carry cost of leaving FX risk open. That stance reversed in January, when hedge ratios returned to a modest positive level of about 2% as disorderly yen weakness became a clearer risk. More recently, intervention has changed the pattern again: investors have tended to add hedges into yen strength and remove them when the currency weakens, positioning for possible official support. This is unusual for asset owners, but the yen remains a special case because intervention windows are seen as relatively well defined.
EXHIBIT #5: JGB HEDGING STAYS LOW DESPITE WEAKER YEN
Source: BNY as of Sept. 25, 2026, hedge ratio is for all cross-border clients*
Case study 4: Hedging of Colombian fixed income tracks rates in 2026’s leading carry trade
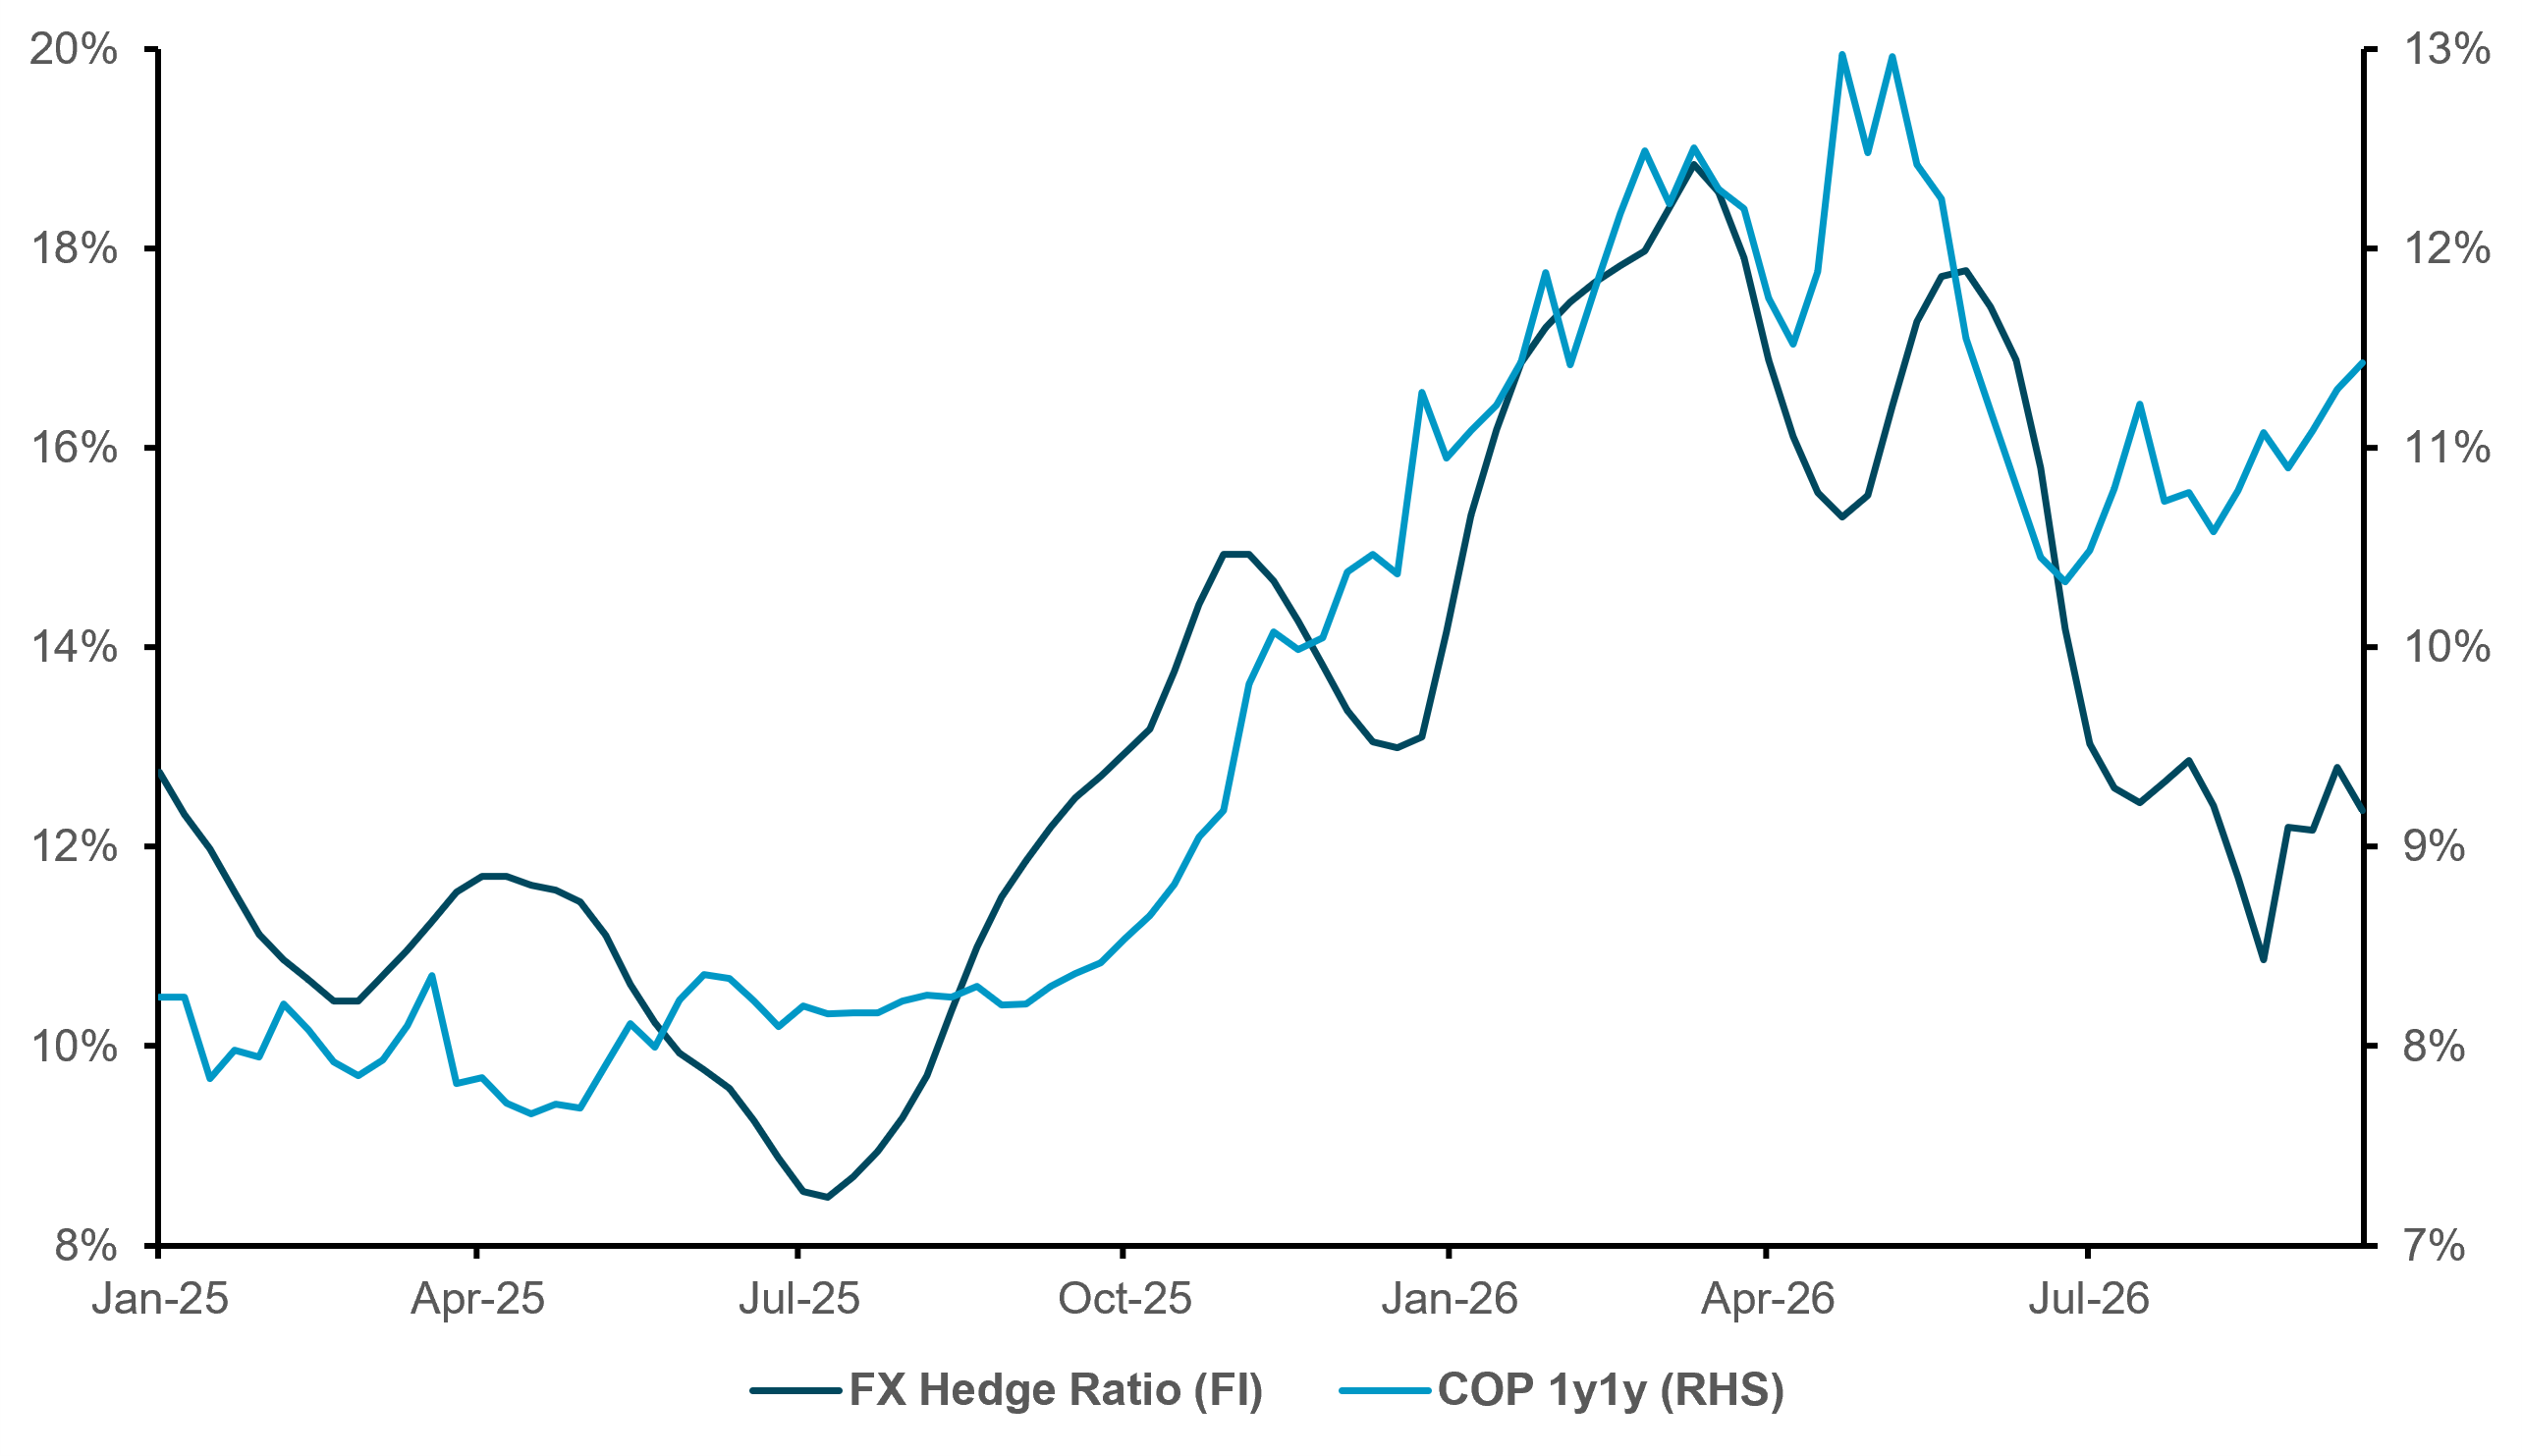
Carry leader. The Colombian peso has been iFlow’s strongest carry currency, supported by early rate hikes, favorable commodity exposure and attractive real yields. Yet stronger rates initially produced more, not less, hedging. As Colombian rates rose from July 2025 to March, hedge ratios on fixed-income positions climbed toward 20% (Exhibit 6), suggesting investors preferred to protect gains rather than add FX exposure. The relationship weakened in Q2 as both rates and hedge ratios fell, but hedging has since picked up again. With U.S. rates higher, the opportunity cost of leaving even a high-carry position unhedged has increased, a dynamic likely to persist until markets are more confident the Fed has reached its peak.
EXHIBIT #6: COP HEDGING ROSE WITH LOCAL RATES
Source: BNY as of Sept. 25, 2026, hedge ratio is for all cross-border clients*
Bottom line. Hedge ratios are currency-specific, shaped not by a single equilibrium rule but by rates, valuation, intervention risk and the wider macro regime. That is why KRW undervaluation can encourage naked exposure, JPY hedging can respond to intervention risk, and stronger COP alongside higher local rates can raise demand for protection. The dollar remains central: foreign holdings of U.S. assets are elevated while hedge ratios have fallen materially, allowing U.S. asset exceptionalism and dollar exceptionalism to reinforce each other for now.
What comes next. Hedging isn’t static. Investors may leave ratios unchanged for long periods, then react quickly when valuations, rates or policy risks reach extremes. As global tightening cycles mature and rate differentials peak, hedge adjustments are likely to become a more important source of FX flows even without major changes in asset holdings. iFlow Hedge Ratios provide a new, trackable framework for monitoring those shifts and informing investment and risk-management decisions.
Beyond the basics. The core intuition behind the indicator is simple, but the underlying implementation requires additional choices, especially for multi-asset portfolios. We separate those details here to keep the main body focused on the investment message.
Pairwise construction. The indicator is built at the client and currency level. It identifies the investor’s base currency, the currency denomination of foreign securities holdings, and the associated FX forward and swap positions. Hedge ratios are calculated for each base-currency/asset-currency pair and can then be aggregated across investors.
Coverage detail. The framework covers 34 currencies and therefore 1,122 possible cross-border relationships between investor base currencies and asset currencies. Not all relationships will print consistently, as publication remains subject to data-density tests and custody coverage varies across jurisdictions.
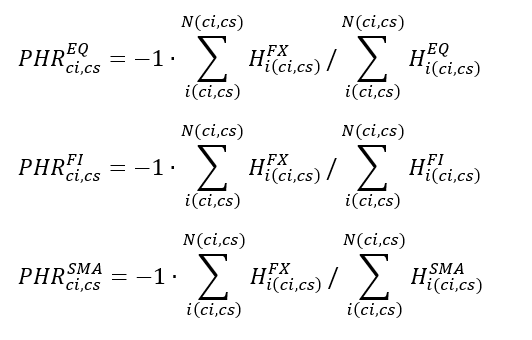
EXHIBIT #7: PAIRWISE HEDGE RATIO FORMULAS
Source: BNY Analytics. “ci” and “cs” denote investor base and securities currency, respectively; “EQ,””FI,” and “SMA” denote equity, fixed-income and multi-asset portfolios, respectively.*
Positive and negative readings (Exhibit 7). At a high level, the hedge ratio is defined as -1 times FX exposure divided by security exposure. The ratio is usually positive because the FX position offsets the currency exposure embedded in the asset holding. A ratio near 100% indicates that nearly all exposure is hedged. A ratio above 100% indicates overhedging. A negative ratio indicates that the FX position adds to, rather than offsets, the asset exposure.
The multi-asset issue. The most difficult problem arises when an account holds both equities and bonds. In those cases, the observed FX position hedges the combined currency exposure of the portfolio rather than being explicitly tagged to one asset class. The multi-asset hedge ratio is directly observable, but asset-class-specific hedge ratios require an allocation rule.
Alternatives considered. We considered several approaches. A simple value split would allocate the FX hedge in proportion to equity and bond holdings, but that would assume both asset classes are hedged in the same way. That’s inconsistent with market practice, where fixed income is generally hedged more heavily than equities. Fixed long-run hedge assumptions would capture this structural difference but would not respond to changing market conditions. A bond-first rule would reflect some common behavior yet systematically overstate bond hedging and understate equity hedging.
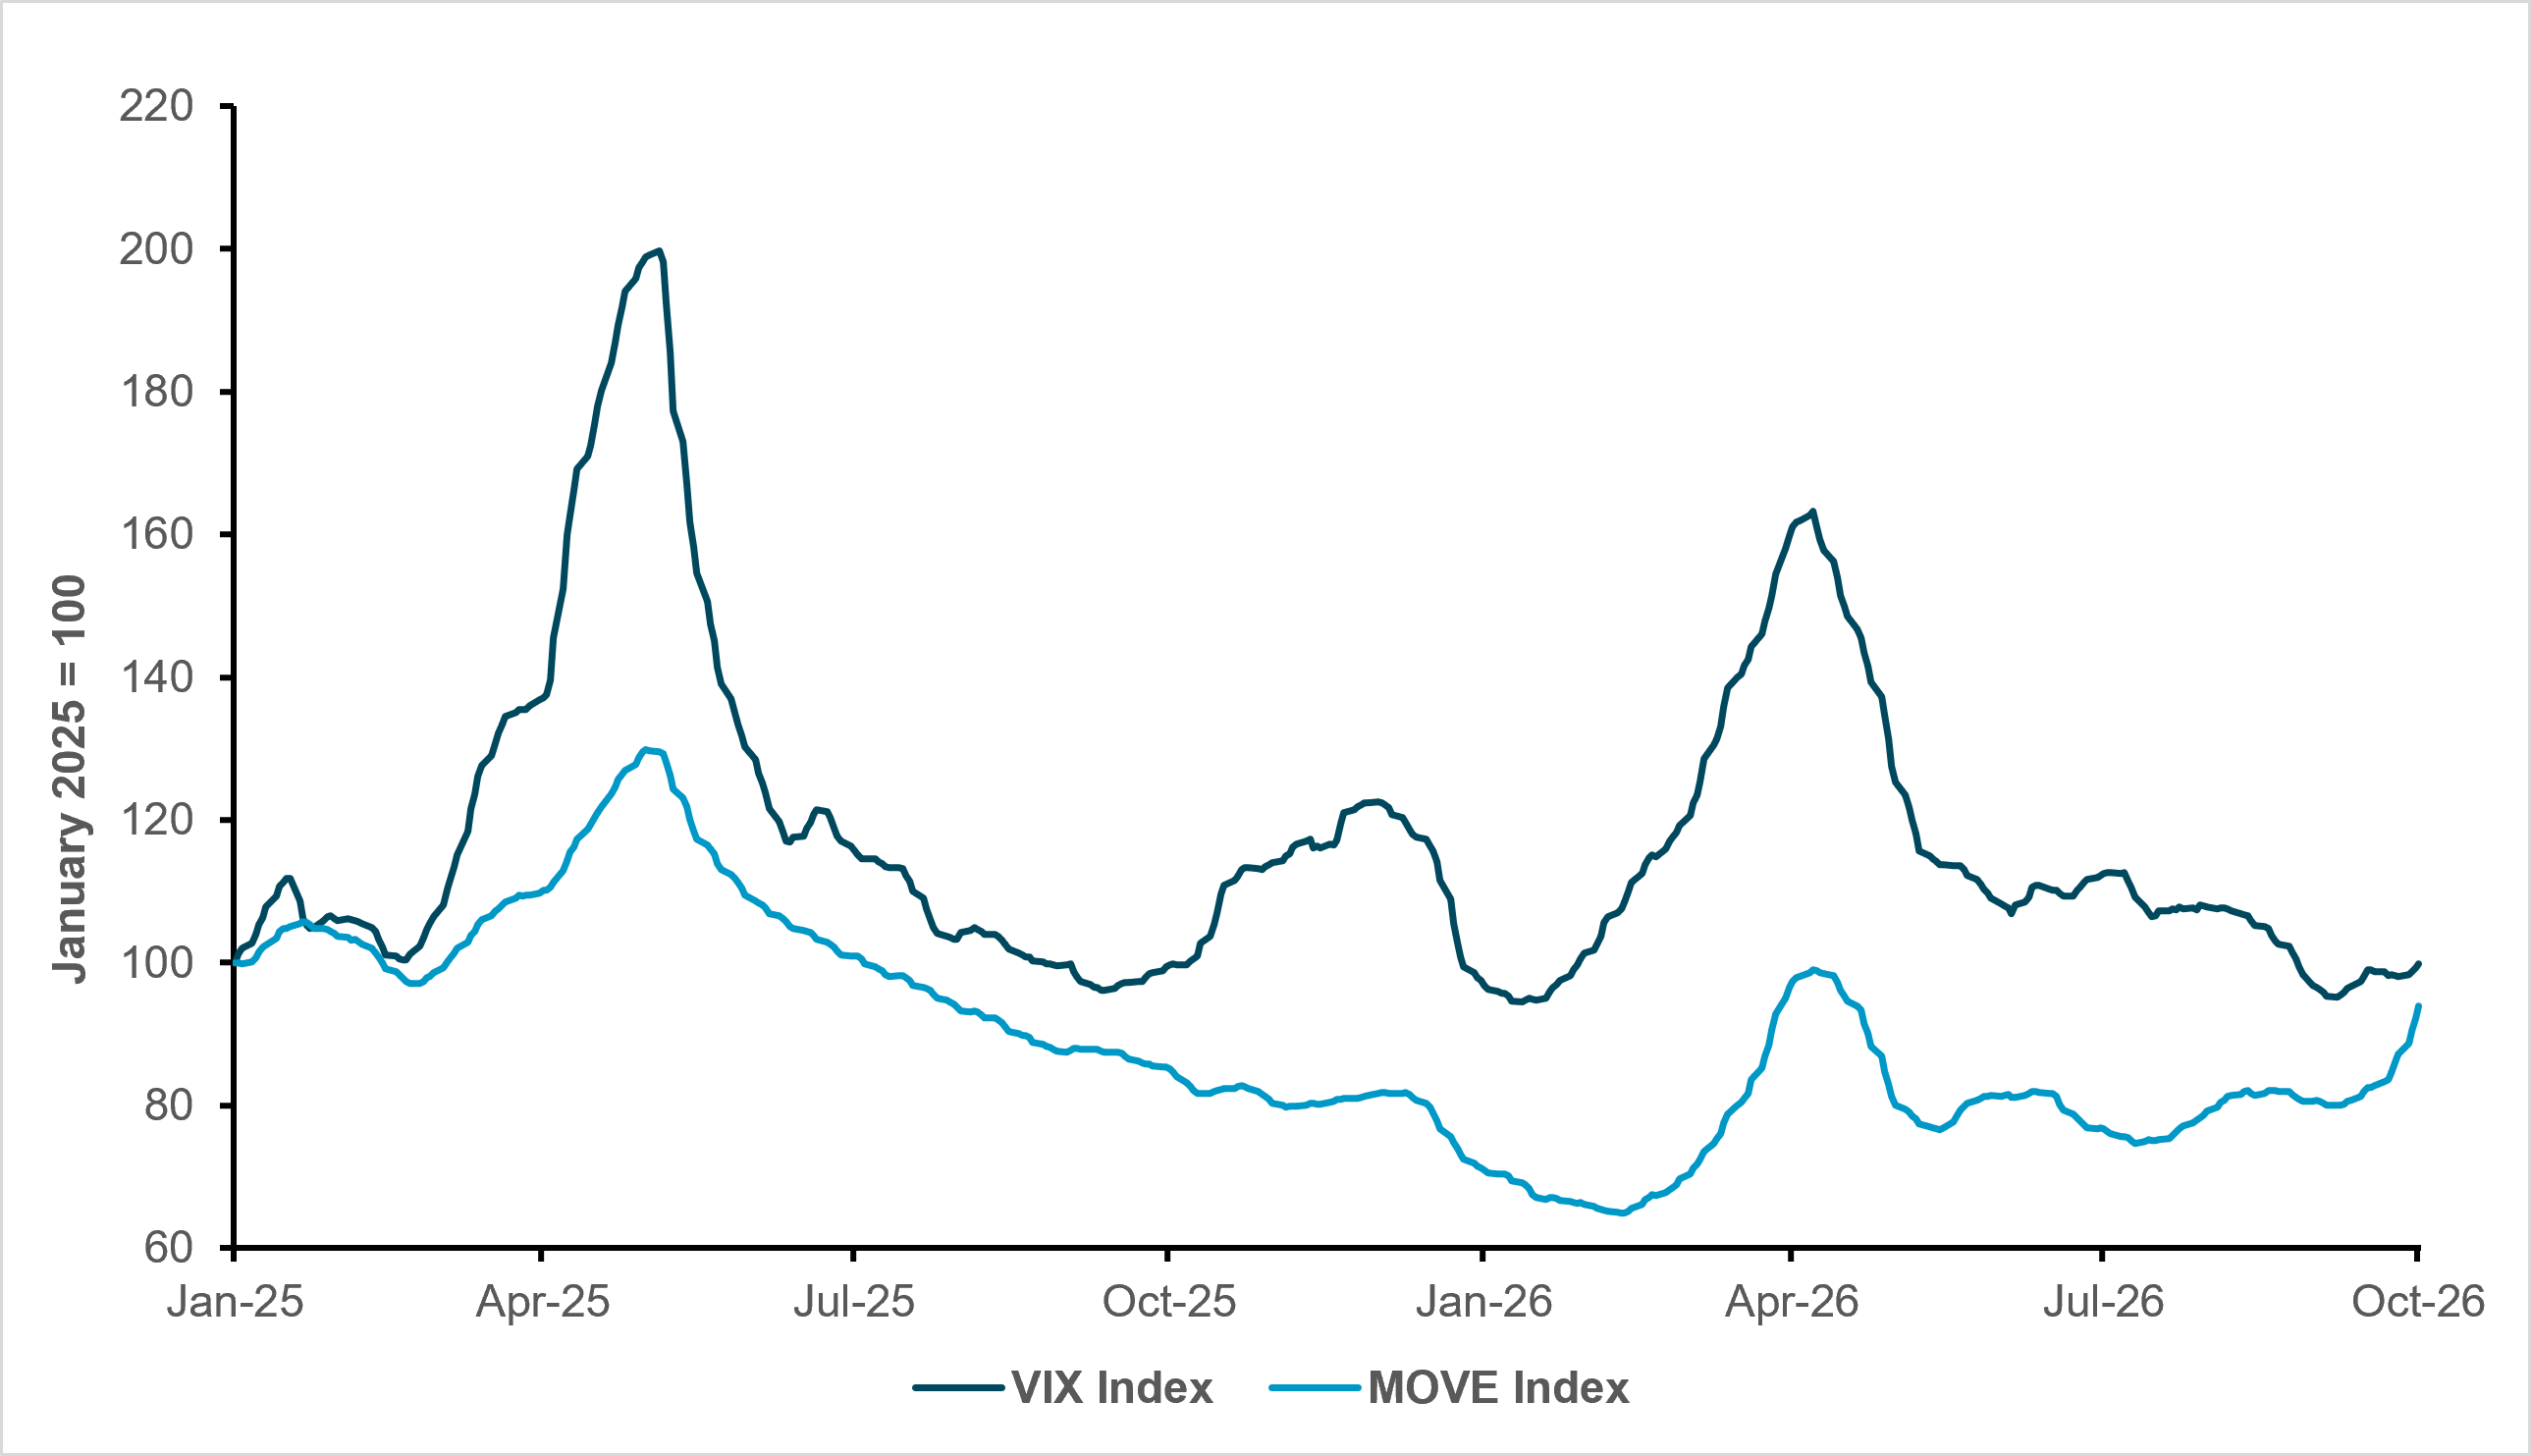
Our approach. We therefore use a volatility-adjusted allocation. The method begins with the portfolio’s observed split between equities and bonds, then adjusts that split using recent market volatility (Exhibit 8). Equity volatility is proxied by the one-month trailing average of the VIX, while fixed-income volatility is proxied by the equivalent average of the MOVE index. The allocation is recalculated daily as both market conditions and portfolio composition change.
EXHIBIT #8: VIX AND MOVE INDICES, ONE-MONTH TRAILING AVERAGE
Source: BNY as of Sept. 25, 2026, Bloomberg*
Economic intuition. The intuition is that FX risk matters less, in relative terms, when the underlying asset itself becomes more volatile. If equity volatility rises relative to bond volatility, a smaller share of the common FX hedge is allocated to equities. If bond volatility rises relative to equity volatility, a smaller share is allocated to bonds. Conversely, currency risk matters more to the total risk of a comparatively stable asset class, so that asset class receives a larger share of the hedge.
Strengths and limits. This method is more realistic than a simple value split because it reflects both actual portfolio composition and the fact that fixed income is usually hedged more heavily than equities. At the same time, it remains a modeled estimate. The VIX and MOVE are broad proxies, the one-month window is a simplifying choice, and the method doesn’t explicitly capture changing asset-FX correlations. We nevertheless believe it strikes a practical balance between simplicity, responsiveness and interpretability.
Final output. The initial framework produces value-weighted hedge ratios for equities, fixed income and combined multi-asset portfolios. Each series is available in pairwise and aggregate cross-border form. Results can also be compared across equity-only, bond-only and multi-asset accounts, with single-asset portfolios providing a useful benchmark for judging whether the estimated split in multi-asset portfolios is behaving sensibly.
*Charts are provided for illustrative purposes and are not indicative of the past or future performance of any BNY product.
** The case study described has been provided for illustrative purposes only and was based solely for the purpose of describing the investment processes and analyses used to evaluate such asset. Nothing contained herein should be construed as a recommendation to buy or sell any security.