Inflation sweet spot for equities
iFlow > Equities
An in-depth look each Friday at the factors shaping equities markets in developed and emerging economies around the world.
iFlow > Equities
An in-depth look each Friday at the factors shaping equities markets in developed and emerging economies around the world.

Bob Savage
Time to Read: 5 minutes
Copper and gold reached new highs again this week, highlighting renewed interest in real assets as a favored trade in 2026 portfolios. There is a significant similarity to 2025, when Fed rate cut expectations were pushed further out and scaled back due to above-trend growth. What’s different is the effect on equities. The January 21 highs from last year now appear unlikely to be repeated. Hedging against further USD weakness, rising inflation risks and increased U.S. asset volatility is driving global equity trading.
There is also a significant yield-chasing trade underway, with high-yield bonds replacing cash as a key fixed income holding. Consensus views on U.S. policy and economics drive much of these trades, with sticky inflation expected between 2.5% to 3.0%, above-trend growth at 2% or higher, ongoing labor market uncertainty, and FOMC expected to cut rates two to three times. Fiscal policy uncertainty competes with monetary uncertainty in U.S. markets, adding to confusion around the equity outlook. One argument for the current asset allocation bias suggests that equities outperform bonds in a higher inflation environment. The relationship between equity performance and inflation is not straightforward.
The pass-through ability of companies is better measured by margins, which will logically become a key focus for Q4 and Q1 earnings in the weeks ahead.
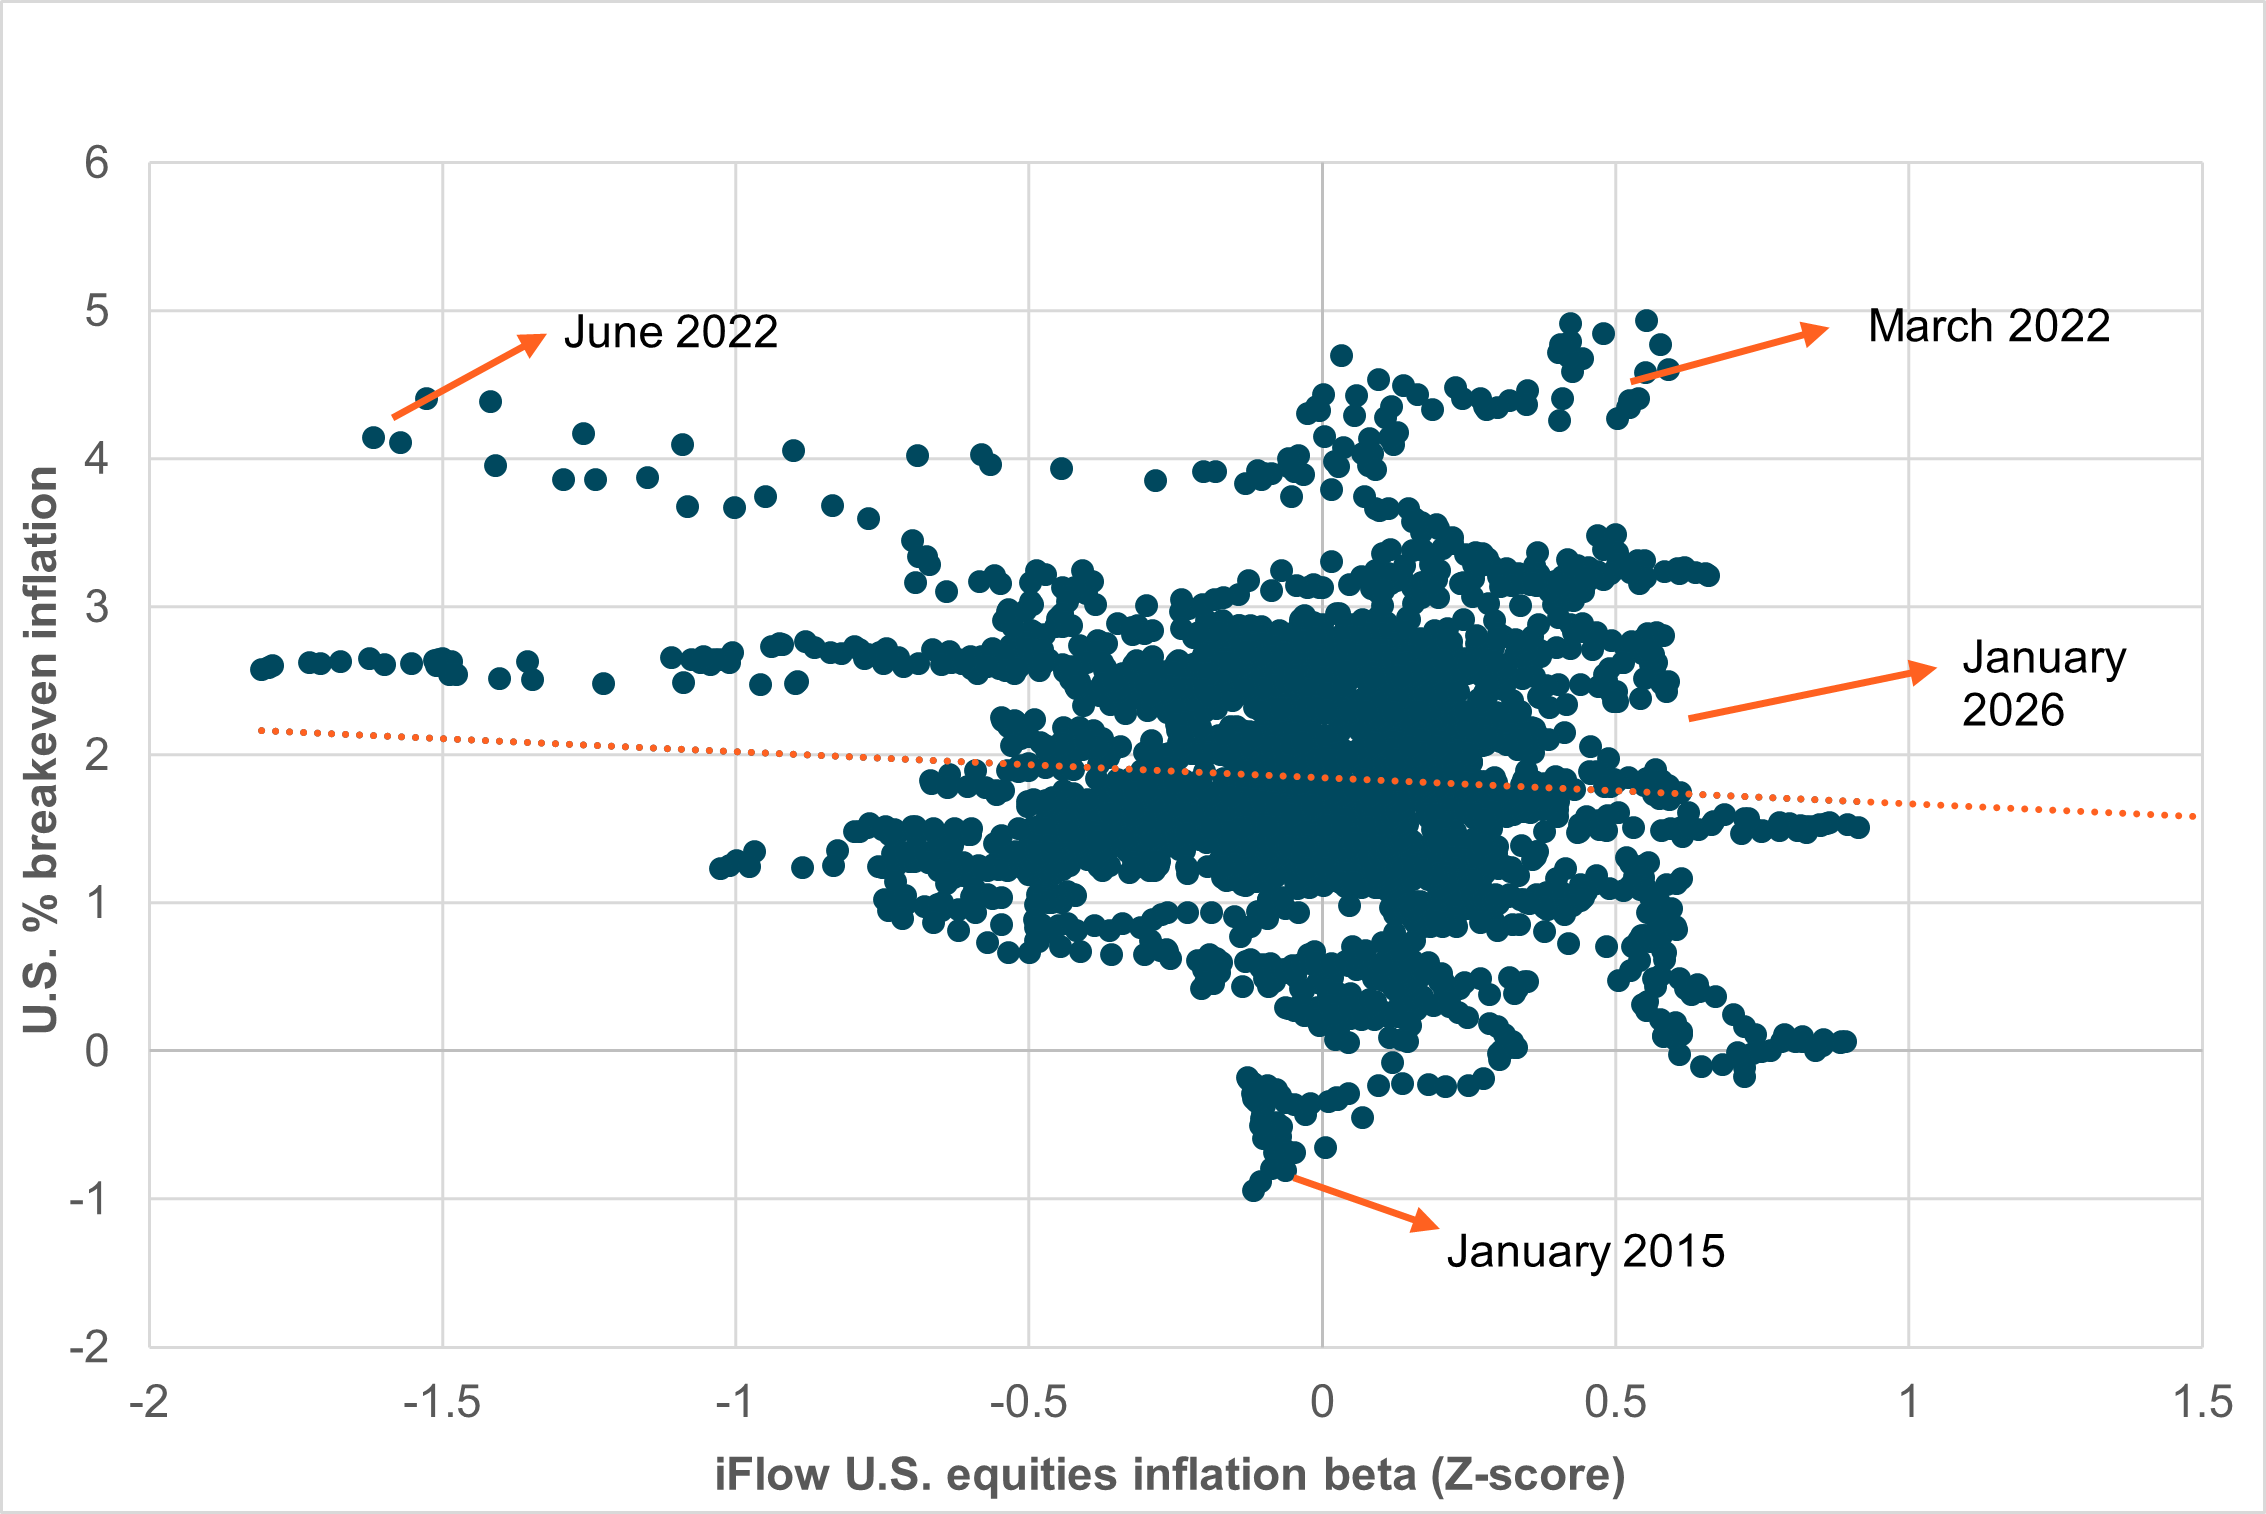
EXHIBIT #1: U.S. EQUITIES AND INFLATION
Source: BNY, Bloomberg
Our take
The relationship between the inflation beta of investors, as shown in iFlow relative to the breakeven inflation swaps, is not consistent when inflation drifts from the 2% target. Over the past 14 years, the relationship between higher inflation and equities has been negatively correlated. Significant long-tailed underperformance tends to occur when both inflation and Fed credibility are at risk.
The current environment represents a sweet spot for equities, with inflation below 3% and positive flows into companies that benefit from rising prices for goods and services.
Forward look
A stark flip-flop in inflation positioning between March and June 2022 highlights the shift in FOMC rate policy at the beginning of its tightening cycle. If the Fed shifts from an easing or neutral bias to a tightening stance and inflation continues to rise, inflation risks could begin to drag on equity performance. Inflation surprises are another key risk, as market reactions are compounded by the speed of change, the size of positions and the magnitude of the shock.
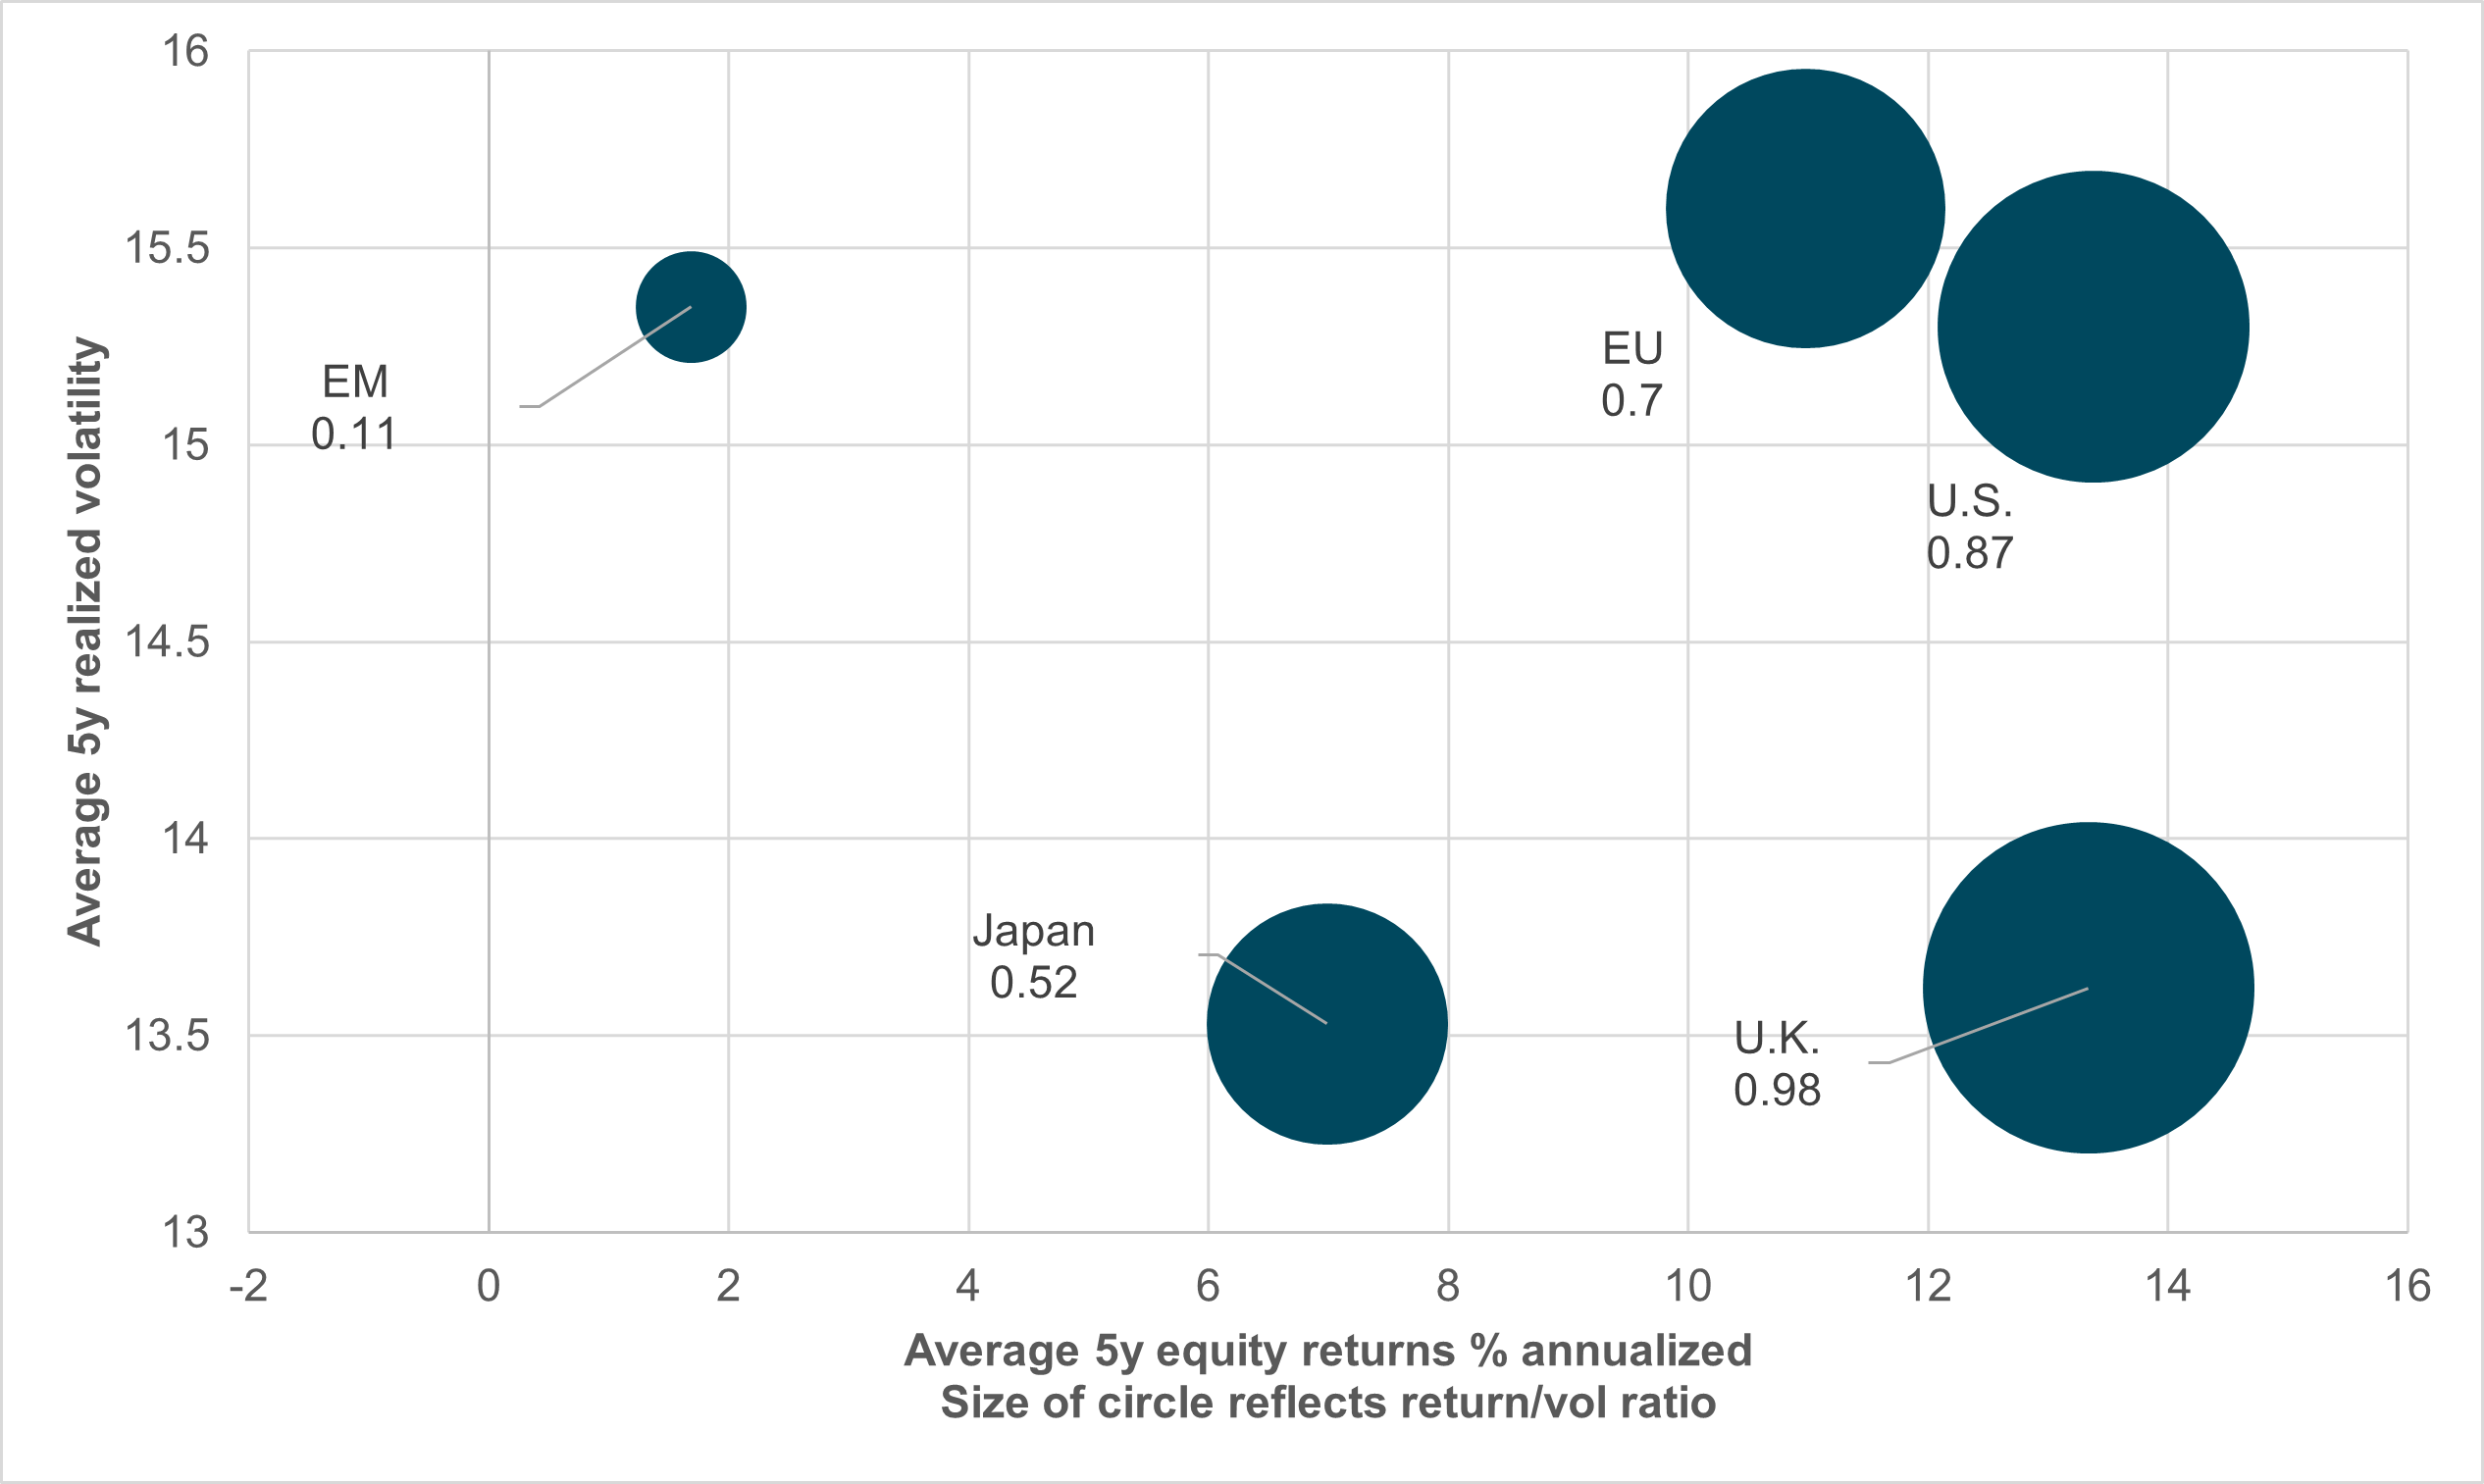
EXHIBIT #2: RETURN TO VOLATILITY
Source: BNY, MSCI
Our take
Comparing annualized return to actual volatility across equity-indexed national returns provides useful insights into 2023–2025 market performance. From 2023 to 2025, the S&P 500 consistently delivered the highest risk-adjusted returns among major global benchmarks. When annual performance is normalized by realized (close-to-close) volatility, the index scoring approximately 1.3 in strong years like 2023–2024, but declined toward 0.9 in 2025 as volatility rose.
Japan’s Nikkei posted solid cyclically strong returns in 2023, albeit with elevated volatility. The U.K.’s FTSE 100 delivered the highest volatility-adjusted return in 2025, benefiting from exceptional gains and restrained realized risk that year. European equities (Euro Stoxx 50) and Emerging Markets (EM) delivered consistently lower ratios, reflecting more muted annual performance and greater dispersion in realized volatility. EM in particular lagged due to continued geopolitical and idiosyncratic headwinds and remains structurally disadvantaged by higher gaps and tail risk linked to liquidity and price discovery factors.
Overall, the data suggest regionally differentiated cyclical drivers: defensive and value-oriented exposures (U.K., Europe) outperform in high-volatility regimes, while growth-oriented markets (U.S. tech and Japan) generate superior risk-adjusted outcomes when volatility is moderate.
Forward look
A stark flip-flop in inflation positioning between March and June 2022 highlights the shift in FOMC rate policy at Consensus for 2026 shows significant flows into EM equities and Japan, while the U.S. and EU are lagging. U.K. returns have outperformed in part due to the FTSE’s correlation with commodities. While the forward view for 2026 is still forming, there has already been a clear rotation toward mean reversion and convergence returns.
Value factors also benefit from carry expectations, which are linked to bond and FX stability, another factor for asset allocation globally. The bias against the USD seen in 2025 has been less apparent in 2026, and this may be contributing to the momentum chasing in equities.
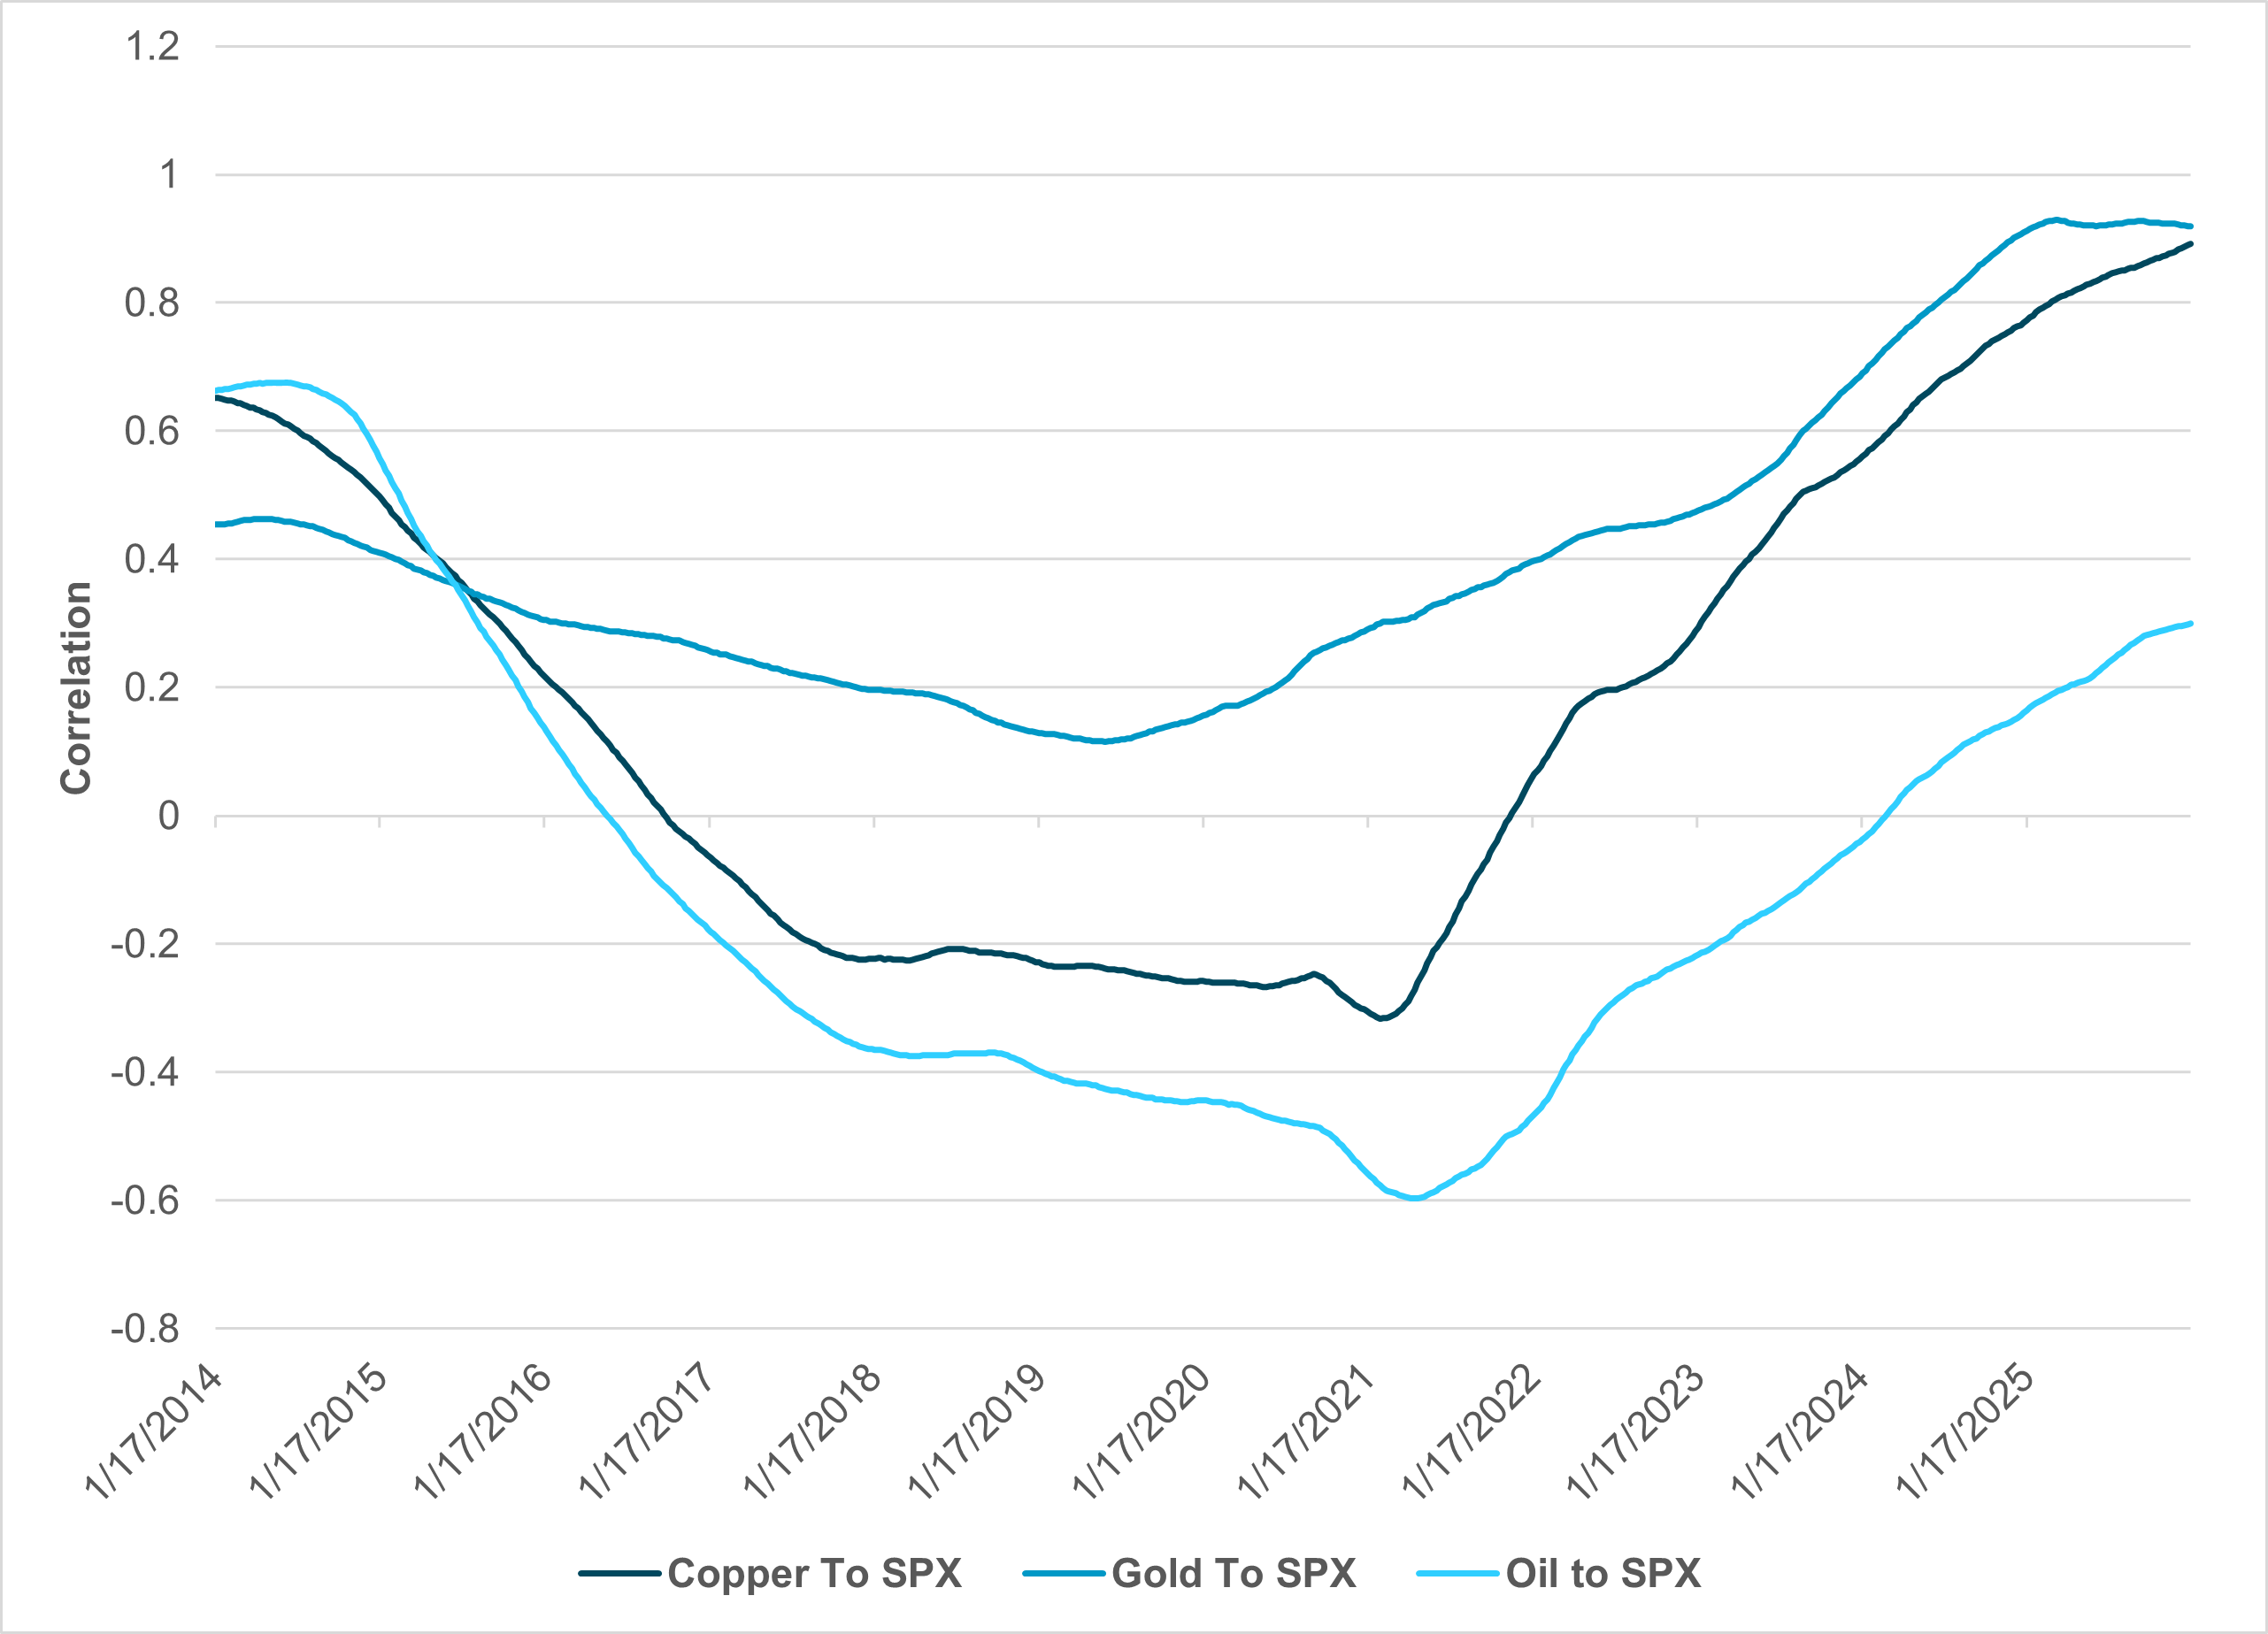
EXHIBIT #3: WEEKLY CORRELATION OF OIL, GOLD AND COPPER TO THE S&P 500
Source: BNY, Bloomberg
Our take
Since COVID, the relationship between commodities and the S&P 500 has changed. The U.S. relationship with oil has shifted from importer to exporter. The importance of gold changed with inflation, debt concerns and, more recently, a weaker USD. The role of copper has become increasingly important, as it is linked to supply, technology and tariffs. The biggest shift in correlation has been in oil, where U.S. drilling and inventories mattered in 2014 but proved insufficient during gasoline and COVID-related supply disruptions. Correlations above 0.35 or below -0.35 indicate that current commodity-equity relationships resemble the super-cycle squeezes seen during quantitative easing, China’s real estate boom and inflation expectations.
Forward look
The link between copper and the S&P500 is no surprise – there is a 100-year history of “Dr. Copper” signaling equity returns. The problem is that copper and gold, now at historic highs, are part of the current risk environment and highly correlated with equities, no longer acting as inflation hedges. Correlations above 0.7 mean copper and gold now function as momentum factor risks in markets. Pullbacks in commodities may signal lower inflation expectations or shifts related to the USD. For non-U.S. investors, hedging the dollar risk could become more important in 2026, as fiscal and monetary policy uncertainty persists globally. For now, Dr. Copper is more a cheerleader for risk than a hedge.
Looking ahead to 2026, equities remain positioned at a critical intersection of inflation dynamics, policy uncertainty, and shifting global leadership. The current environment – characterized by inflation hovering below 3% and growth holding above trend – continues to represent a relative “sweet spot” for equity performance. However, this balance is fragile. Equity outcomes will increasingly hinge on companies’ ability to preserve margins rather than simply pass through higher prices, placing earnings quality and pricing power firmly at the center of investor focus. Investment in AI to drive productivity gains will be critical to the S&P 500’s performance versus the rest of the world.
At the same time, commodities have transitioned from portfolio hedges to active participants in equity momentum. Elevated correlations between equities, copper, and gold suggest that real assets are amplifying risk rather than insulating portfolios from it. This raises the importance of monitoring volatility regimes and policy signals, especially if inflation surprises re-emerge and the Fed shifts from a neutral or easing bias toward renewed tightening.
Regionally, the convergence trade is gaining traction. Flows into Japan and Emerging Markets signal growing confidence in cyclical recovery and valuation normalization, while the U.S. faces higher hurdles as volatility rises. In this environment, equity investors will need to be more selective, favoring sectors and regions aligned with stable policy, resilient earnings, and disciplined balance sheets as momentum, rather than duration, drives return.