Soft Landings and Hard Walls of Worry for 2026
iFlow > Equities
An in-depth look each Friday at the factors shaping equities markets in developed and emerging economies around the world.
iFlow > Equities
An in-depth look each Friday at the factors shaping equities markets in developed and emerging economies around the world.

Bob Savage
Time to Read: 4 minutes
Investors are starting to worry more about 2026 than celebrating 2025, focused on what could go wrong – part of the balancing act of year-end trading and allocations. Next year presents a convergence of macro stability and micro fragility. While consensus expects a soft landing with steady inflation and solid earnings per share (EPS) growth, the market’s leadership remains highly exposed to capital-intensive AI buildouts, digital-asset-linked treasury risks, and election-driven policy volatility.
For equity risk managers, this environment argues for early portfolio inoculation rather than reactive hedging: maintaining disciplined exposure sizing in mega-cap tech, reinforcing liquidity buffers, and increasing the use of convex hedges into key event windows. The path to 2026 may still validate the soft landing narrative, but the distribution of outcomes is widening. Protecting against left-tail scenarios will be as important as harvesting right-tail momentum.
Consensus for 2026 U.S. equity performance continues to be upbeat. EPS is seen up 12–15%, and S&P 500 targets are centered around 7,500, with less dispersion than in 2025. The oddities are in CPI at 2.7% with no real movement, while GDP is back to long-term trend at 1.8%. In macro terms, investors are being guided to expect a soft landing for the economy again.
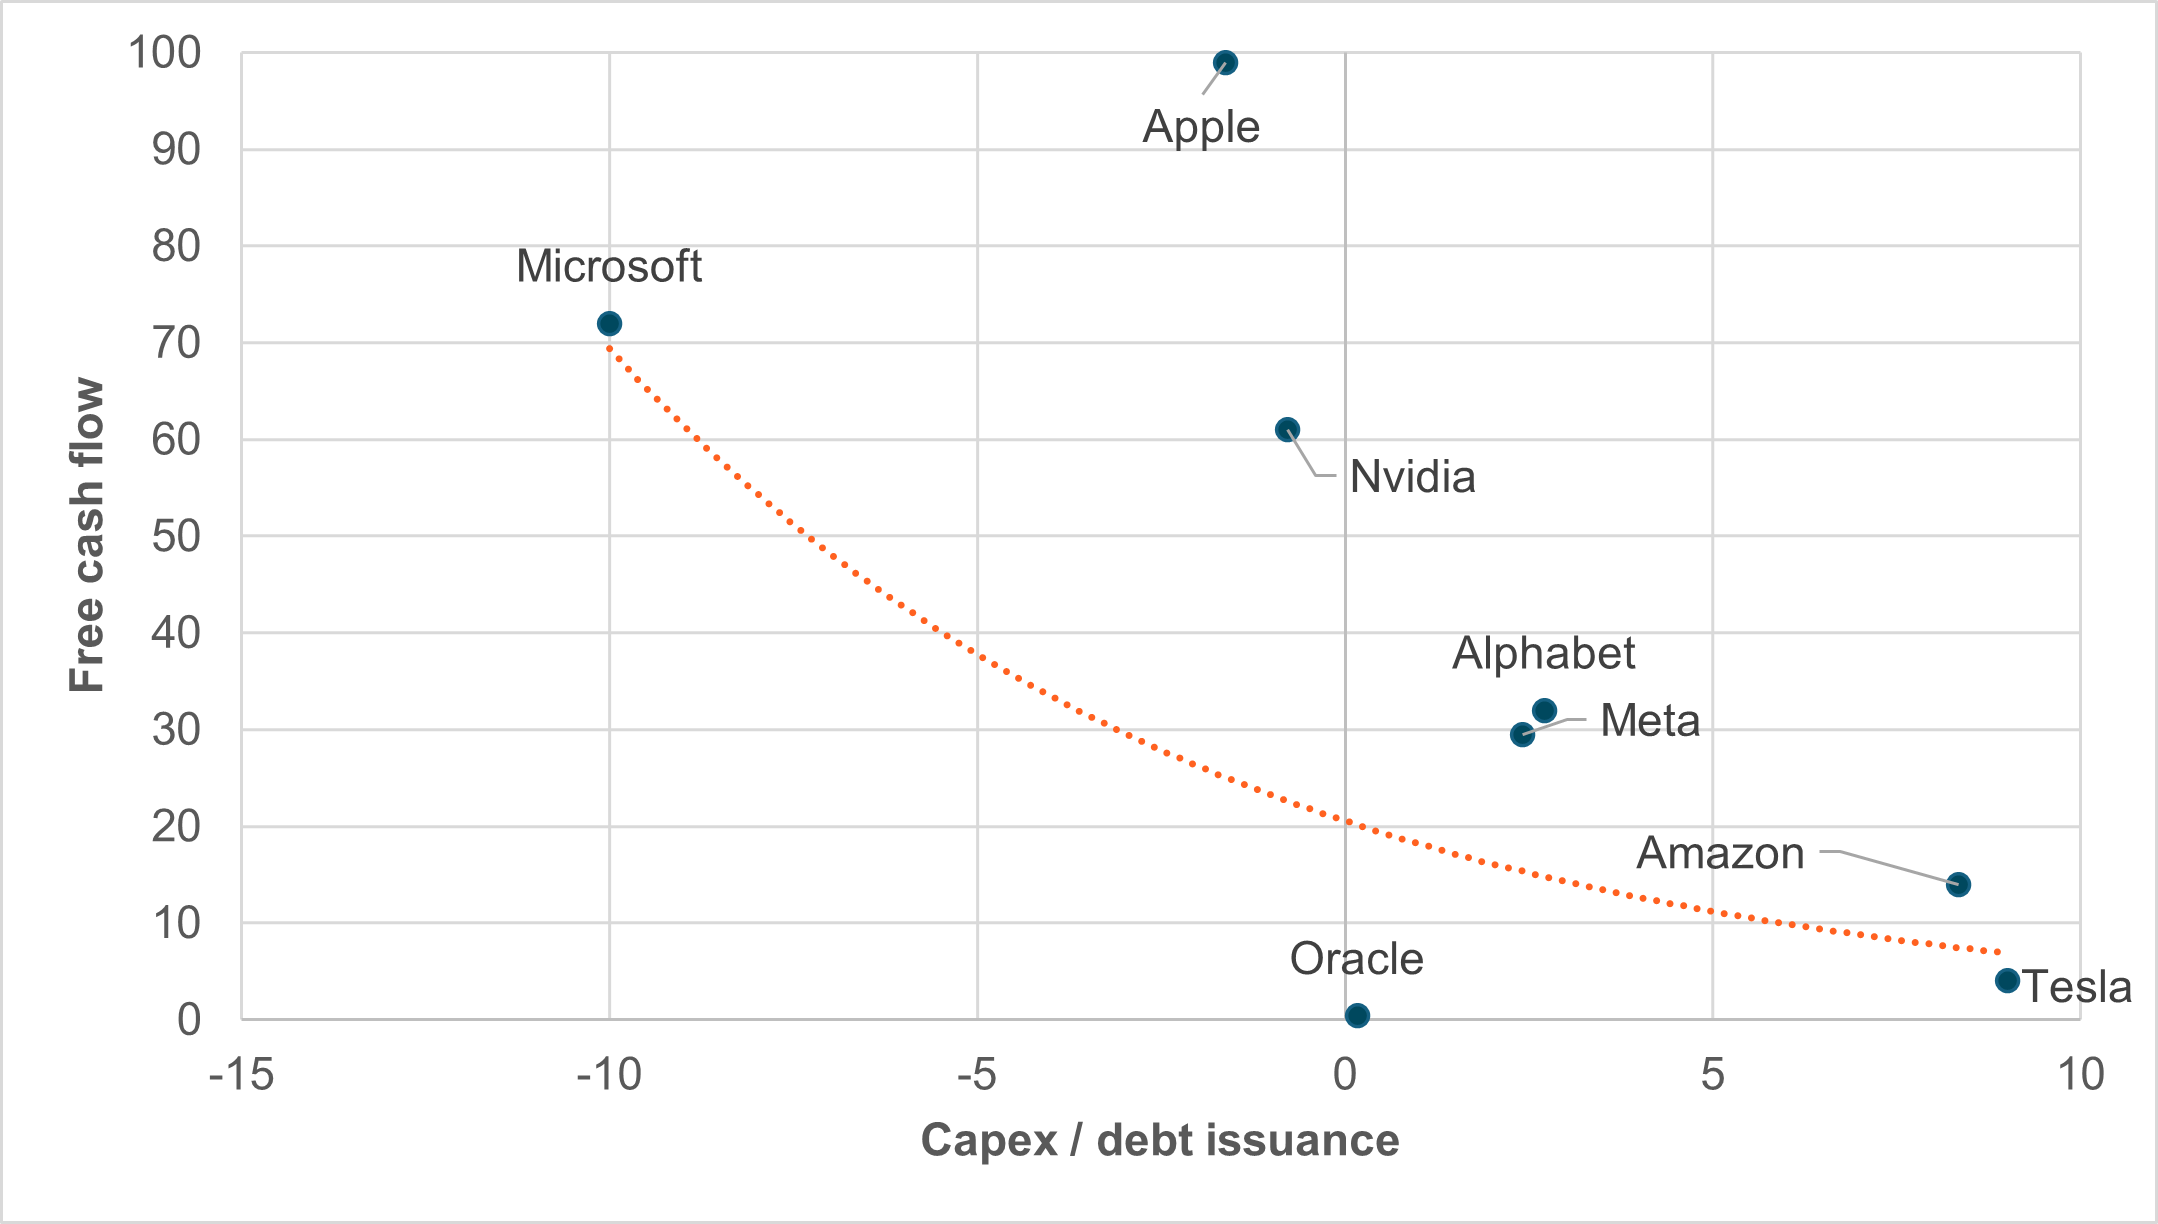
The hyperscaler-led AI capex boom is increasingly funded by debt, raising sensitivity to higher borrowing costs and margin compression. With forward price-to-earnings (P/E) ratios for mega-cap tech near 30x and 2026 consensus earnings already optimistic, the sustainability of AI-driven equity leadership is now a central risk.
EXHIBIT #1: HYPERSCALERS’ FREE CASH FLOW AND CAPEX/DEBT ISSUANCE
Source: BNY, Bloomberg
Our take
To fund investments in AI, hyperscalers have tapped free cash flow or issued debt. For comparison, we included Oracle, which has recently been linked to debt concerns. Markets are eyeing a return on investment in 2026 and the cost of further borrowing. The demand for capital to build data centers, buy new chips, and invest in AI large-language models (LLMs) or other related industries has not stopped, but the ability to continue at the same pace will be linked to the cost of capital and earnings in 2026. The forward P/E of the Magnificent 7, ex-Tesla, is near 30, far above value investor comfort levels.
Forward look
Should margins decrease or the cost of borrowing rise, the AI investment boom will necessarily slow. This will hit U.S. GDP and may trigger reactions from the government or the Federal Reserve. The timing of the feedback loop will be critical to how equities trade. Monetary policy for 2026 is already seen as supportive of lower rates, but at some point, other factors – like term premiums, government deficits squeezing out the private sector, and future tax risks – will kick in. The AI bubble concerns all relate to whether investments can be sustained until returns justify the spending.Worth noting: This year’s shift flips China and India compared with the same rebalance 12 months ago, when India gained 45bp and China lost 10bp.
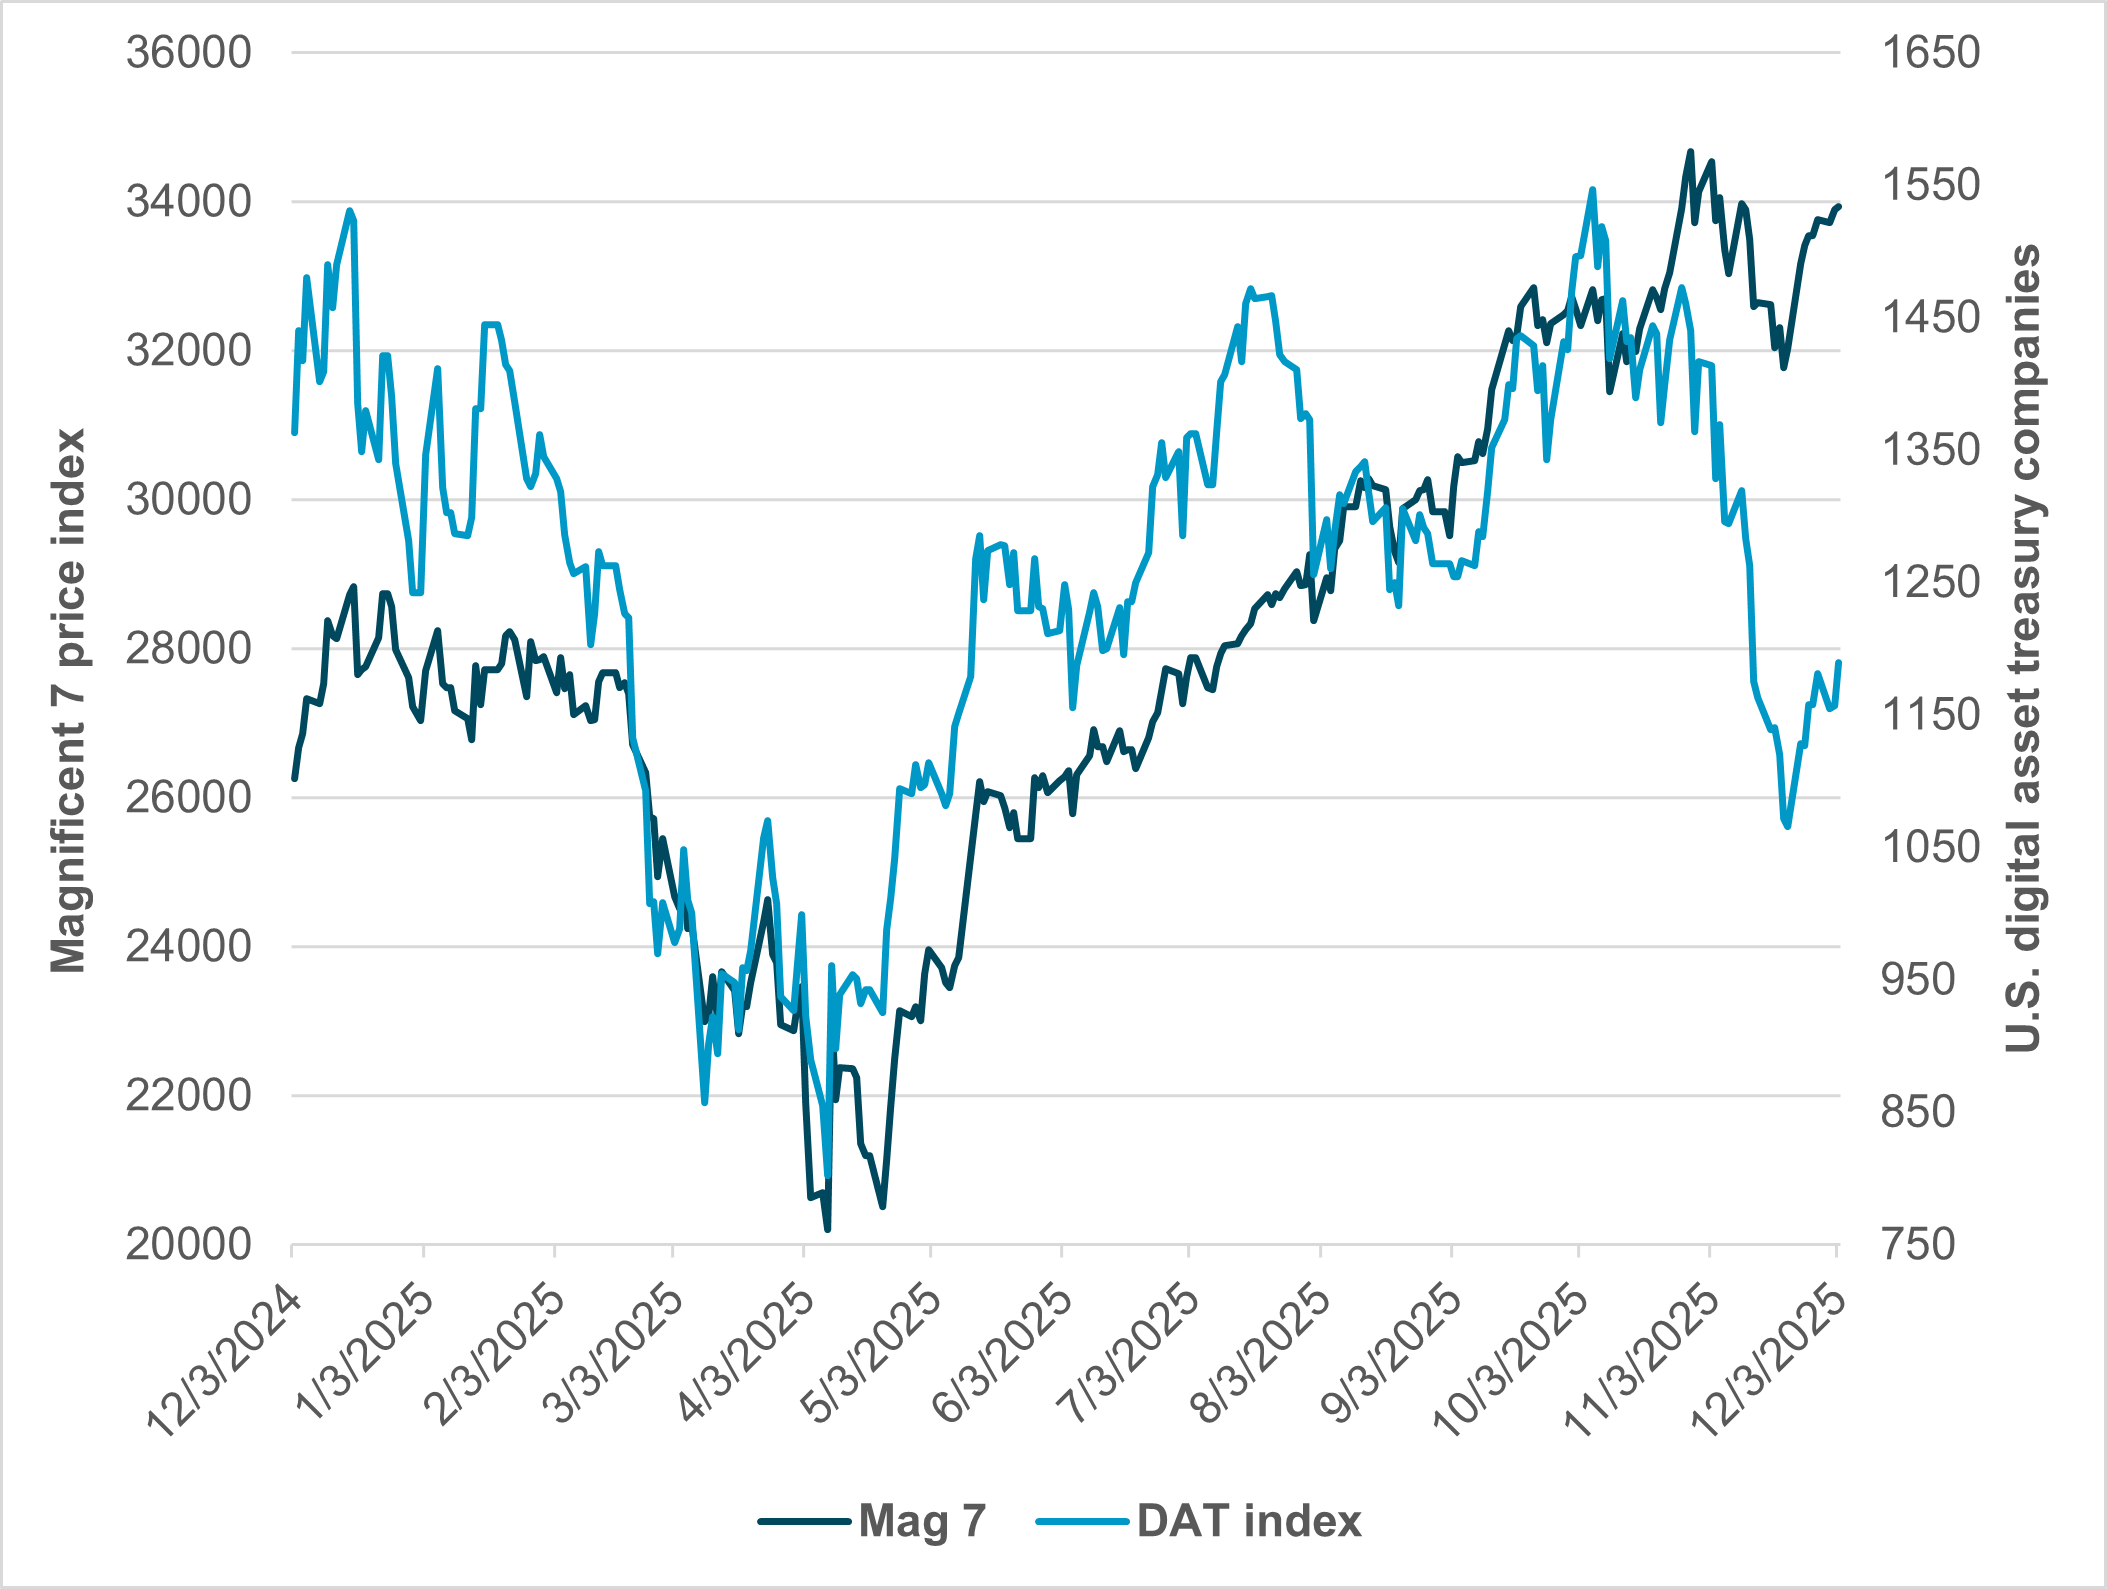
The sharp position unwind in bitcoin (BTC) exposed growing fragility for firms using digital assets as treasury tools and highlighted an emerging macro-liquidity linkage between crypto and technology equities. Electricity demand and USD-value dynamics increasingly bind AI infrastructure and bitcoin mining into a shared risk ecosystem.
EXHIBIT #2: COMPANIES WITH SIGNIFICANT BTC ON BALANCE SHEET VS. MAG 7
Source: BNY, Bloomberg
Our take
The correlation of bitcoin to technology shares was positive until November. The 30%-plus move down in bitcoin did coincide with a derisking in global equities, led by technology, but the size of the decline sparked talk of a crypto winter. The negative correlation stands out and suggests that other factors – such as liquidity and Fed policy – matter more to bitcoin than to the hyperscalers’ AI investment boom. The worry about digital asset treasury business models unraveling appears greater than fears of the AI bubble bursting.
Forward look
The shared USD valuation link is the common ground for U.S. tech and bitcoin. A weaker USD helps the Magnificent 7’s foreign revenue, while driving alternatives to the dollar. The connection between bitcoin and large-cap tech extends to electricity demand. The investments in AI and the data centers needed to compete for dominance have left the two assets interlinked, and political risks may rise as electricity affordability becomes a key issue for 2026. Together, they make for exponential volatility ahead. The key level for bitcoin break-evens in digital asset treasuries is around $75,000, while the baseline limit for mining new bitcoin supply is $50,000.
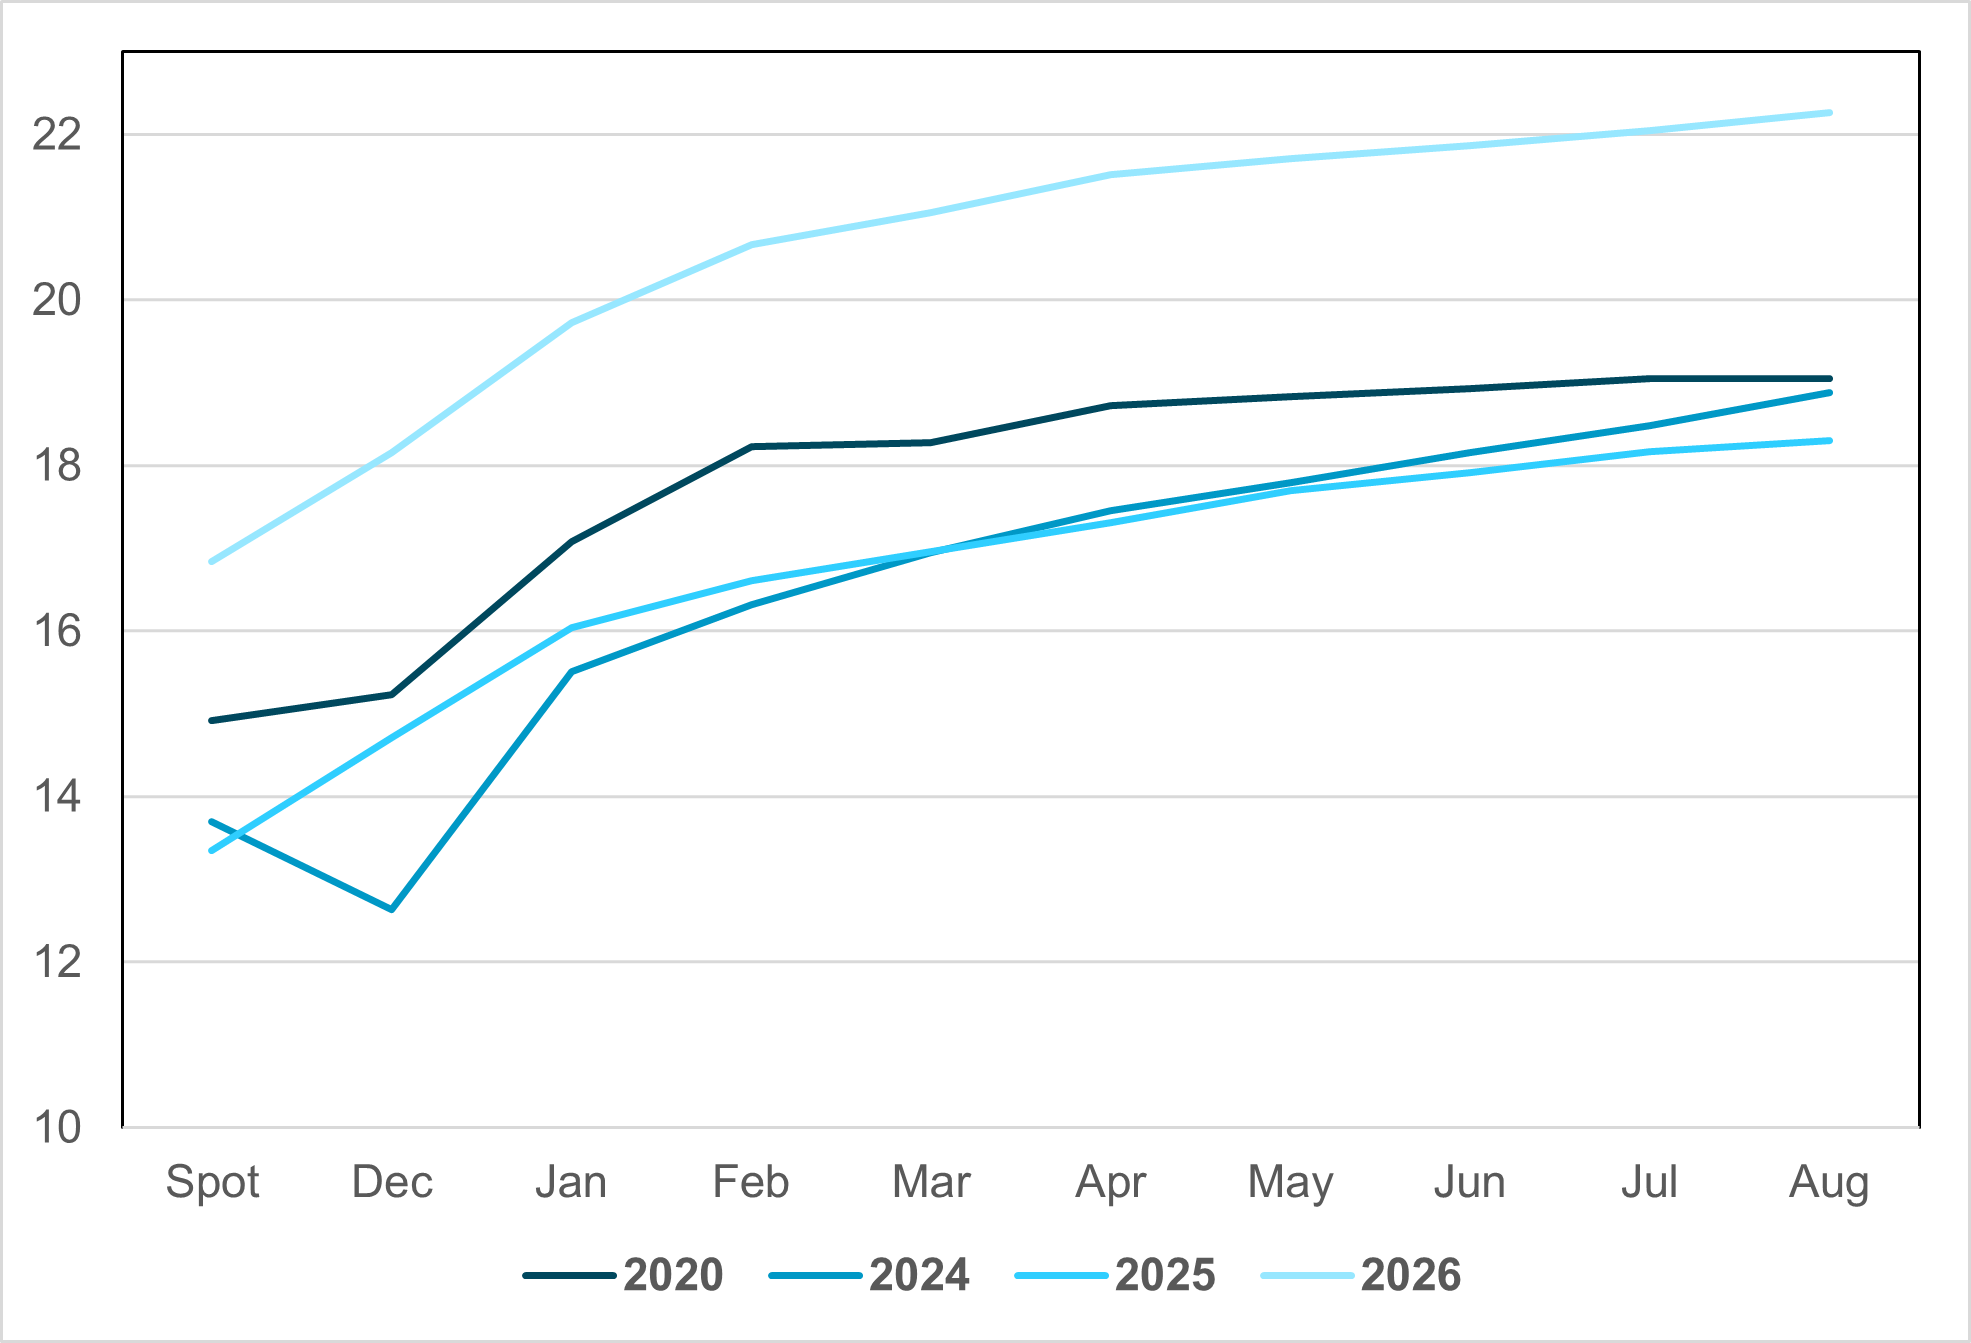
Early signs of 2026 political risk are visible in the VIX curve. Historically weak pre-midterm equity performance, low competitiveness in House of Representatives seats, and macro-sensitive voter behavior all point toward elevated volatility around fiscal, regulatory and geopolitical shocks.
EXHIBIT #3: VIX CURVE SHOWS MARKET ALREADY PRICES IN ELECTION RISK AND MORE
Source: BNY, Bloomberg
Our take
The political risks are notable for 2026, and the VIX curves show that the 2020 and 2024 elections were not as feared as the midterms ahead. Historically, the 12 months leading up to midterm elections have been weak, with 5% or lower returns, reflecting policy uncertainty and shifting congressional control probabilities. One notable trend: GDP and CPI have no consistent election seasonality. What seems clear is that all efforts by the controlling party to fix the economy work only if implemented early. Even then, it’s an uphill battle – with midterms only won three times by a controlling party since the Civil War, in 1934, 1998 and 2002. Winning both the House and Senate is even rarer, having happened only twice. The data show the sitting president’s party loses an average of 26 to 28 seats in the House and three to four seats in the Senate during a midterm election cycle. The VIX curve for 2026 has priced in policy changes and more.
Forward look
The odds that Democrats take control of the House in 2026 are 76%. The odds that Democrats sweep both the House and Senate are 37%. Another thing to understand about U.S. midterm elections is that only about 10% of House seats are truly competitive. The key factors driving midterm outcomes are: 1) the president’s approval rating, 2) economic conditions, and 3) outside shocks (such as weather, health or war). Monetary policy in midterms has also been important in U.S. history. Economic expansions typically end due to FOMC tightening rather than age alone. Academic research provides key insights into the economic effects surrounding midterm elections. Specifically, changes in GDP growth, inflation, unemployment and stock market returns in the year leading up to an election influence voter behavior. The VIX currently prices in this risk, and that protection looks expensive. Expect polling to become a key part of trading risk into 2026.
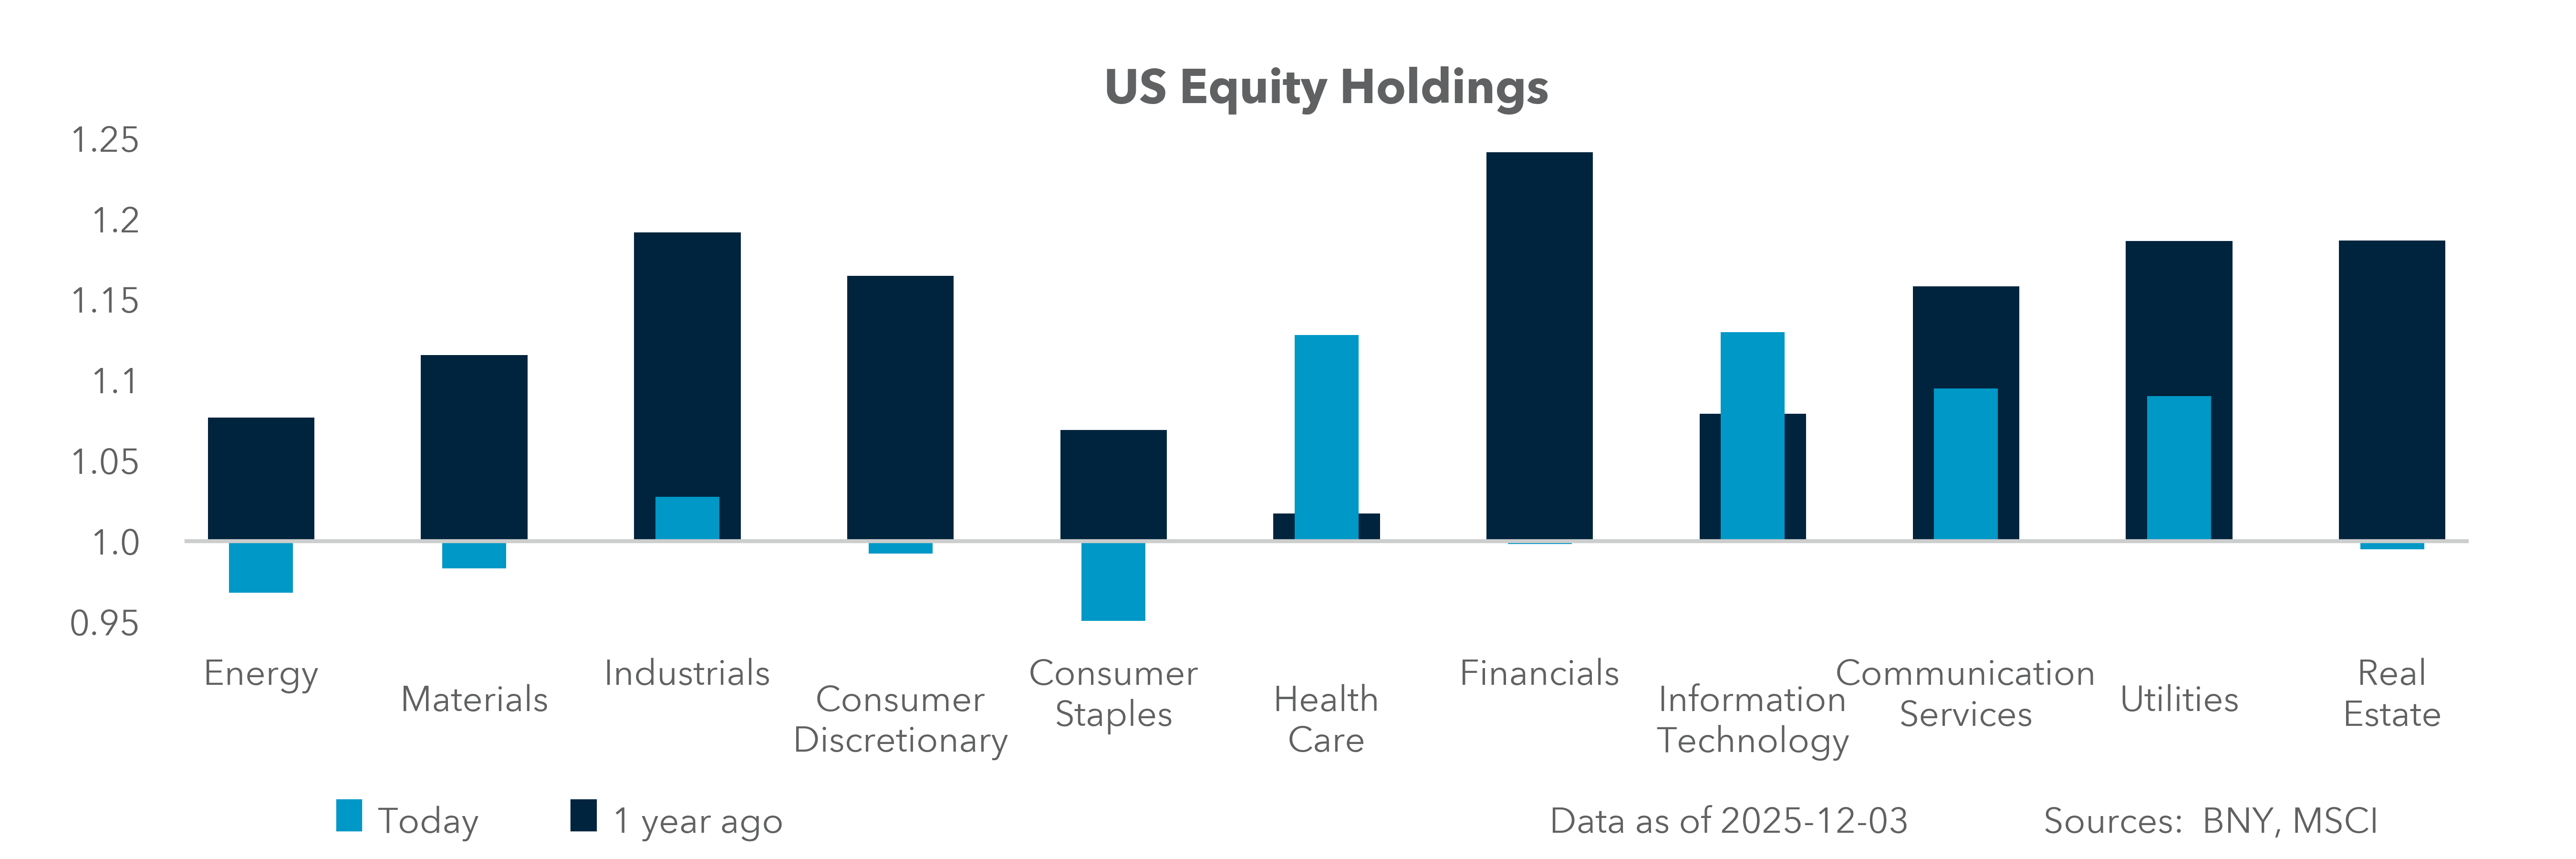
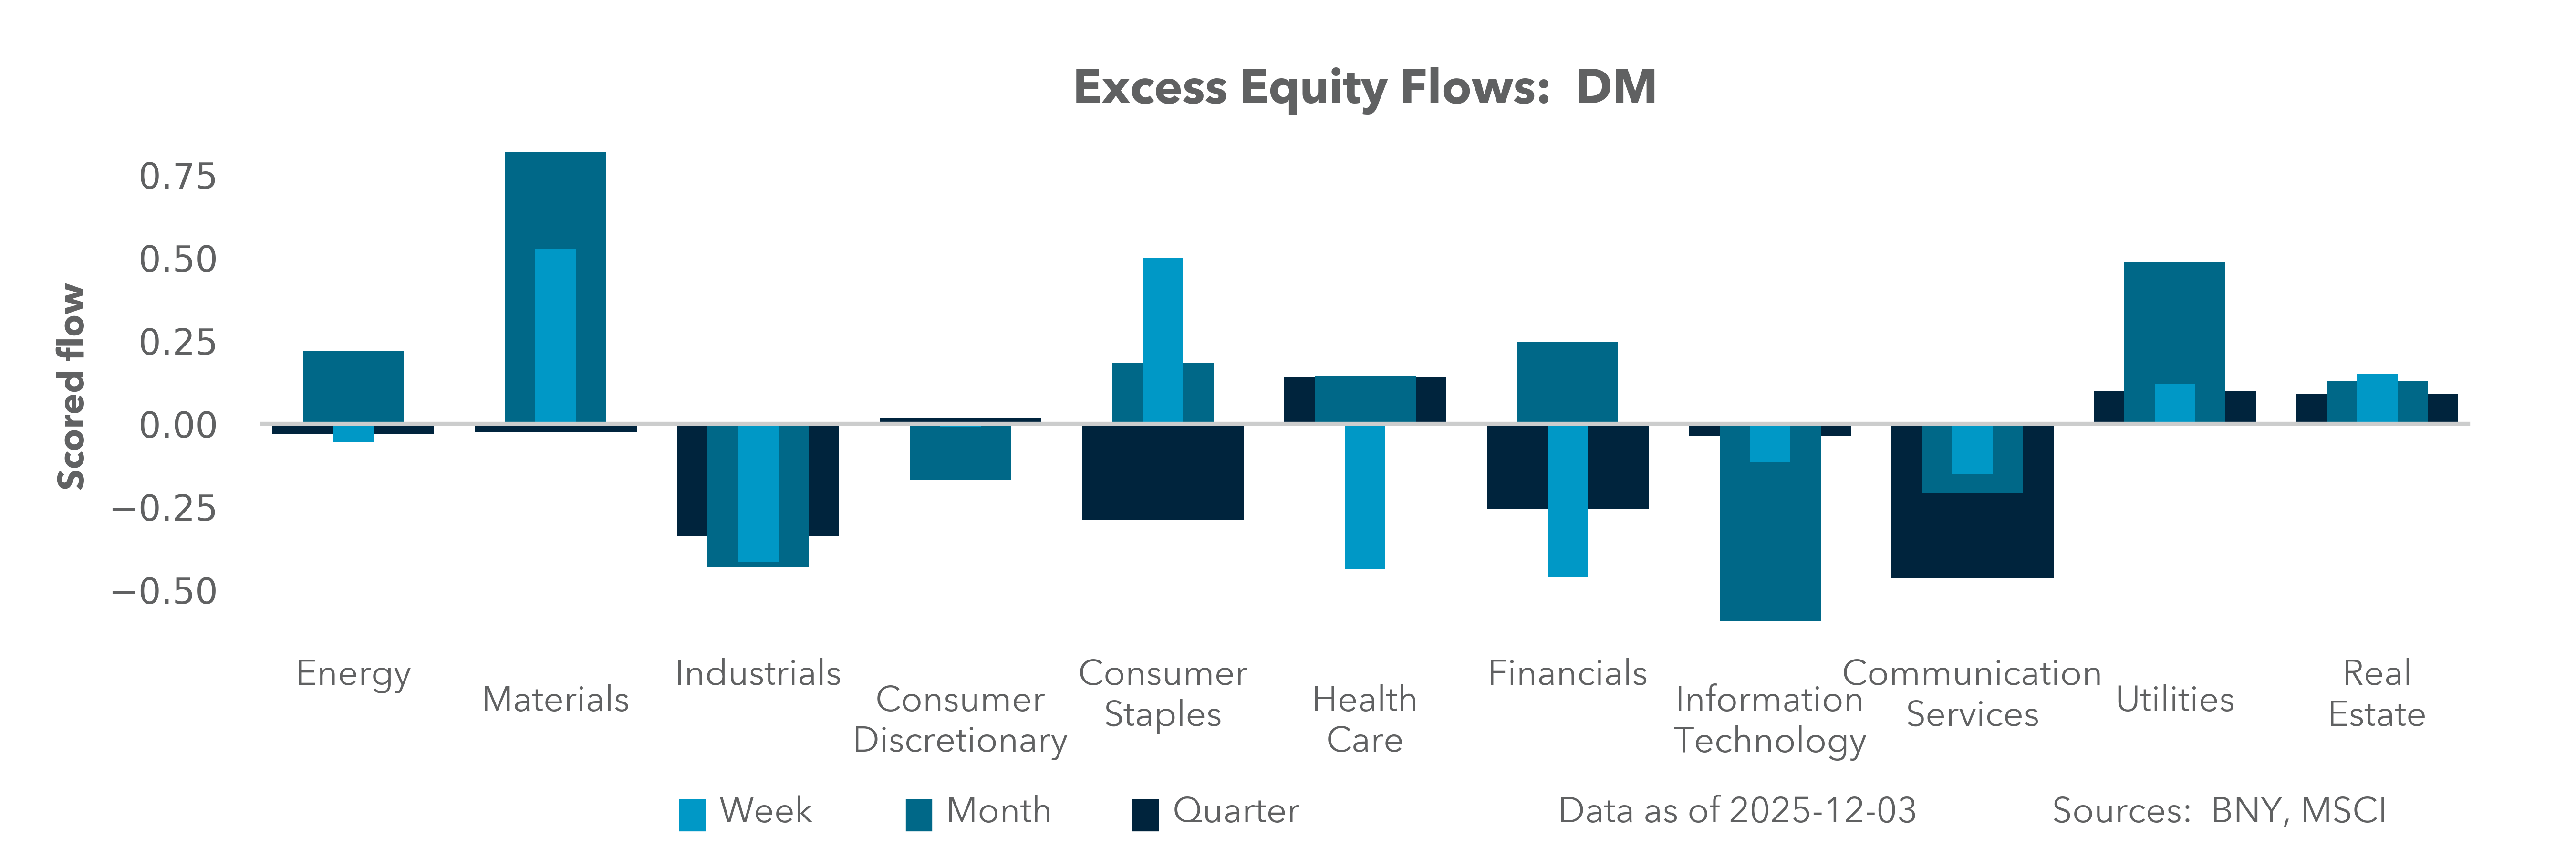
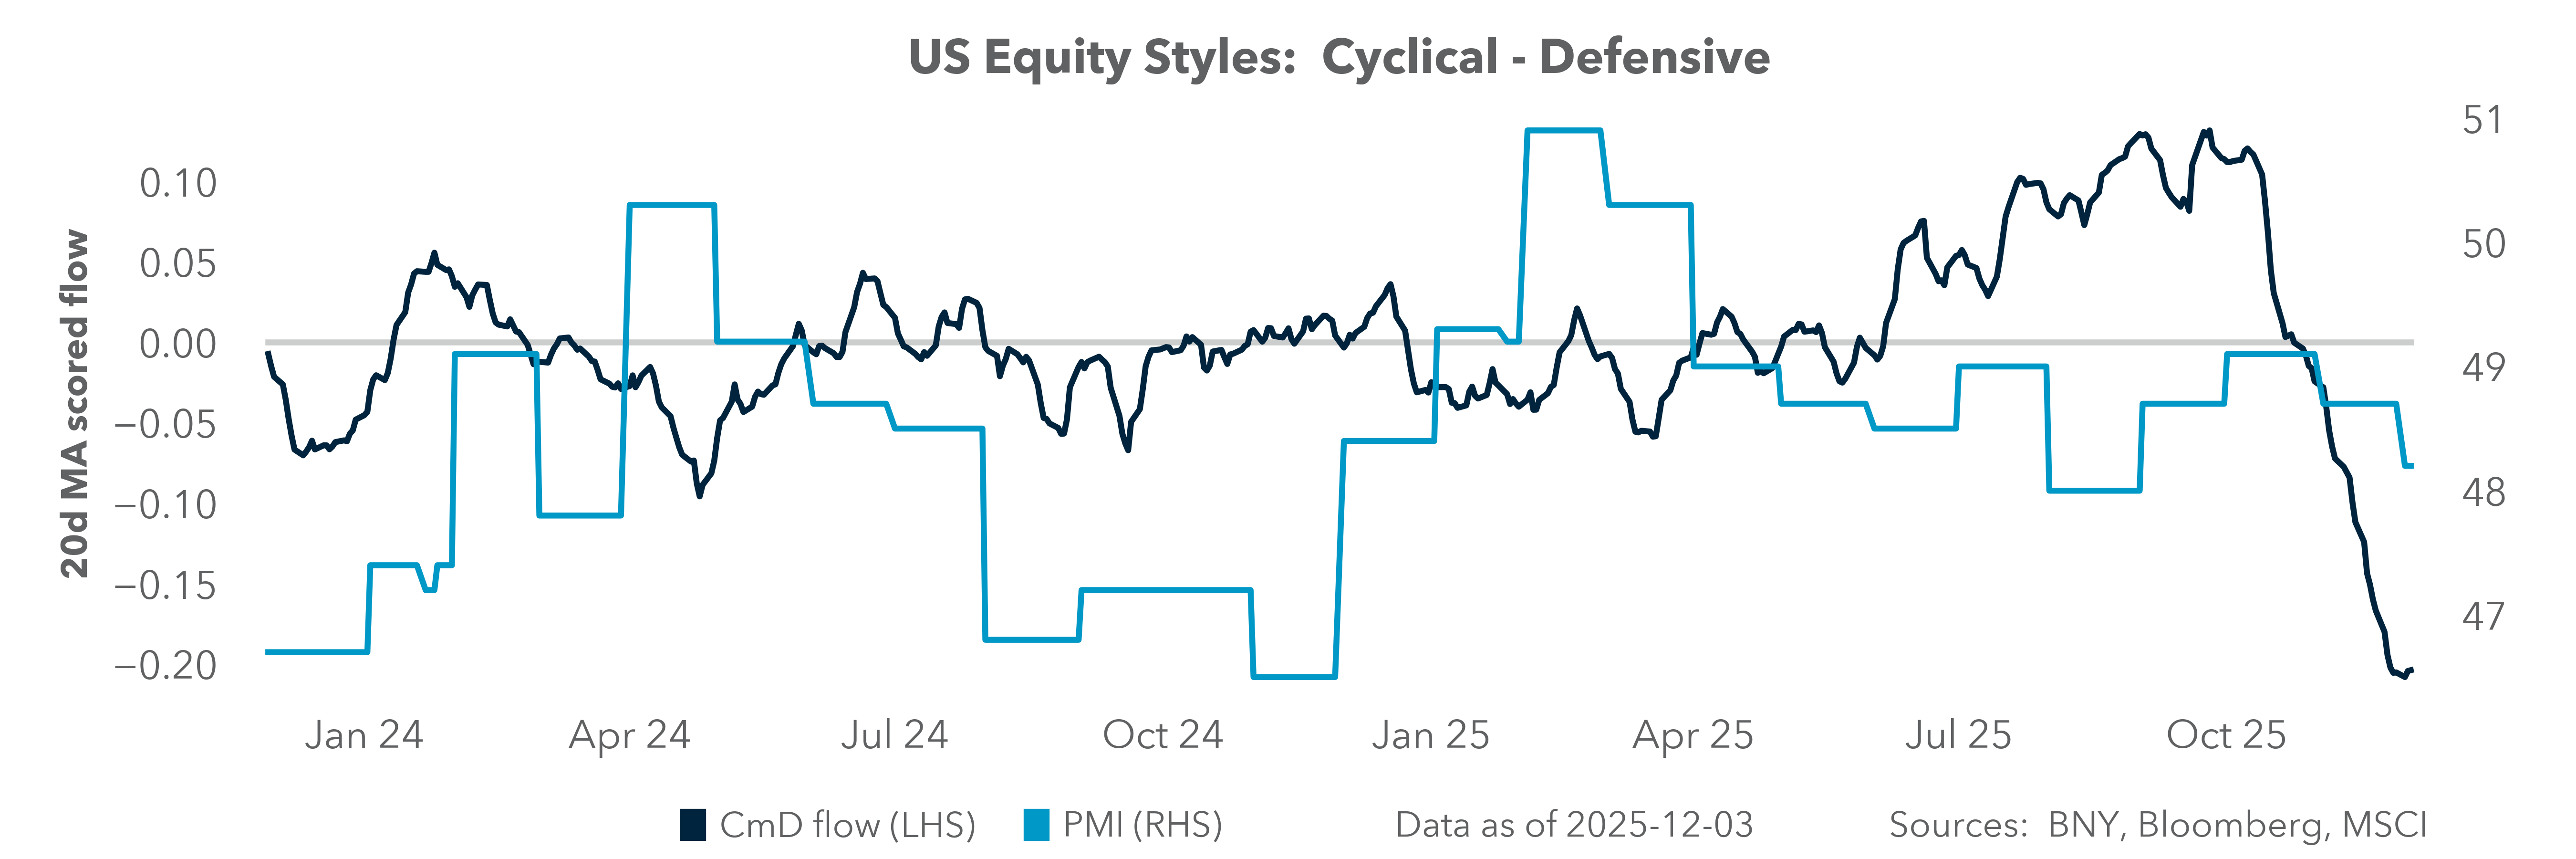
What we see from investor positioning into 2026 suggests a defensive posture for risk, with ongoing USD hedging, continued rotation out of U.S. tech, and steady buying of utilities and health care. Globally, investor risks come from higher rates and above-trend growth, making the relative value flows more important for any U.S. asset holding acceleration. All of this adds to the need for proper portfolio allocation and risk management ahead. The downside risks rest on the unpriced view that rate cuts can’t prevent a recession.
The current hedging strategies for 2026 may surprise:
1) Volatility in VIX futures or calls. The curve is already higher and steeper by 2%. Recognize the importance of event pin risk, where volumes spike and collapse in the first week of November 2026.
2) Diversification and higher liquidity with cash buffers. Avoid large or reactive shifts in holdings, as we saw in April 2025. Mean reversion after any election outcome may already be priced and overwhelmed by longer-term trends like earnings or inflation.
3) Sector rotation. Note that value versus growth, and quality versus low volatility – especially with a pro-cyclical bias – have worked since 2016 ahead of actual elections. Appropriately sizing risks into the first half of 2026 will be critical to implementing the above hedge.
4) U.S. bonds have traditionally worked in midterm election run-ups. However, more fiscal stimulus and higher global rate risks make bonds less obvious here. Safe-haven demand usually works with policy uncertainty, leaving gold, Swiss assets and the Japanese yen (JPY) as important alternatives for portfolios.