Savings-heavy economies struggle to press advantage
iFlow > Investor Trends
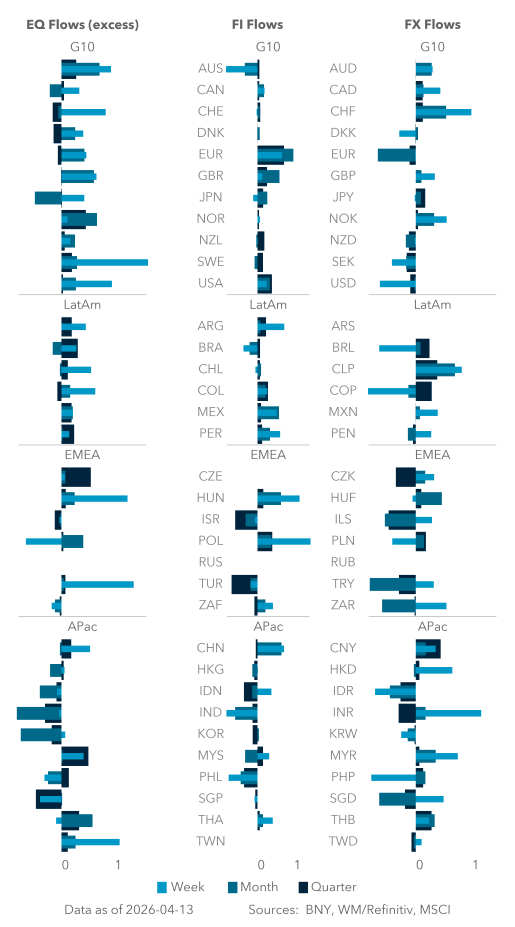
Investor Trends provides a deep dive into patterns and behaviors in equity, bond and currency markets around the globe, underpinned with deeper macro insights.
iFlow > Investor Trends
Investor Trends provides a deep dive into patterns and behaviors in equity, bond and currency markets around the globe, underpinned with deeper macro insights.

Geoff Yu
Time to Read: 4 minutes
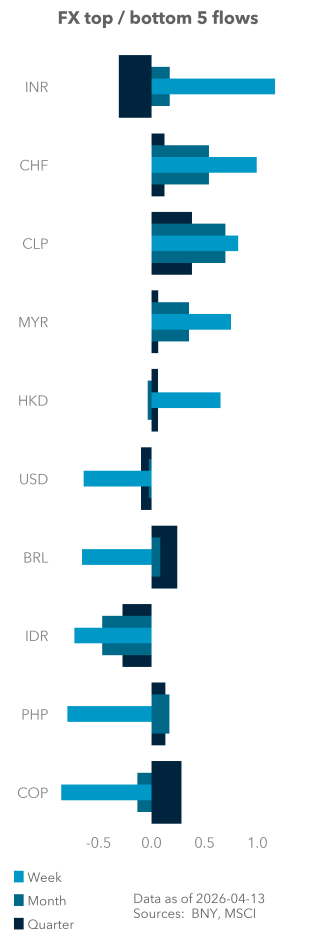
EXHIBIT #1: HOLDINGS AND FLOW FOR MAJOR FUNDERS IN RUN-UP TO CEASEFIRE
Source: BNY, Bloomberg
Our take
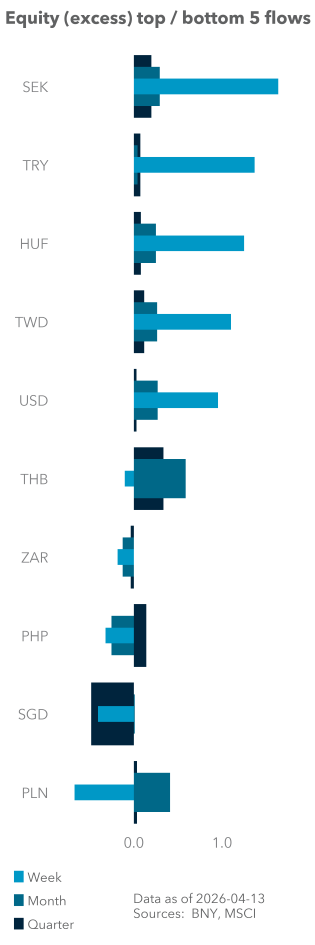
The dollar has been the clear safe-haven currency throughout the U.S.-Iran conflict, but savings-heavy currencies did not perform better. The likes of CNY, CHF and DKK saw good flows, but the EUR had one of its worst months in recent memory, while the normally overheld SGD may be approaching neutral holdings. Only KRW and JPY managed to end the month unscathed, with relatively neutral flow and positive holdings.
We appreciate the fact that these currencies’ home economies are highly exposed to the energy shock, and the balance-of-payment discount is clearly not supportive. However, their high household and government savings leave them well positioned to absorb an excessive growth shock. For example, we believe the European Central Bank (ECB) need not move on rates this month, given sufficient government support for energy prices. In a way, this also limits aggressive inflation expectations. This is even before considering a softer point in the labor market cycle. Many other countries in this group have adopted price-protection mechanisms, which are durably credible and sustainable. In contrast, Thailand abandoned its oil stabilization fund merely days into the conflict, as the program quickly proved unaffordable.
Forward look
If the conflict persists, there is a case for higher rates, but governments will likely introduce larger subsidy programs. Again, we see this funder group as credible, and any significant mitigation of growth risks will also support asset allocation over the medium term. There is another case for currency strength, or at least lack of weakness aside from valuations: we wrote last week that FX reserves sales by APAC names were weighing on global FX markets, while helping offset higher import costs. For European names, significant private and public sector savings invested overseas could serve the same purpose.
While doing so may not help clear the sudden widening trade gaps, limiting currency weakness is equally important to containing pass-through – essential to mitigating the FX impact of a supply shock. CHF is a clear example of leveraging global private sector savings, and key APAC funders’ asset allocators should use this moment to revisit their overseas exposures.
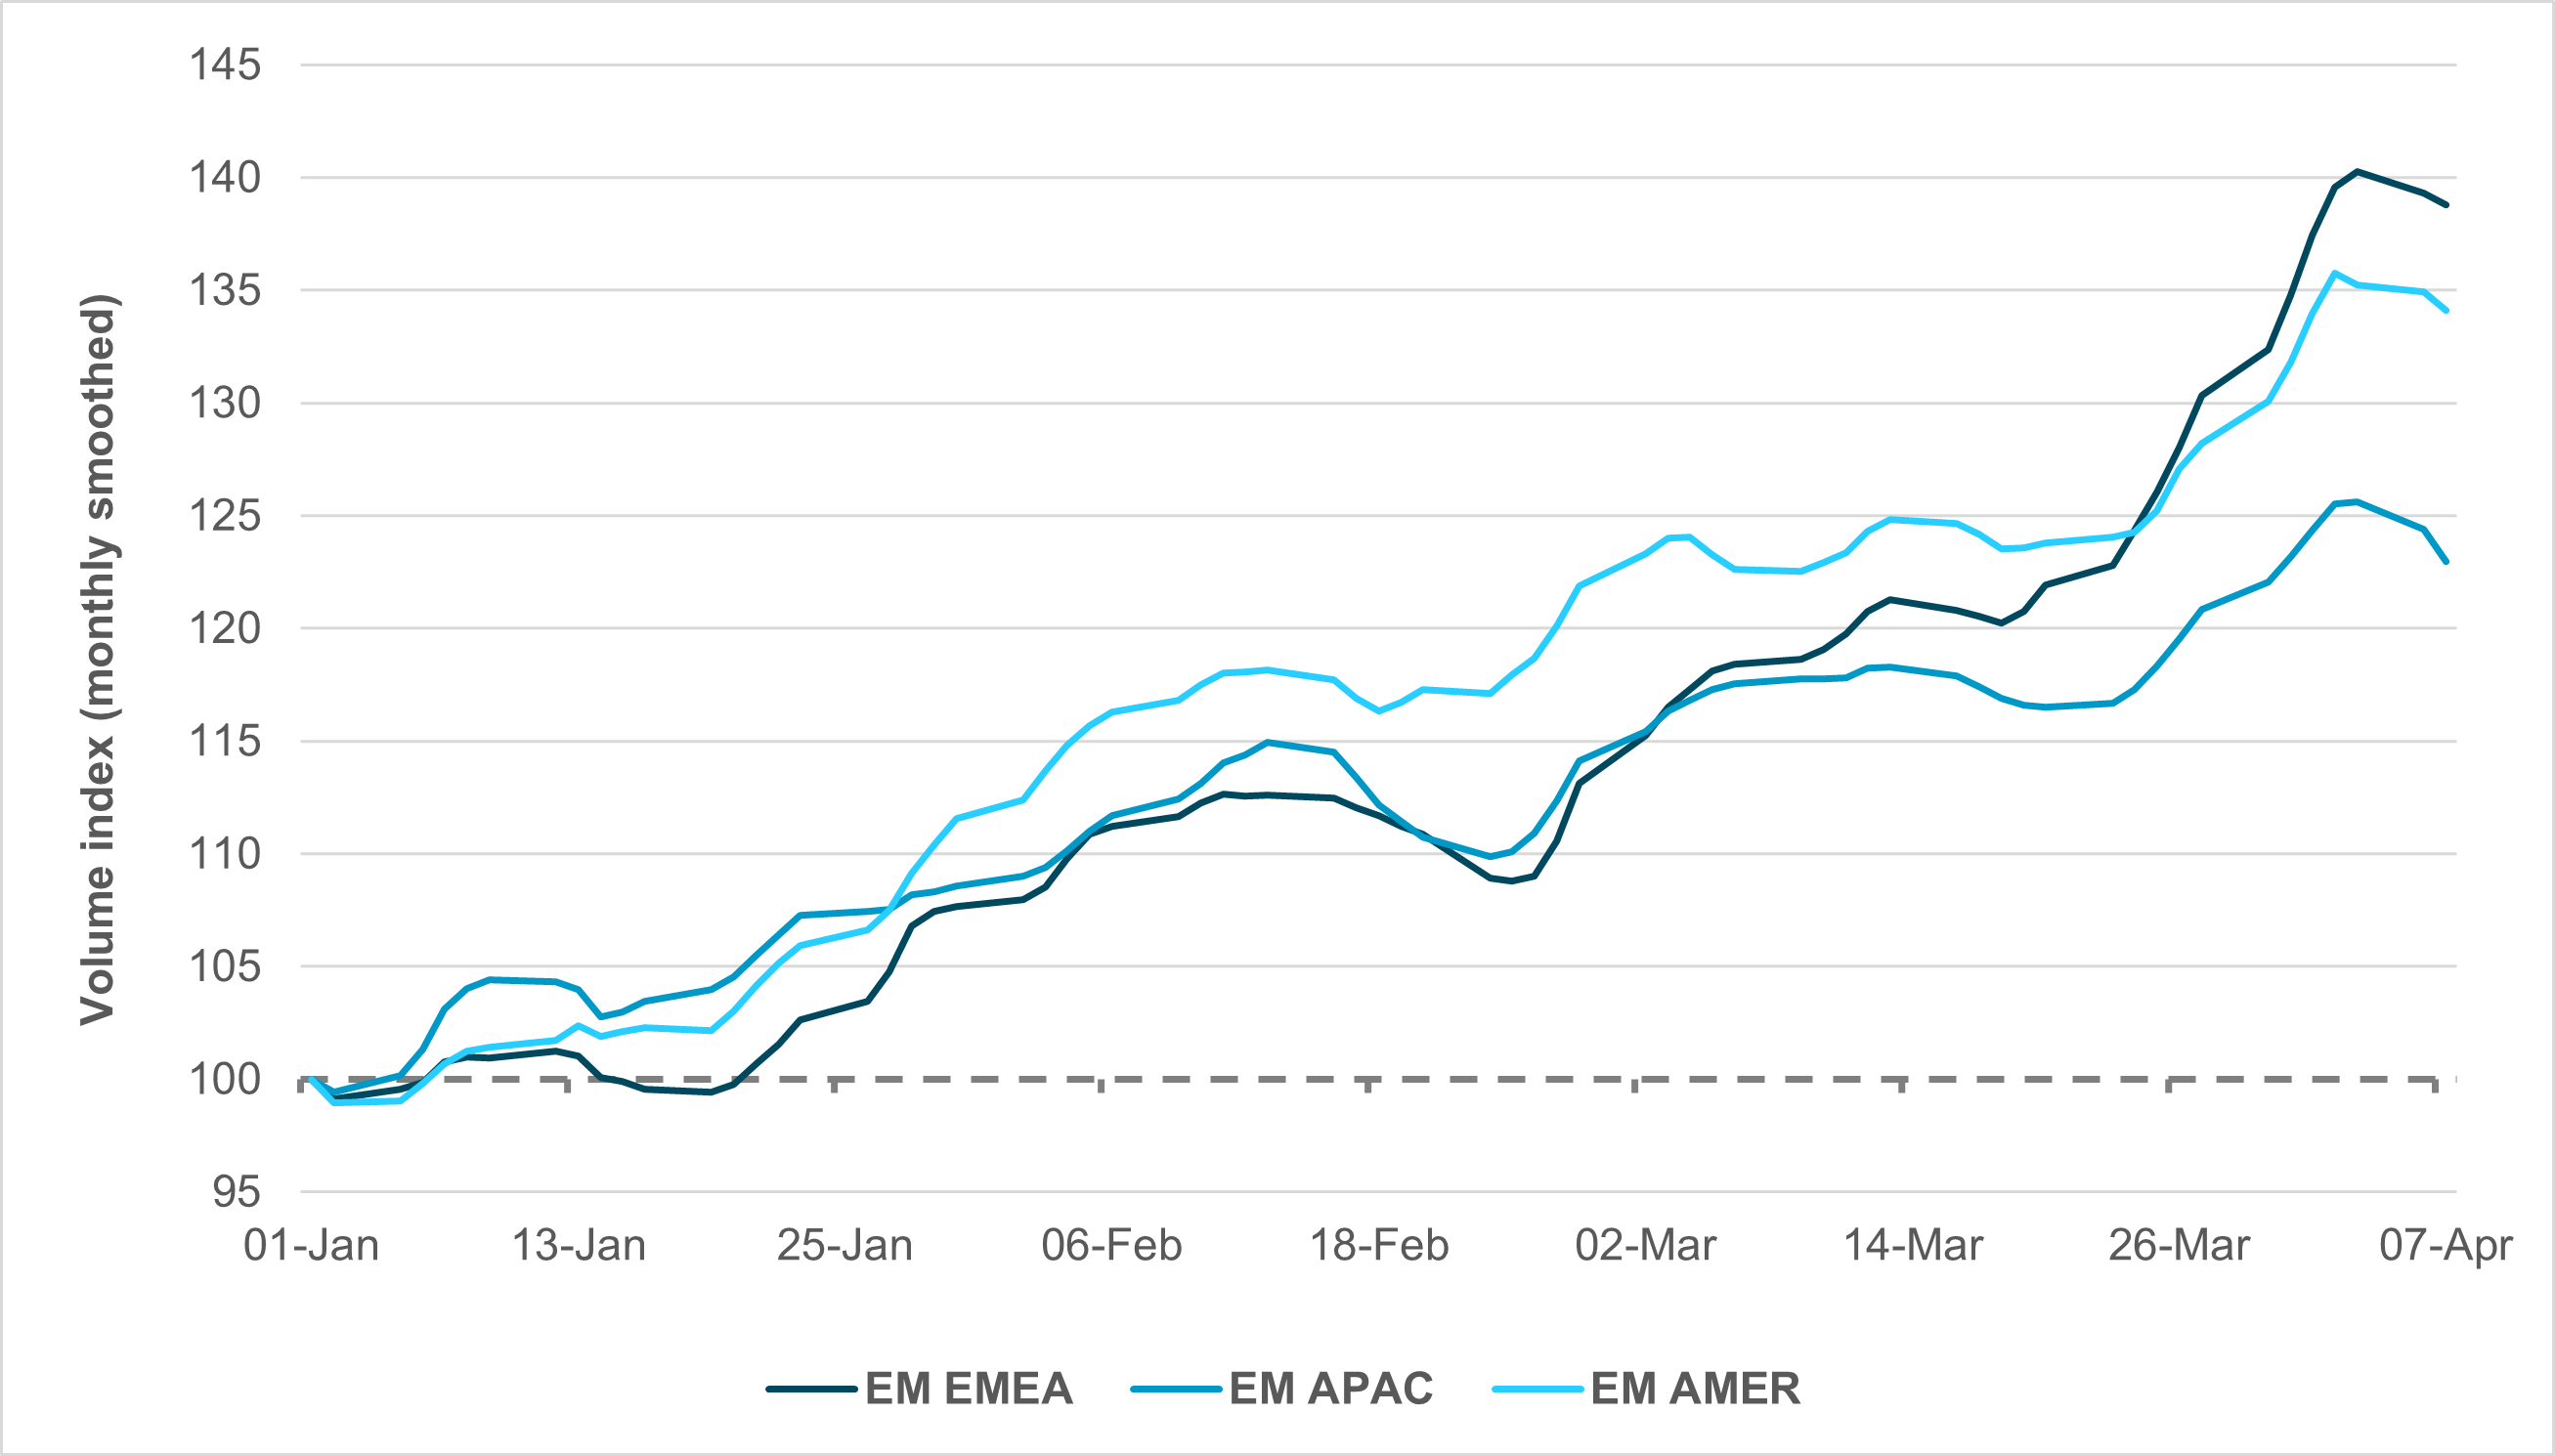
EXHIBIT #2: QUARTERLY VOLUME INDEX, REBASED TO JANUARY 1, 2026 = 100
Source: BNY, Bloomberg
Our take
Some of the most aggressive moves have been in South Korea and Taiwan, where concentrated positions generated outsized volatility in both directions. However, the same concentration means that the index price action was likely driven by a handful of names, while equities with little prior AI exposure conformed to market beta.
Activity figures bear this out: despite the large headline moves, EM APAC was materially the least-transacted group throughout the crisis. The region had led activity in January before being overtaken by EM Americas, which was buoyed by the commodity theme. Global EM indices saw a sharp rise in activity through the second half of March, but that is precisely when the gap between APAC and the rest of the market widened – with no sign of convergence.
Forward look
The lack of interest admittedly undermines our expectation for EM APAC asset allocation this year. Valuation attractions stemmed from equity multiples, currency weakness and a very low positioning base, such that a material increase in allocations needn’t happen at the expense of the U.S. However, it appears that take-up has been weak, and the supply shock will certainly undermine APAC technology themes that had hitherto dominated activity levels. EM EMEA is currently the most actively traded, but selling pressures are high and a structural discount will likely remain. In contrast, EM Americas is the only equity market where net inflows have been accompanied by steady improvements in activity levels. However, EM Americas capitalization remains well below that of EM APAC in absolute terms. Barring a sudden surge in purchases and activity, 2026 could be another disappointing year for overall EM equity performance.
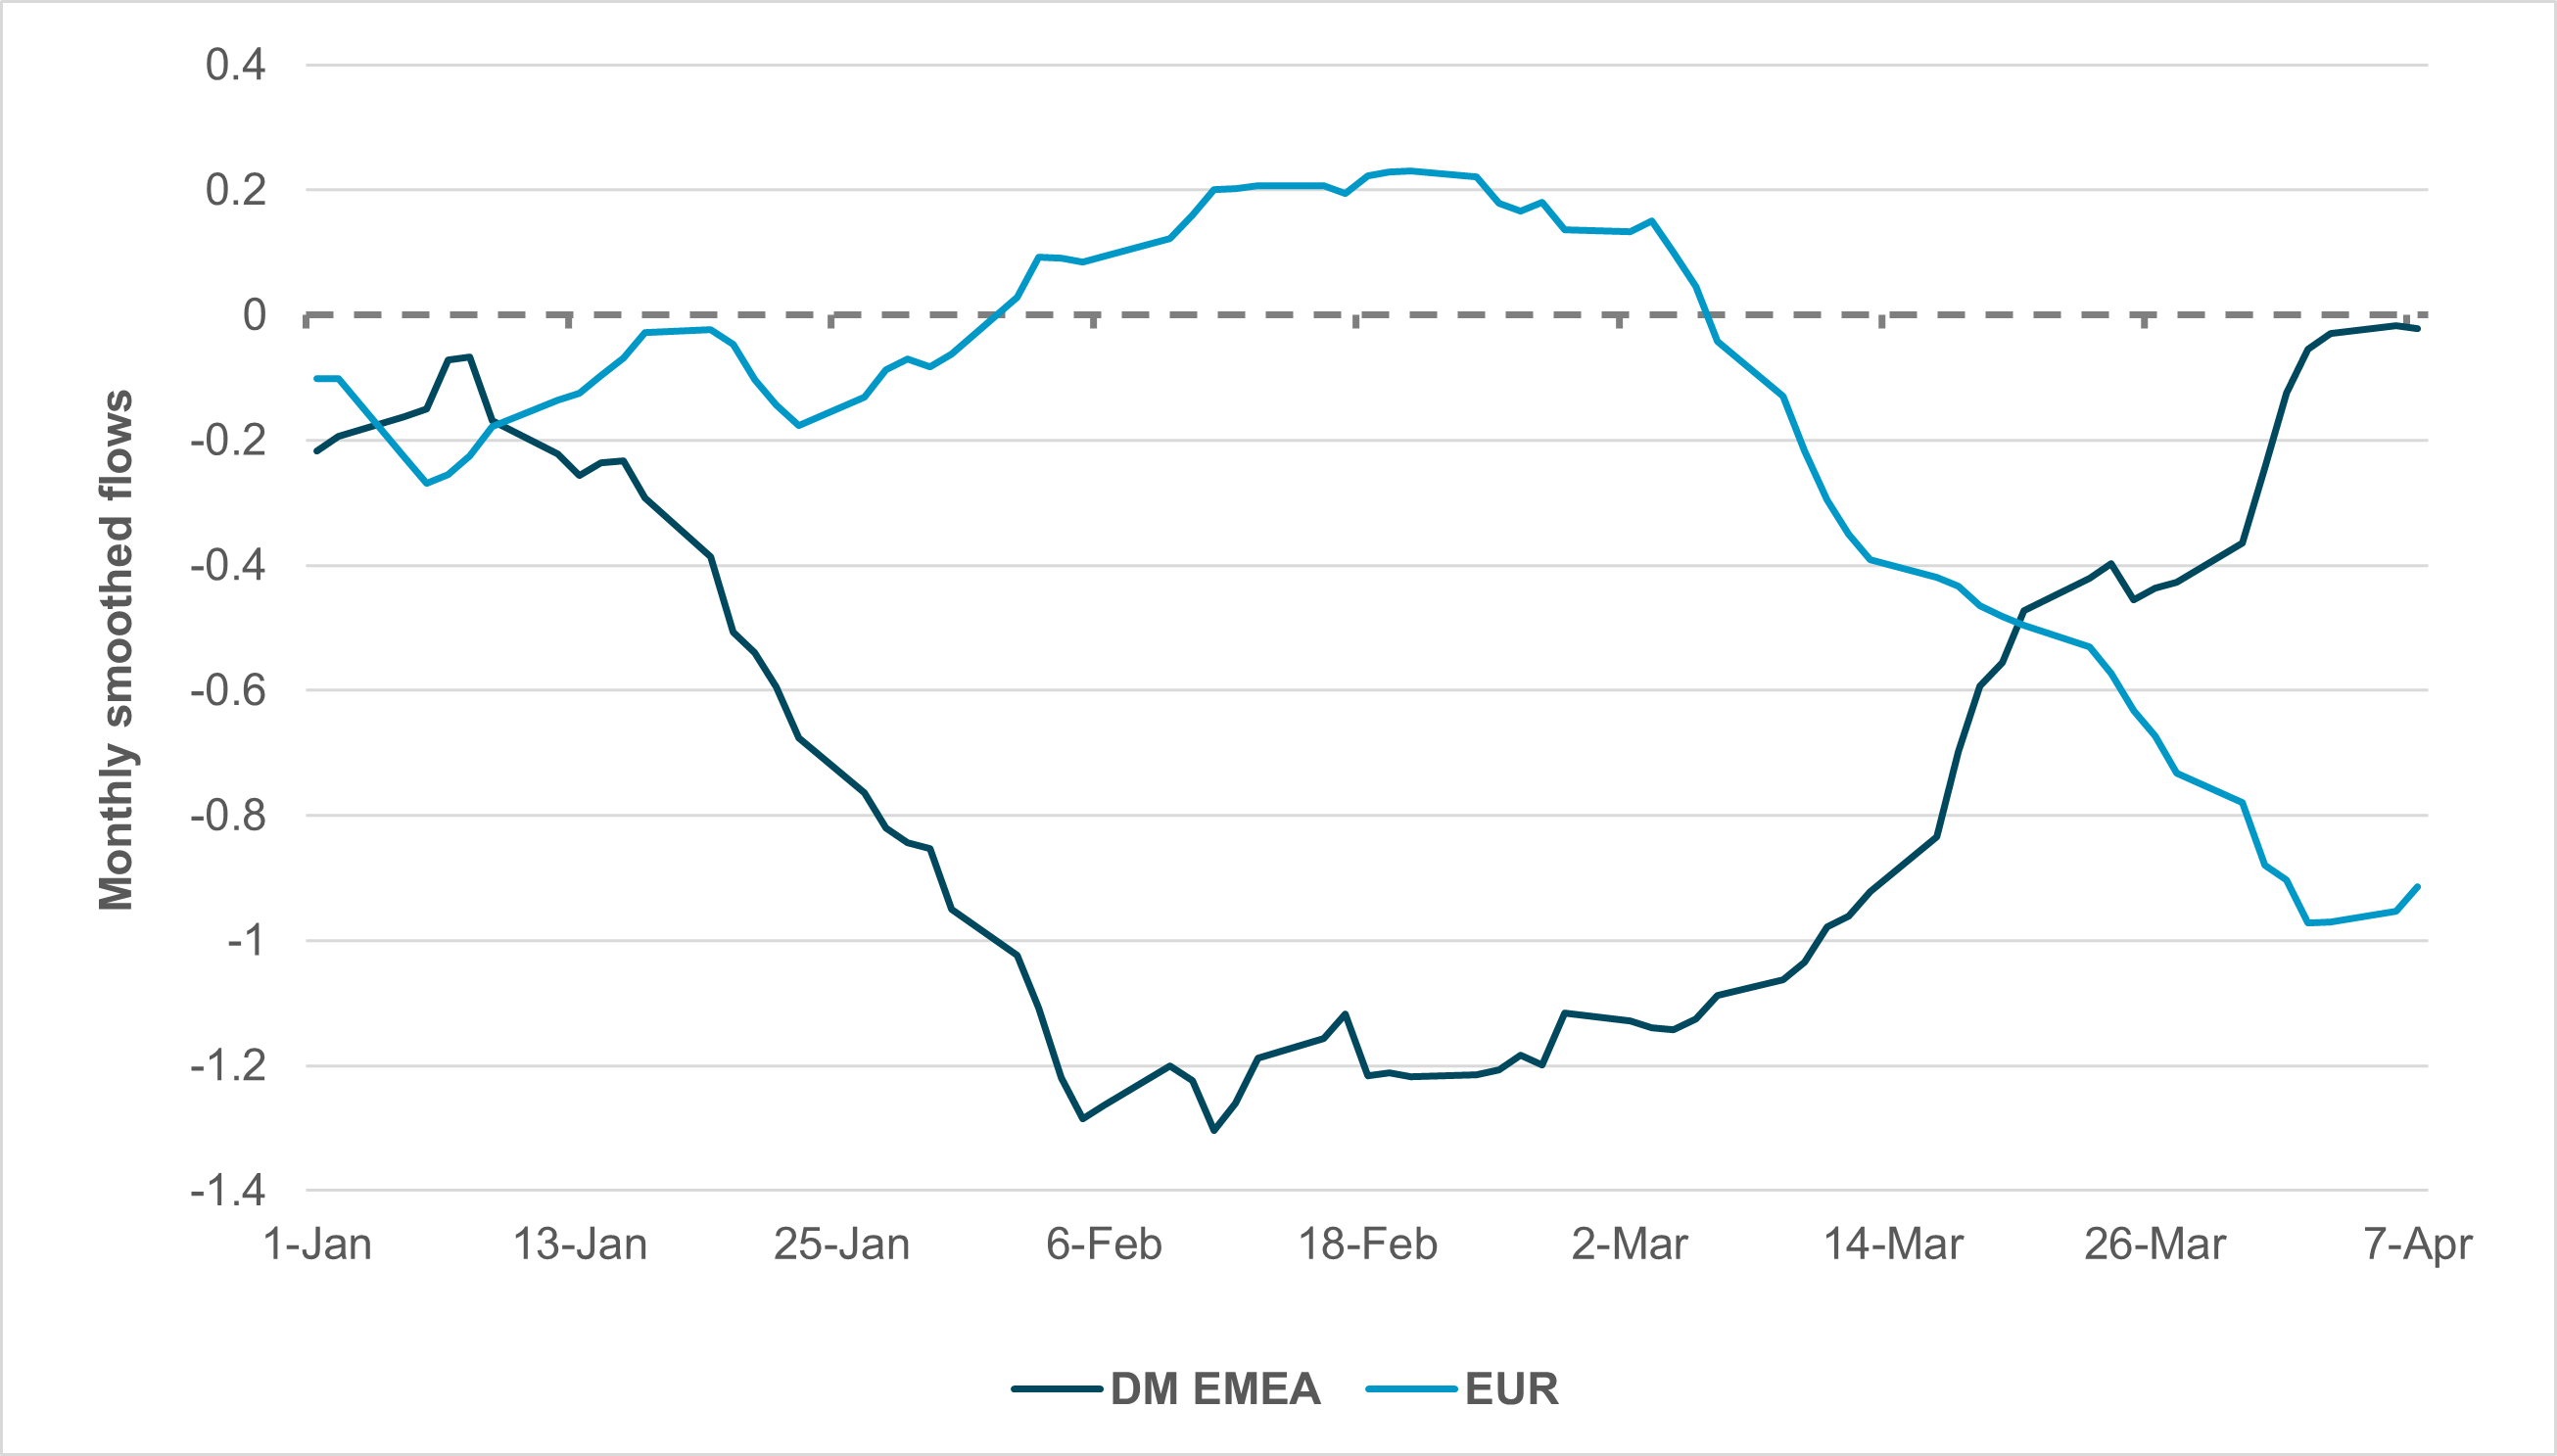
EXHIBIT #3: MONTHLY FLOW, CROSS-BORDER EUR AND DM EMEA GOVERNMENT BONDS
Source: BNY
Our take
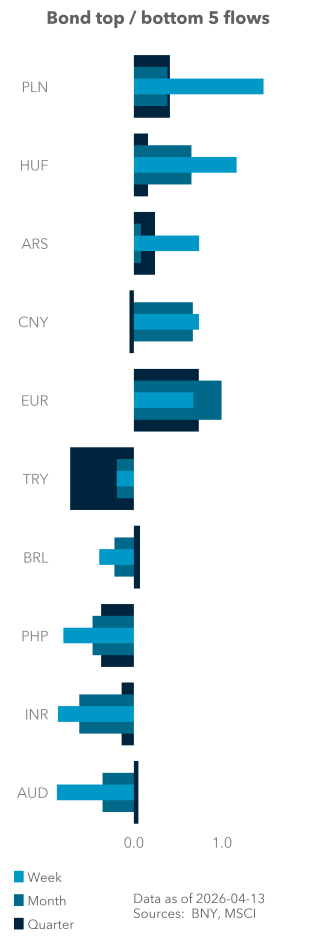
The EUR’s flow performance remains extremely poor, but an increasingly assertive ECB and a more durable ceasefire could support initial stabilization. The currency is now net underheld in aggregate, driven by both local and cross-border clients. However, the cross-border component tells a more nuanced story. European real yields have risen sharply, drawing very strong bond inflows. Most of the flow is onshore-driven by duration managers, but cross-border performance is also notable. On a monthly smoothed basis, flows are approaching flat for the region – the strongest reading year to date.
Forward look
The shift in flow dynamics throughout March suggests asset allocators are moving to increase European duration exposures. As flows turn into net purchases, European bond portfolio allocations appear to have stabilized or begun rising. However, given the state of rate differentials, there is still not enough in the EUR curve to fundamentally shift the hedging picture, leading to additional EUR sales. This dynamic persists despite the significant shift in central bank policy pricing. GBP front-end rates are much more favorable in contrast, which may explain why GBPUSD selling for hedges has not been as aggressive as that of EURUSD. Strong domestic and external duration demand is welcome for the Eurozone and U.K. – both of which face significant fiscal requirements ahead – but immediate currency follow-through may be limited.