Europe recovers, sell the euro
FX: G10 & EM provides a detailed analysis of global foreign exchange movements in major and emerging economies around the world together with macro insights.
FX: G10 & EM provides a detailed analysis of global foreign exchange movements in major and emerging economies around the world together with macro insights.

Geoff Yu
Time to Read: 6 minutes
Bottom line: Europe’s recovery is real, and inflation risk is real. Long EUR is the wrong expression for these views. Industrial and fiscal support favor European assets, while weak demand, policy-error risk and rich valuation weigh on the currency. We see good risk-reward in EUR-funded carry trades.
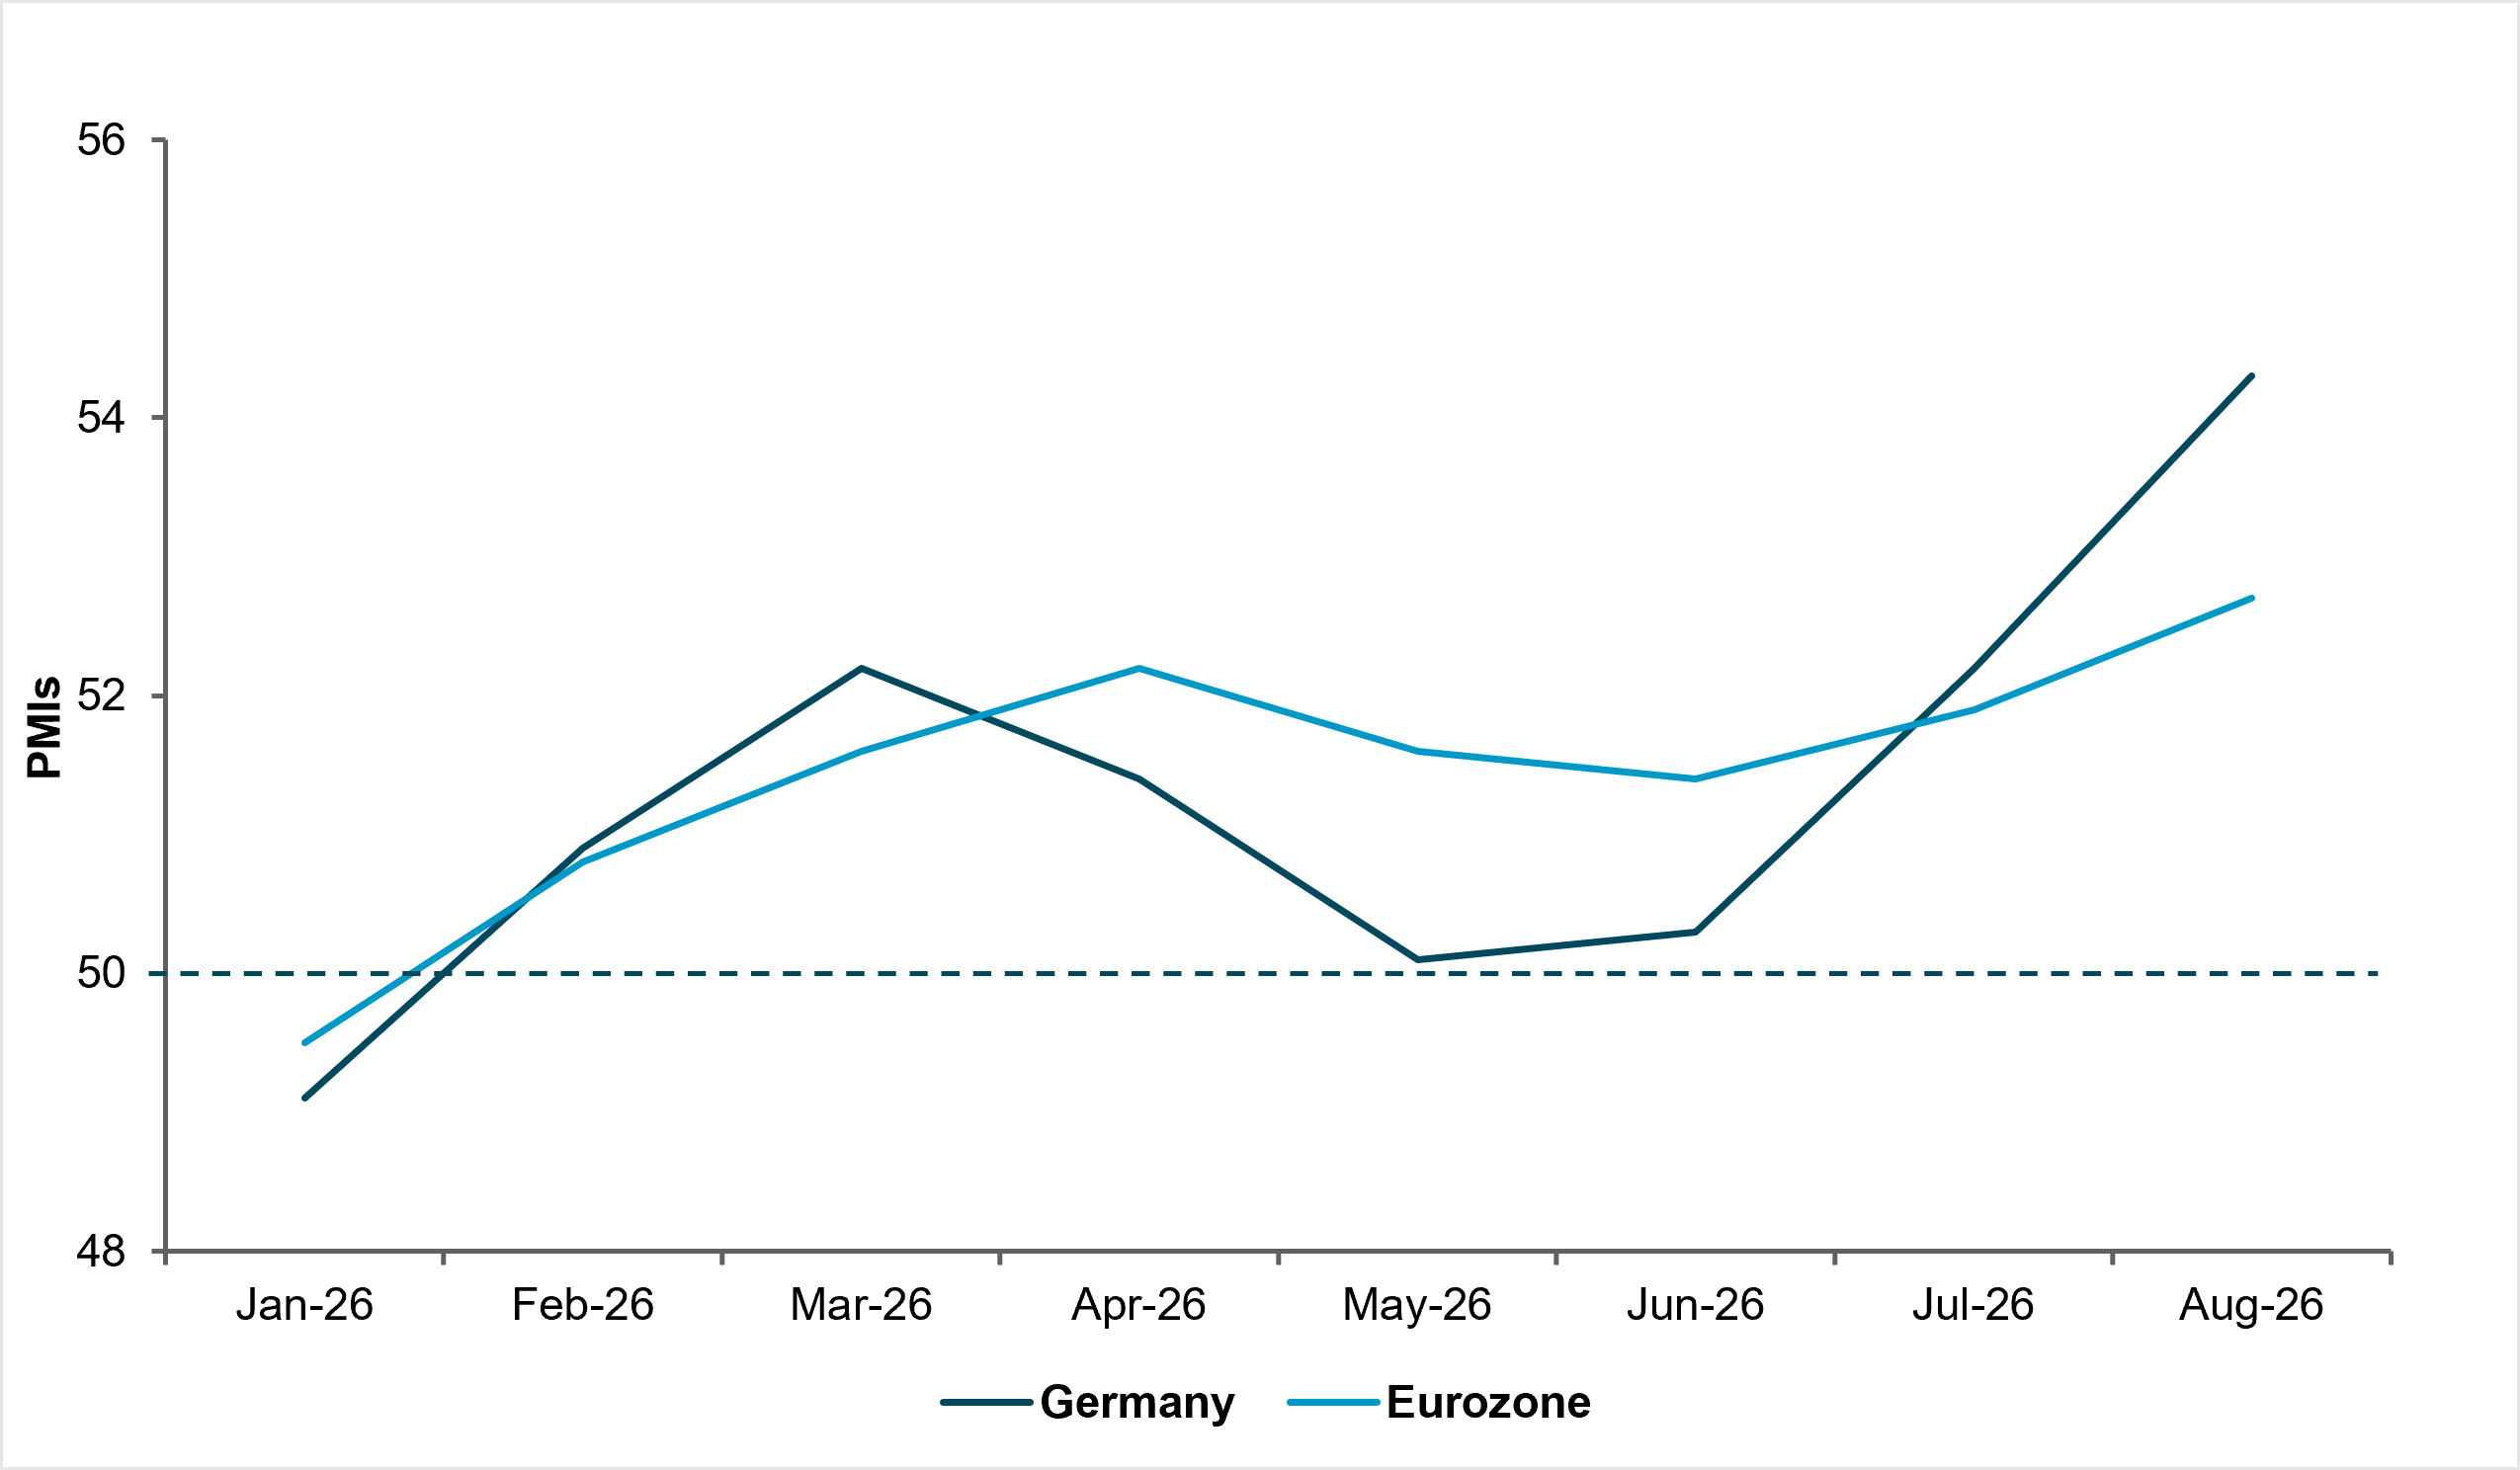
Manufacturing output reaches a 54-month high: The August PMIs confirm a genuine industrial rebound, led by Germany. But weak services and softer pricing make this a stronger signal for European assets than for EUR.
Industry and export strengthen, demand remains uneven
The Eurozone composite PMI rose to 52.1, a nine-month high, while manufacturing output reached its strongest level in 54 months. New orders recorded their fastest growth in 40 months, exports expanded for the first time in four and a half years, and manufacturers added workers after 38 months of job losses.
Germany is leading the recovery. Manufacturing output rose to 56.7, its highest in more than four and a half years, while orders and exports grew at their fastest pace since February 2022. Employment stabilized after 26 months of decline. The September ZEW index confirmed expansion, led by government spending and exports.
The recovery is not yet broad based. German services fell to 48.5, confidence weakened and output-price inflation eased for a third month. Across Europe, inventories, defense and data-center investment are supporting industry, but the demand and core inflation impulse remains insufficient to justify sustained EUR appreciation.
EXHIBIT #1: GERMAN MANUFACTURING PULLS AHEAD
Source: S&P Global Flash Eurozone and Germany PMI, August 2026; BNY
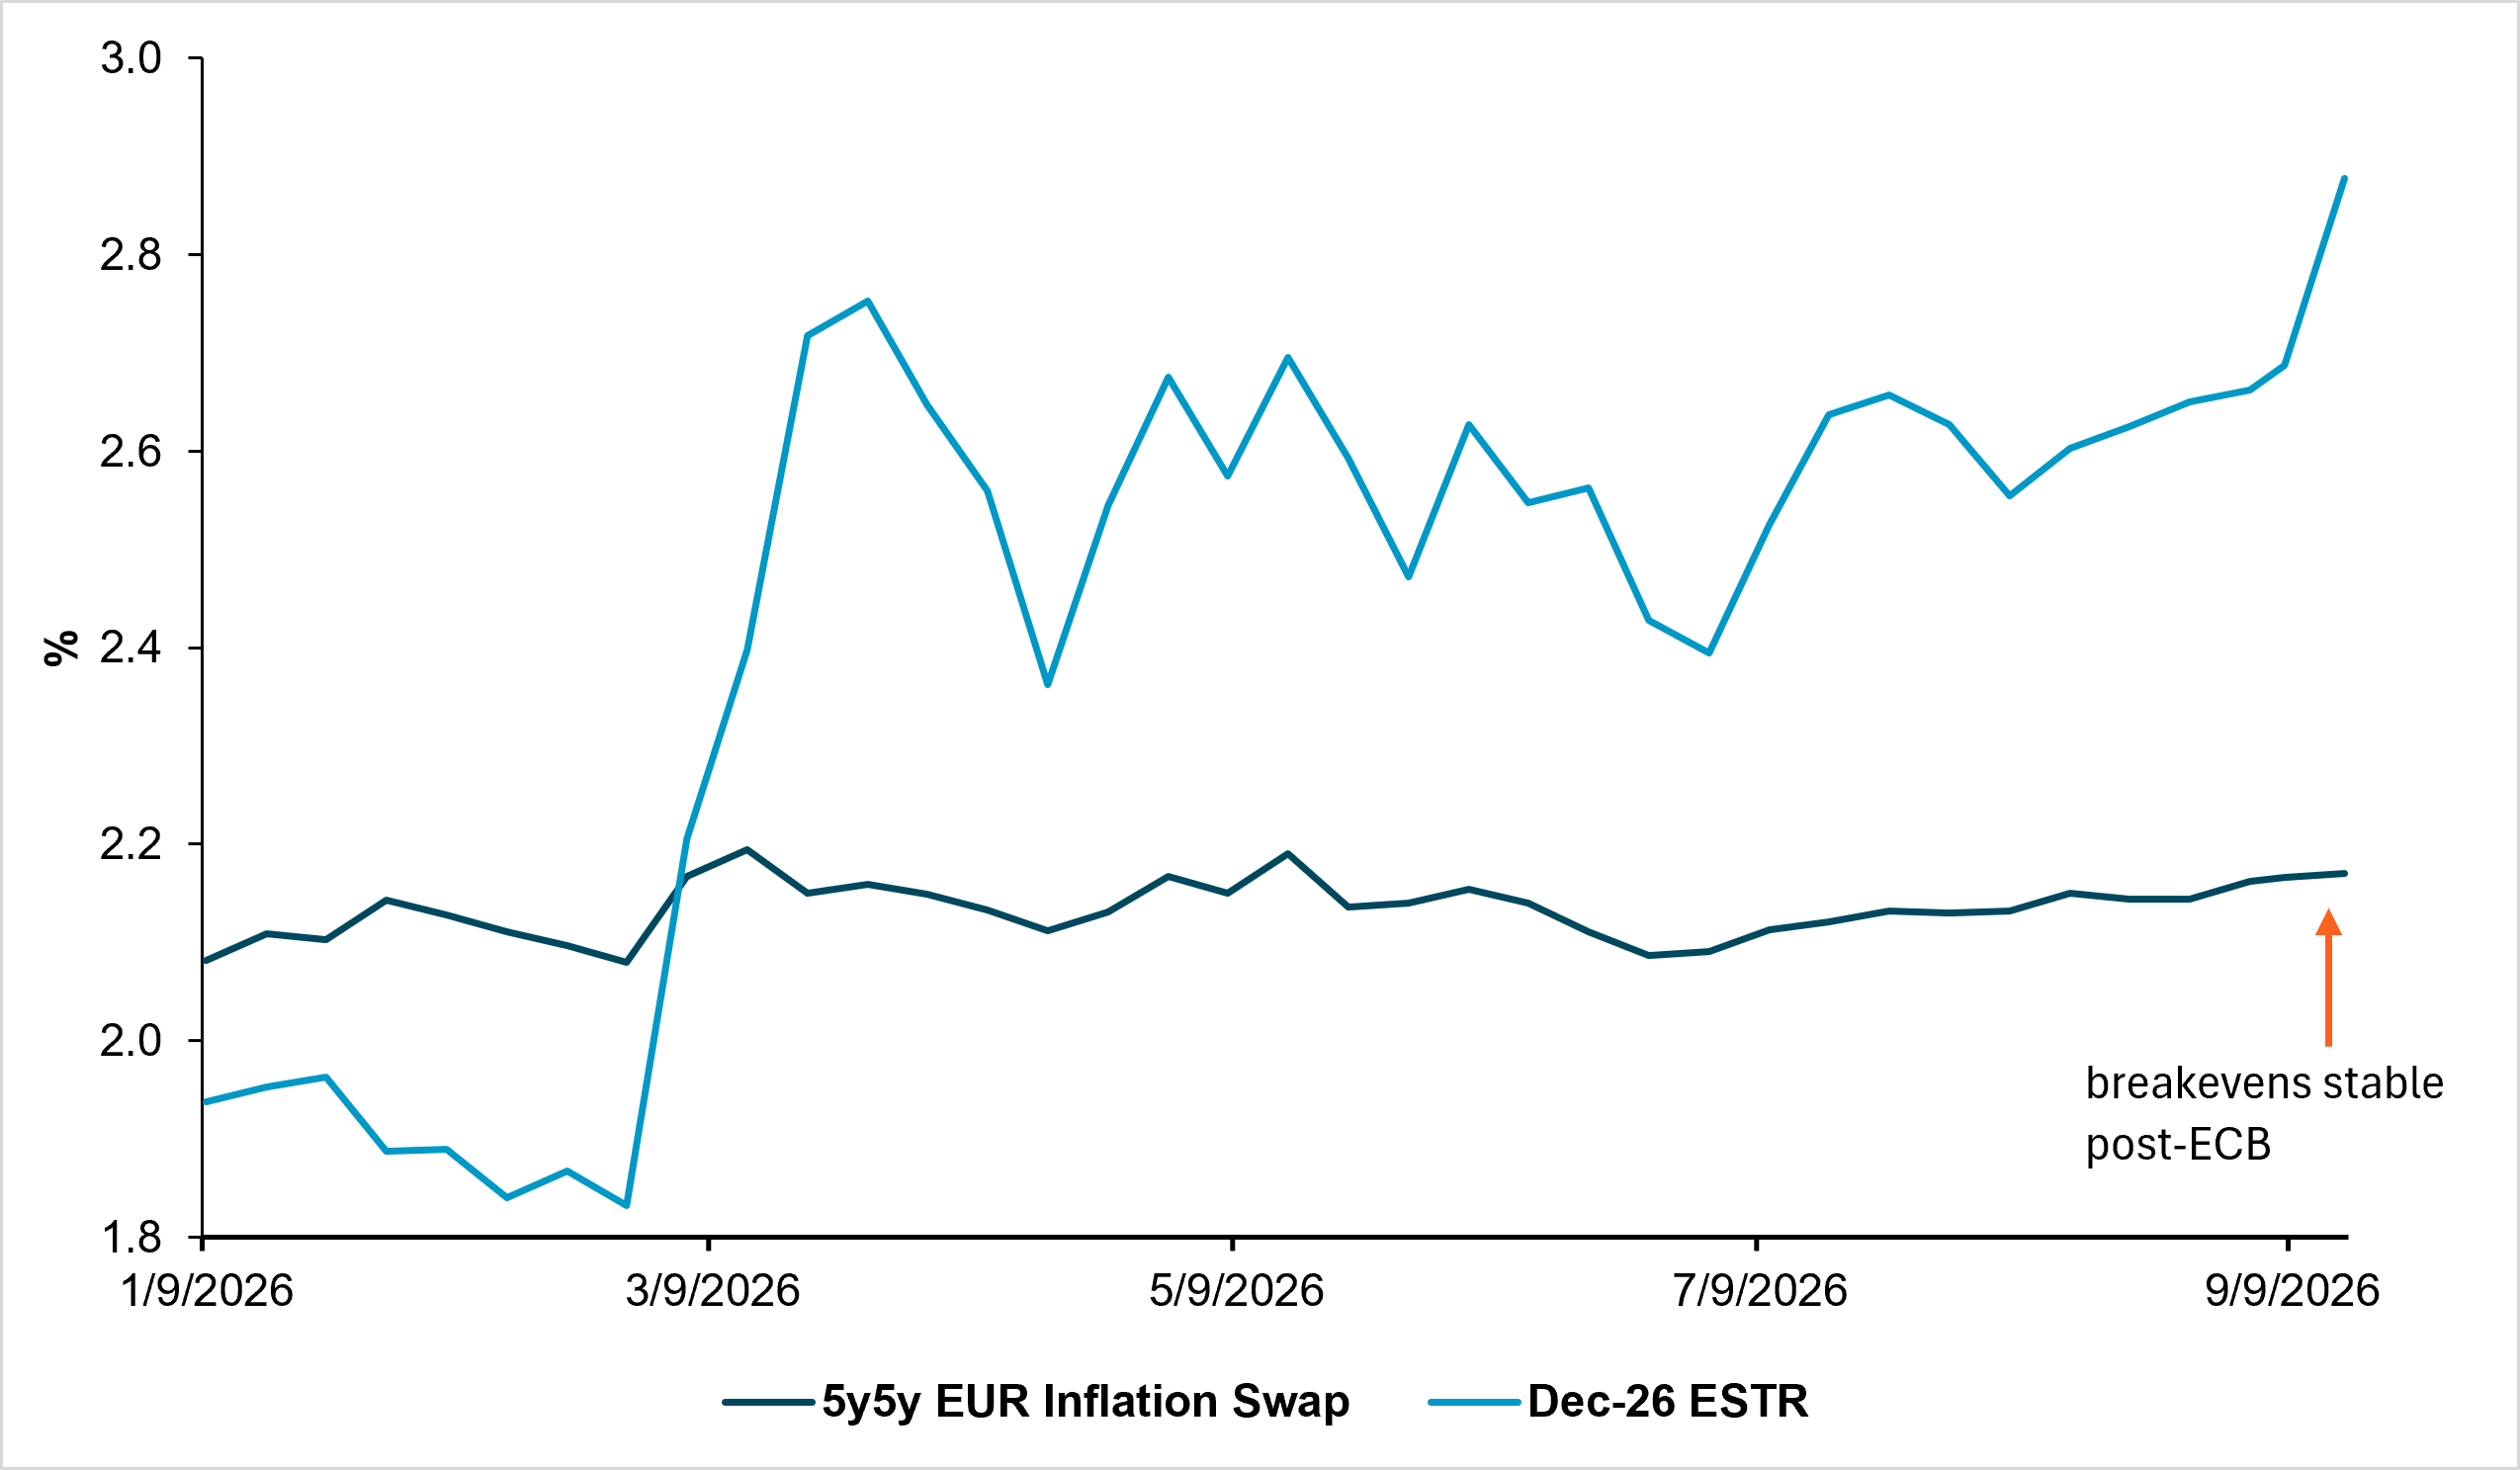
Insurance hikes delivered, a cycle would be an error: The ECB raised the deposit rate twice to 2.50%, and the markets priced another 75bp over the next six months based on energy risks alone. This is difficult to justify.
A supply shock, not demand inflation
After cutting the deposit rate from 4.0% to 2.0%, the ECB reversed course and raised it twice to 2.50% in September. Tightening thereafter would target an energy-driven supply shock with little evidence that the inflation impulse is becoming embedded.
Negotiated wage growth slowed to 2.4% in Q2 from a 5.6% peak in 2024, while the ECB wage tracker projects 2.6% this year. The 5y5y inflation swap remains anchored near 2.2%. Even Bundesbank hawk Joachim Nagel acknowledges that second-round effects are absent.
The Governing Council will likely decide meeting by meeting after September, and opinions are already split. Some members favor waiting until December while others are pushing for more preemptive action as energy prices continue to rise. Data don’t support a strong domestic-demand story to drive core inflation and second-round effects. Eurozone retail-sales growth has already slowed to 0.6%, while consumer confidence remains below pre-conflict levels. Higher rates can’t produce energy; they can only deepen the terms-of-trade shock. ECB vigilance is warranted but doesn’t make another increase automatic.
EXHIBIT #2: ECB PRICING STRONGLY OVERSHOOTS STABLE INFLATION EXPECTATIONS
Source: BNY, Bloomberg LP
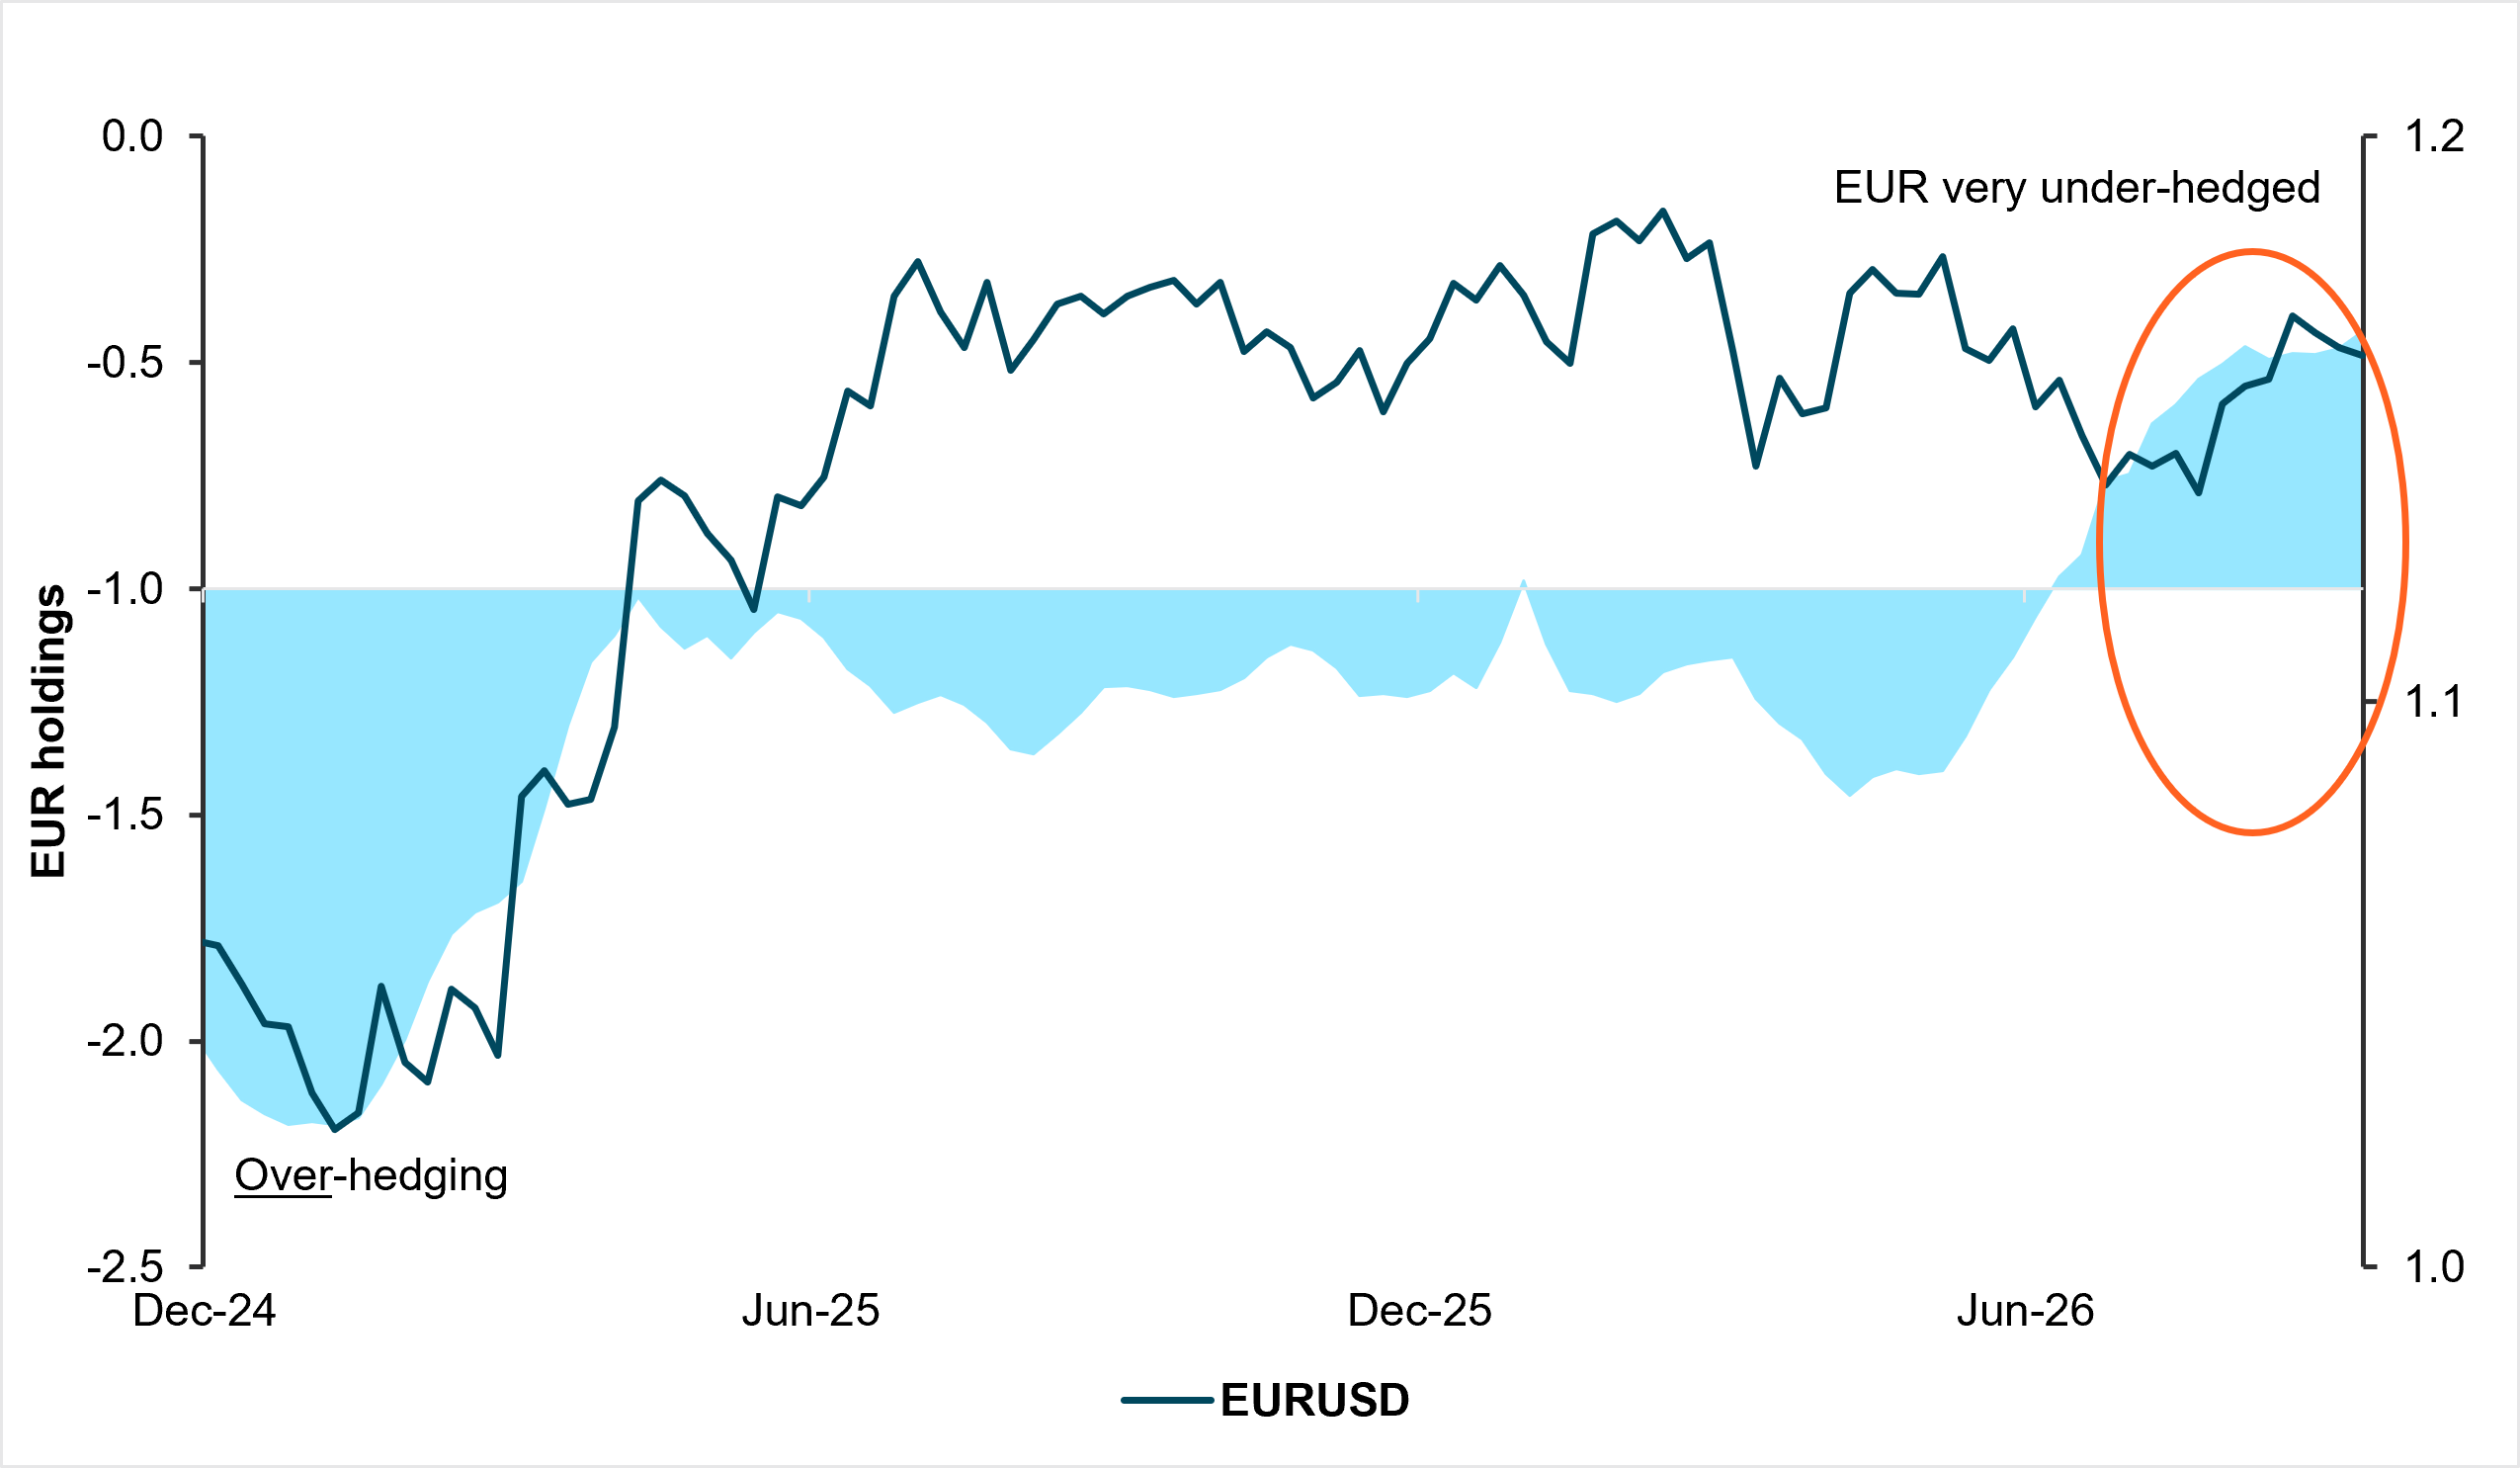
Cross-border EUR hedges are nearly 60% below their one-year average. The unwind that helped drive EURUSD toward 1.18 in 2025 is complete, leaving investors materially underhedged on Eurozone assets.
EUR hedge support is exhausted
At end-2024, growth and political concerns pushed cross-border hedges on Eurozone assets to twice normal levels. The subsequent strategic-autonomy trade and Germany’s fiscal announcement lifted European assets and EUR together, triggering a rapid hedge unwind. Combined with fresh asset inflows, this helped drive EURUSD toward 1.18. The currency’s tighter range since suggests that the initial appreciation catalyst has been exhausted.
Outright EUR positioning is strong now, while cross-border hedges sit nearly 60% below their one-year average. Dollar reductions following the July FOMC have left investors materially underhedged on Eurozone assets. With EUR rich and its rate differential against USD still negative as the Fed steps up tightening, currency hedging should rise even if allocations to Europe continue.
EXHIBIT #3: IFLOW SHOWS CROSS-BORDER INVESTORS MATERIALLY UNDERHEDGED IN EUR
Source: BNY, Bloomberg
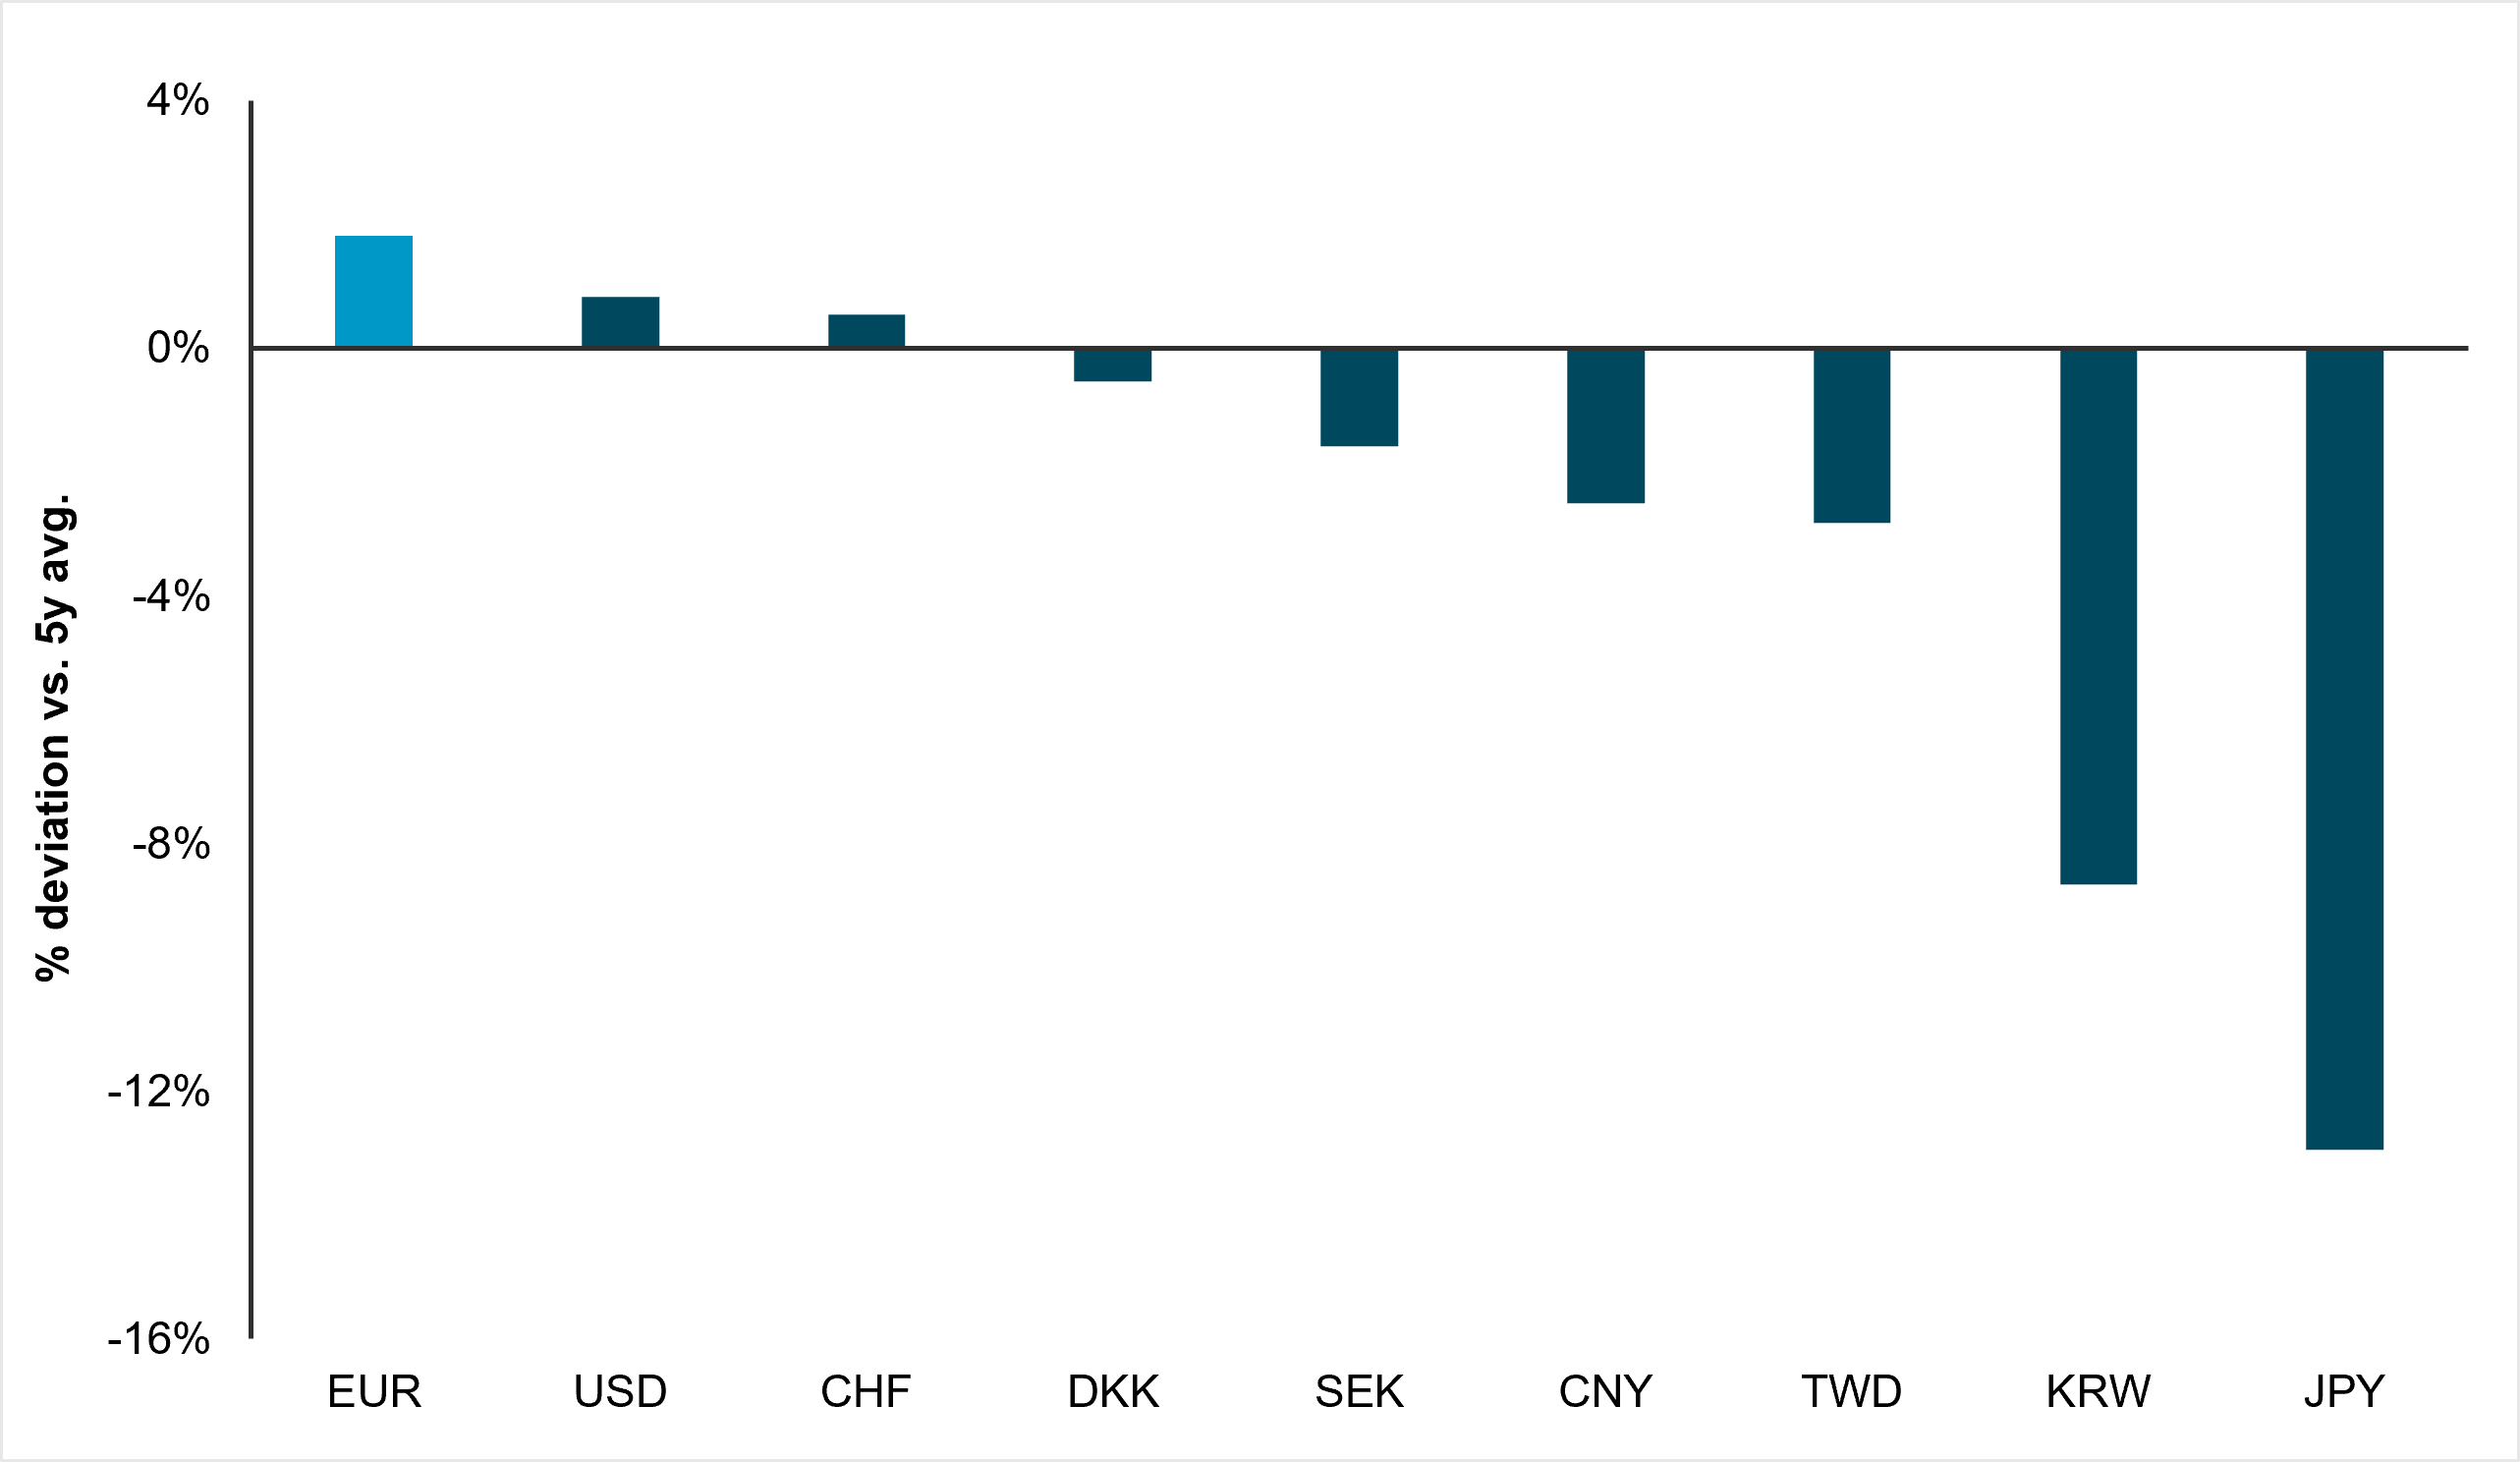
EUR remains overvalued. It’s nearly 2% above its one-year BIS REER average; the currency is expensive in real terms but relatively cheap to borrow.
Rich enough, cheap enough
Using a fixed base to compare surplus-economy funding currencies, EUR is the most overvalued relative to its five-year BIS REER average, exceeding USD, CHF, DKK and SEK. The deviation is modest, but borrowing costs would remain comparatively low even after a September ECB hike.
The policy contrast with Asia strengthens the case. European politicians focus on an undervalued CNY, but TWD, KRW and JPY sit even further below their five-year averages and remain heavily managed. In a world of industrial policy and self-preservation, benign neglect of EUR appreciation is increasingly difficult to justify.
Using EUR as a funder is not a negative view on the Eurozone. European equities can outperform alongside a weaker currency, while unhedged allocations face a drag if REER normalizes. EUR-funded carry benefits from the same adjustment.
EXHIBIT #4: EUR THE MOST OVERVALUED MAJOR FUNDER IN REAL TERMS
Source: BNY, BIS, as of September 15, 2026
Keep European equities, hedge the euro. The short-term equity–FX correlation is fading, flows are improving, and Europe retains a 25% valuation discount to the U.S. Maintain equity exposure but hedge the euro.
Earnings translation not a focus
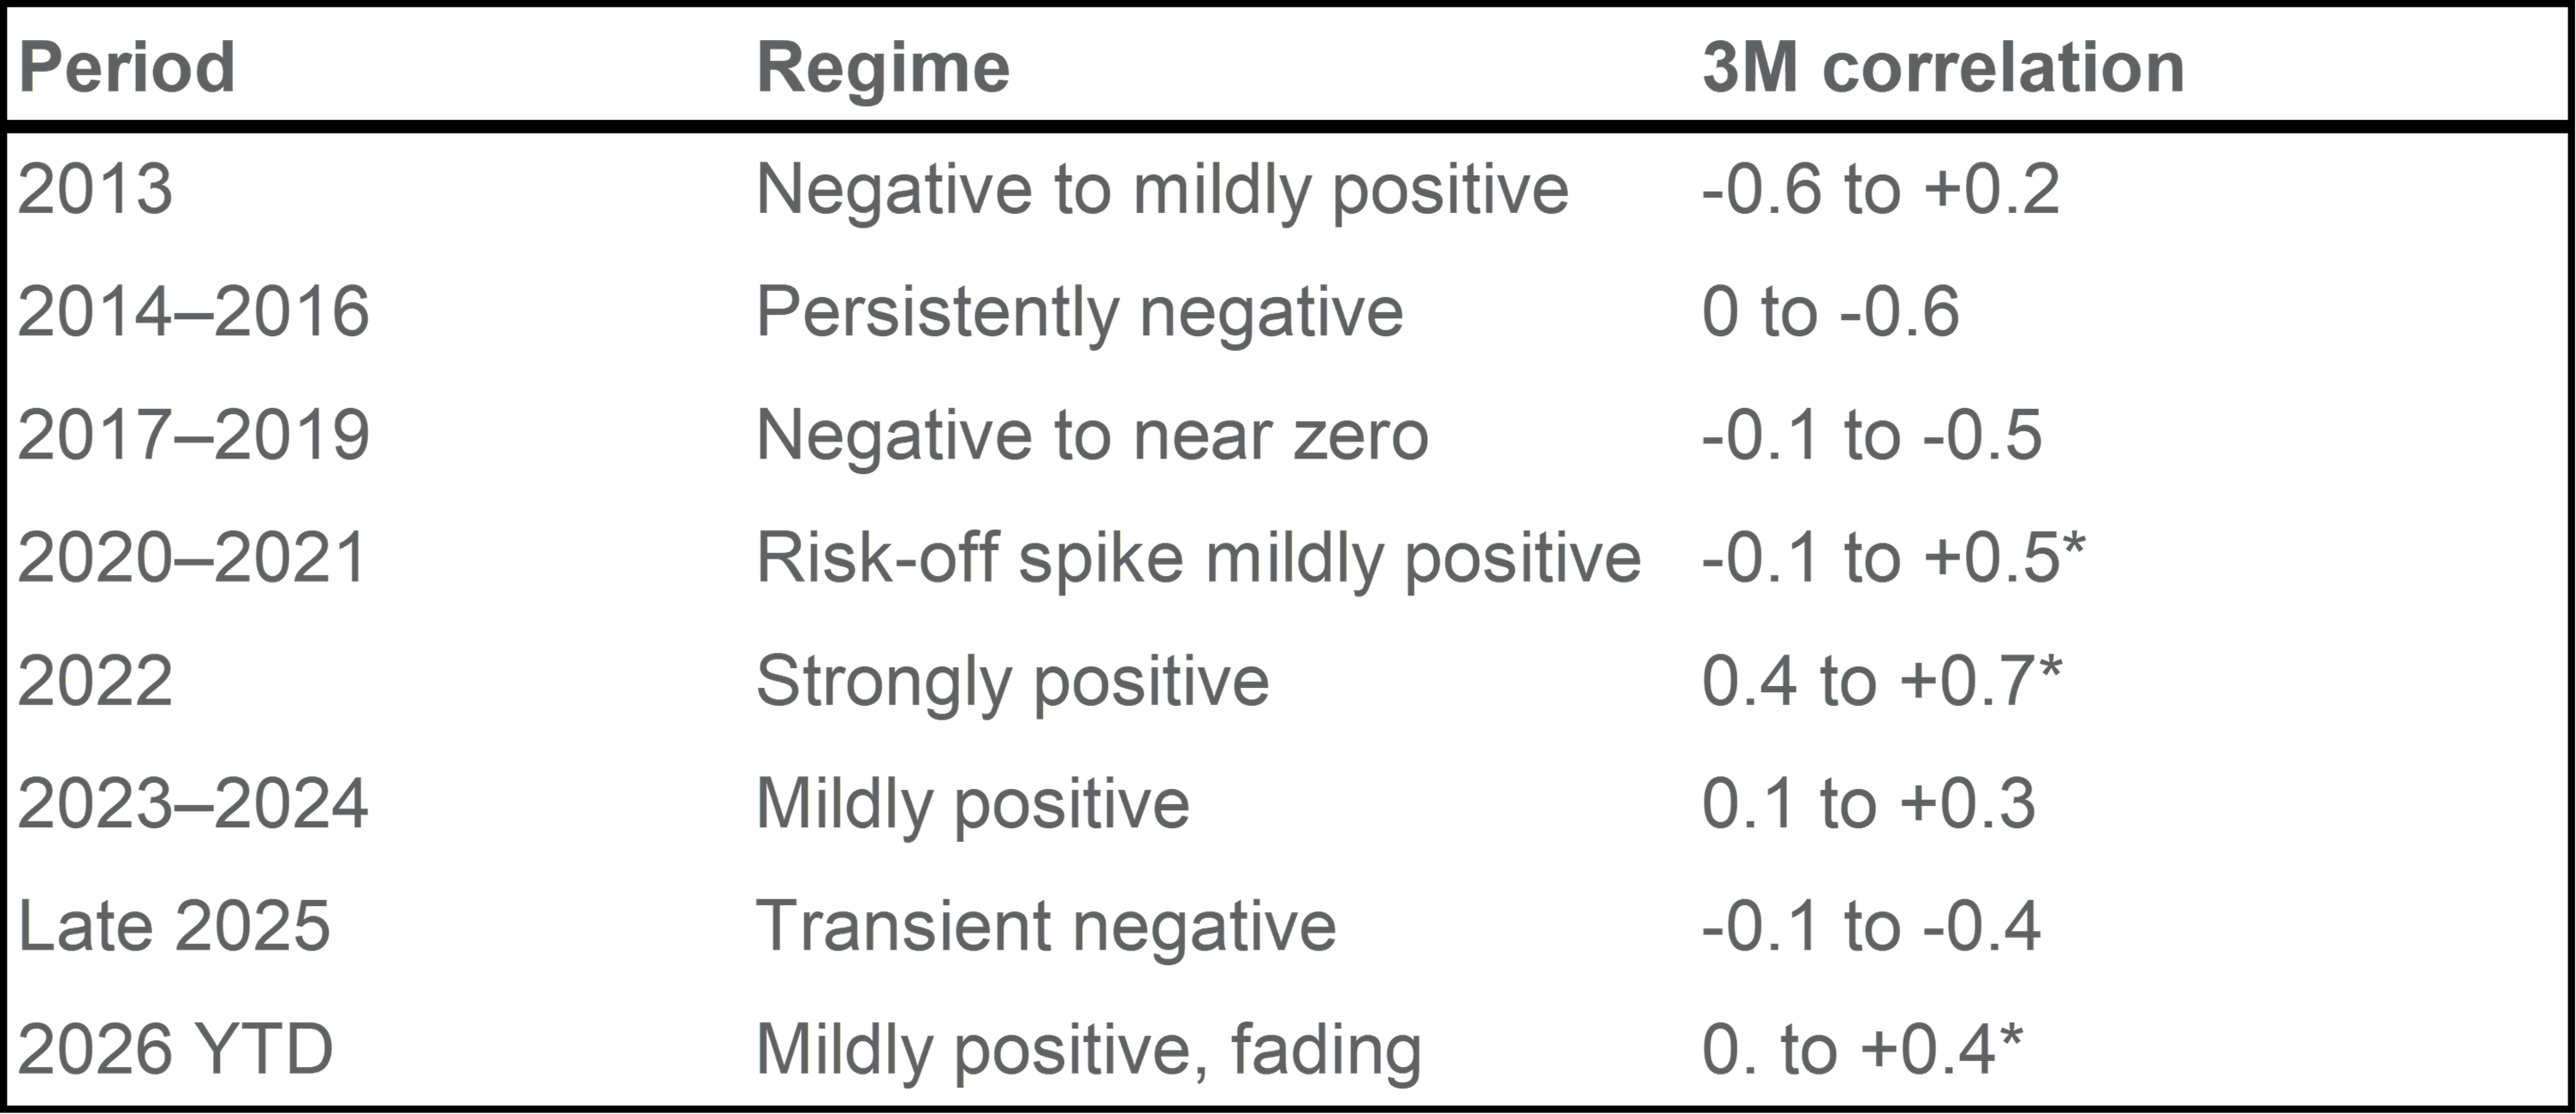
Since 2013, the three-month EURUSD–Stoxx 600 correlation has ranged from -0.6 to +0.7 but averaged near zero. It was negative during the 2014–2016 ECB easing and export recovery, then positive during common risk shocks. The 2022 peak simply reflected both assets falling together. Year-to-date ETF inflows total €14bn, above 2022–2024 levels but well below 2025. Active redemptions persist, suggesting tactical rather than structural demand.
The three-month correlation has fallen to +0.2 from above +0.35 in July and now sits below the six-month measure of +0.26, signaling that equity performance is decoupling from EUR. The decoupling strengthens the case for owning European equities without taking the accompanying EUR risk.
EXHIBIT #5: STOXX 600 VS. EURUSD IN A POSITIVE BUT FADING RELATIONSHIP
Source: BNY, Bloomberg. *Denotes risk-off driven simultaneous stock and currency sales
LatAm dominates the EUR-funded carry universe. High real yields, contained cross-volatility, and a rich funding currency make BRL, COP and MXN the clearest expression of the theme.
BRL, COP and MXN lead
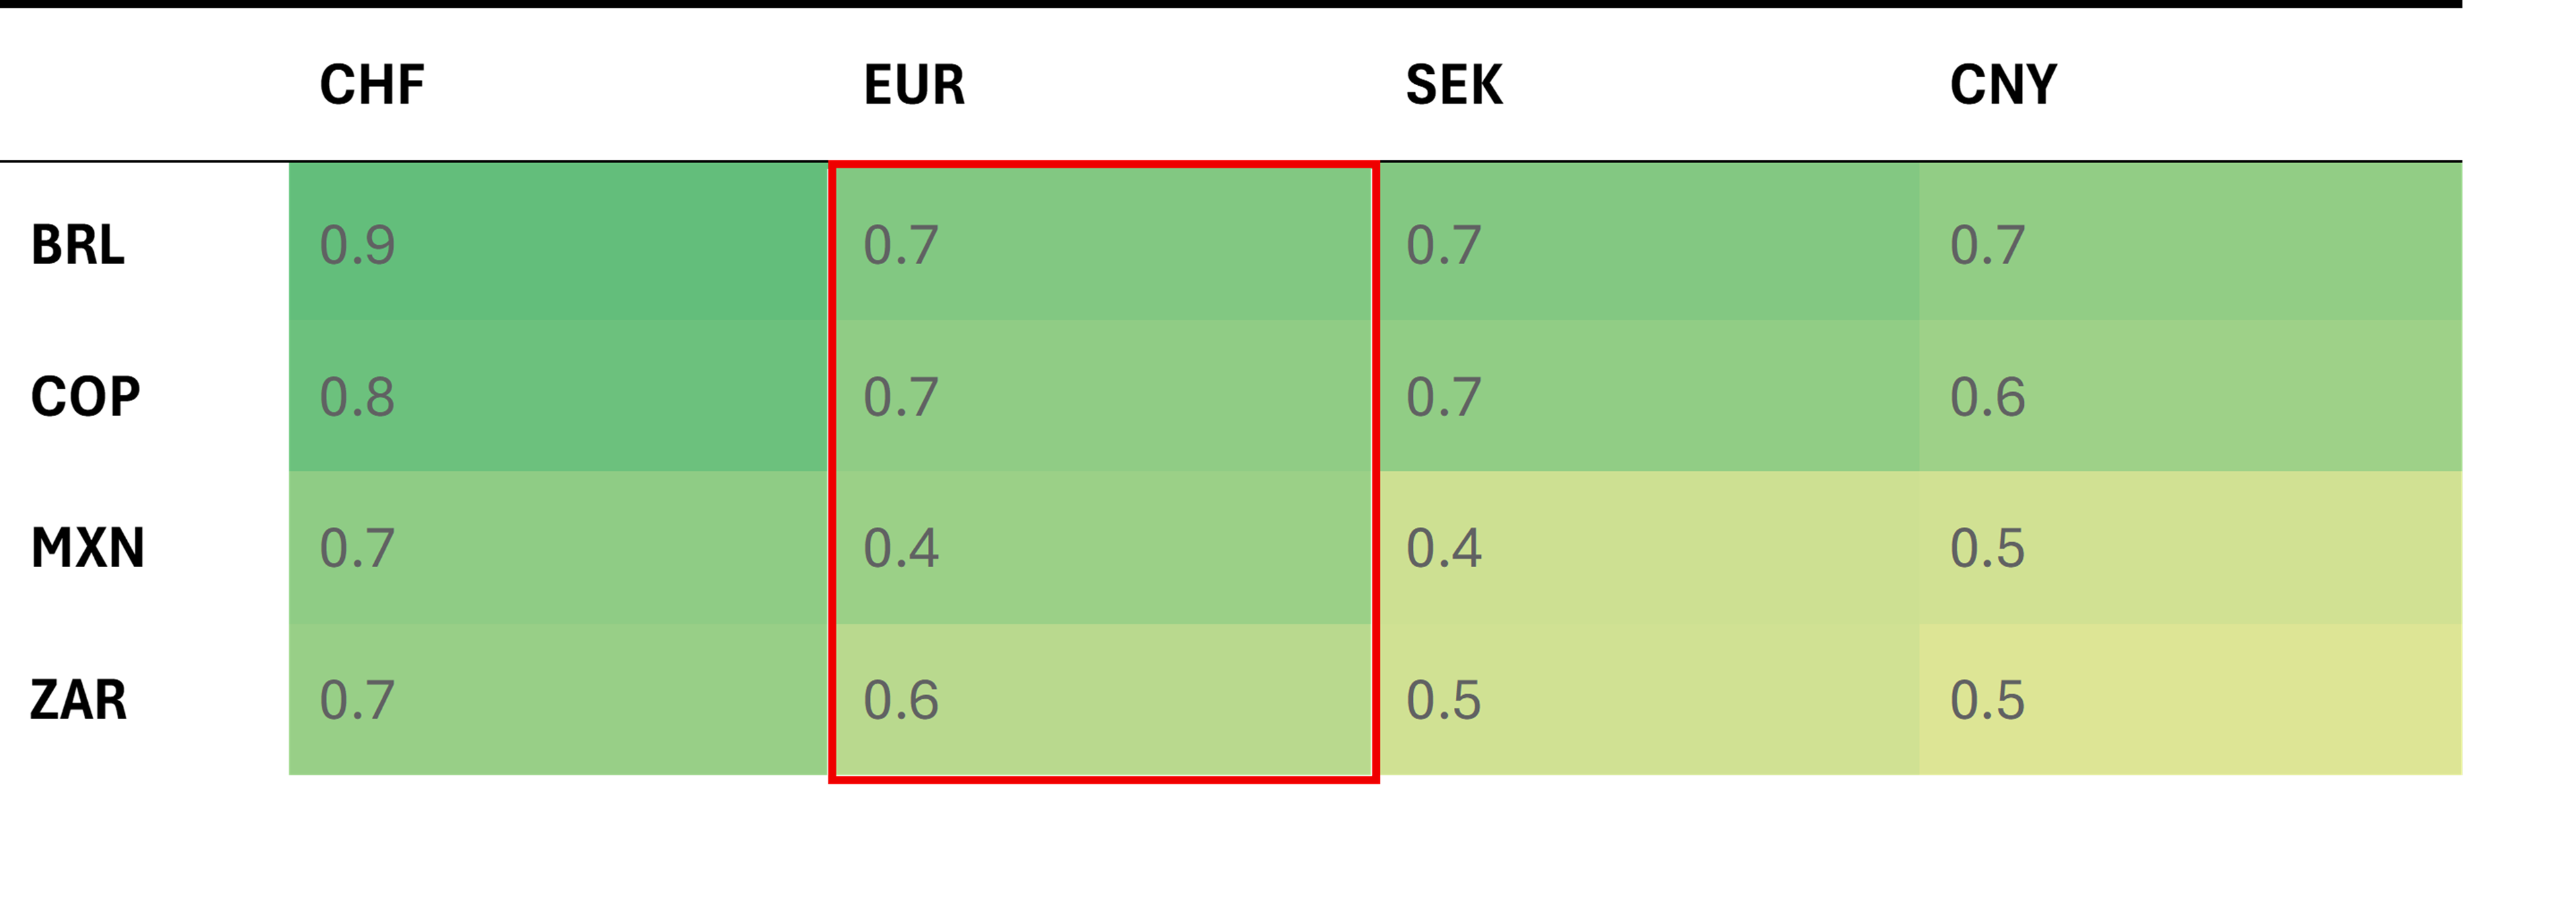
Carry-to-volatility ratios across the three currencies sit between 0.6 and 0.9, supported by attractive rate differentials and contained implied volatility.
CHF offers higher absolute ratios, but EUR provides deeper liquidity, avoids the higher cost and dollar-smile risk of USD, and offers a valuation tailwind if REER normalizes. The SNB has also recently shifted its policy tone, suggesting less tolerance for currency weakness.
Positioning remains supportive rather than crowded. Use COP and MXN alongside BRL, scaling into BRL as election risk clears. ZAR ranks lower, near 0.6, but adds geographical diversification.
Key risks are global risk-off, further ECB tightening and currency-specific shocks.
EXHIBIT #6: LATAM LEADS EUR-FUNDED CARRY-TO-VOLATILITY RANKINGS
Source: BNY, Bloomberg as of September 15, 2026
Realized volatility supports carry
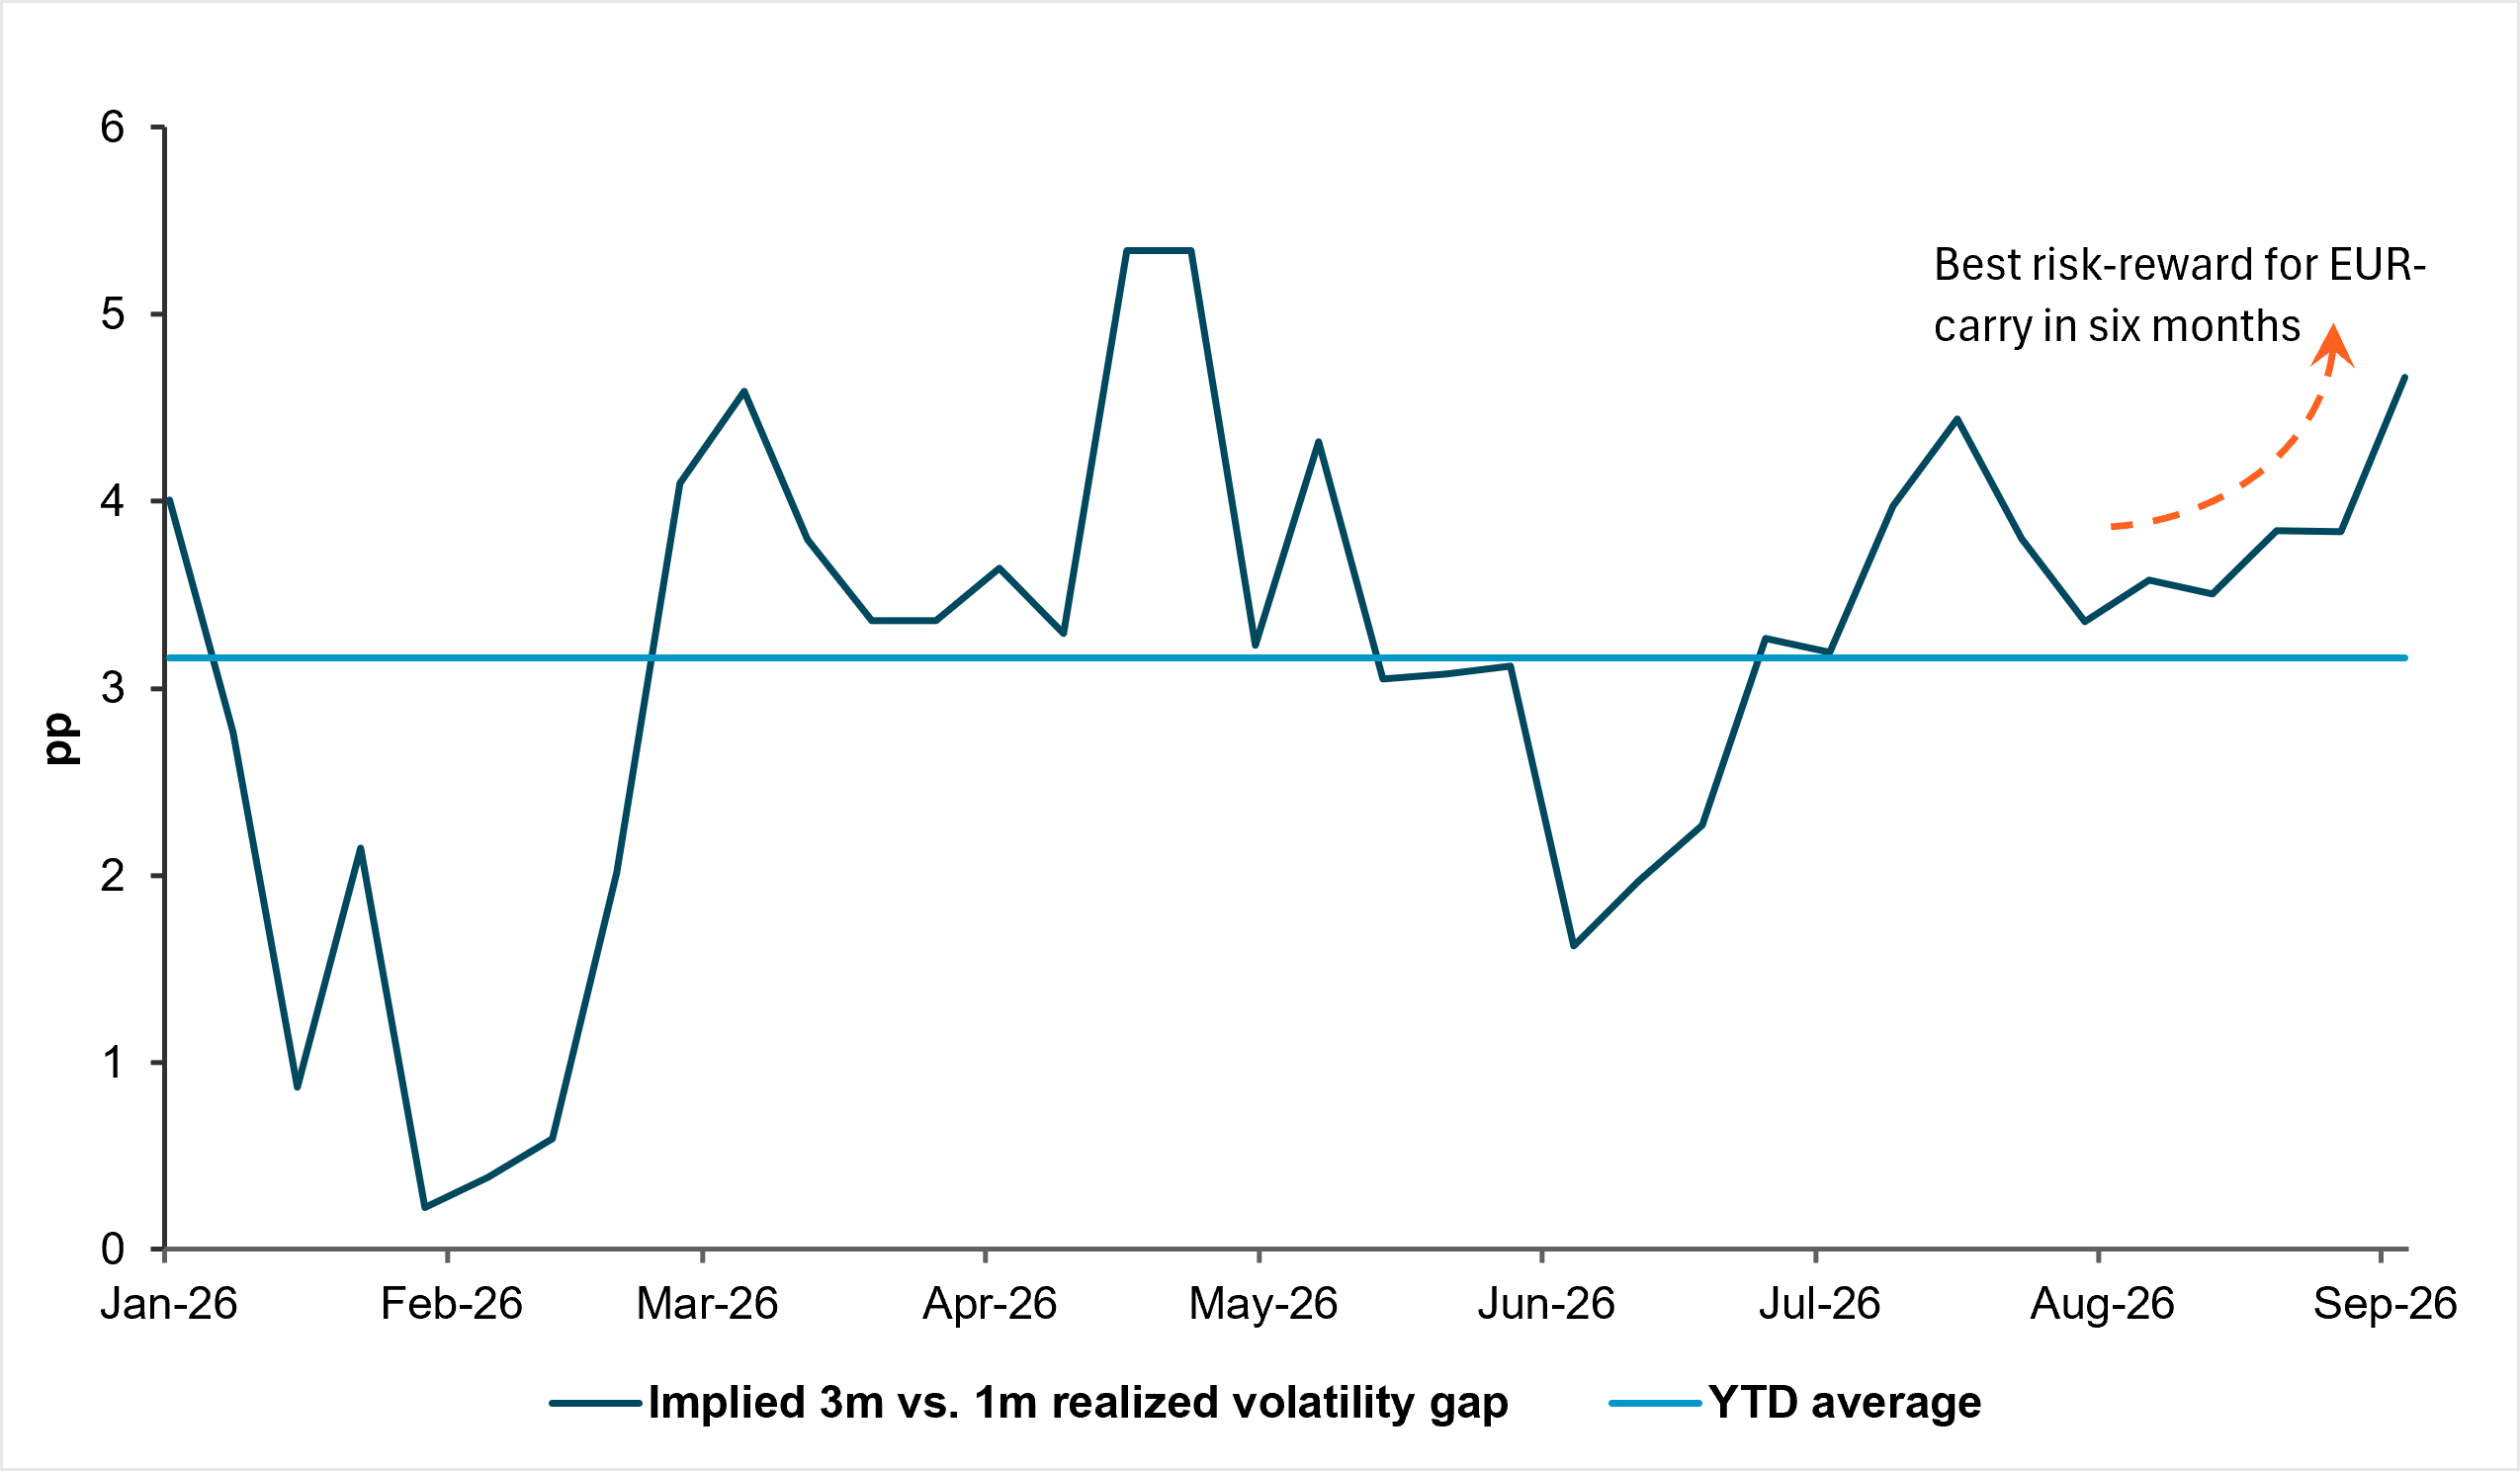
Our equal-weighted EUR-funded basket of BRL, COP, MXN and ZAR offers nearly 2% carry over three months. Bloomberg calculations put the basket’s implied volatility at 10.5%, compared with one-month realized volatility below 6%. This leaves a favorable carry-to-risk profile, while the implied–realized volatility gap is wider than for an equivalent USD-funded basket. The ECB hike has not materially changed the setup.
We therefore see low realized volatility and the wide implied–realized gap as supportive, but not as proof that the market is mispricing risk. The short realized-volatility window may understate the risk of sudden market moves or rising correlations among the currencies. EUR funding also leaves returns sensitive to moves in EURUSD.
We would reduce exposure to the EUR-funded basket if realized volatility rises, correlations among the carry currencies increase, or valuations and positioning suggest the trade is becoming crowded. We’ll track the implied–realized volatility gap to assess how the view evolves.
EXHIBIT #7: IMPLIED VOLATILITY ABOVE REALIZED VOLATILITY SUPPORTS CARRY
Source: BNY, Bloomberg; rising number supports risk-reward for trade; we acknowledge implied volatility may be overstated due to non-linearity