The next leg: rebalancing, rotation and new buyers
iFlow > Equities
An in-depth look each Friday at the factors shaping equities markets in developed and emerging economies around the world.
iFlow > Equities
An in-depth look each Friday at the factors shaping equities markets in developed and emerging economies around the world.

Bob Savage
Time to Read: 4 minutes
The focus on equities in the last week highlights a shifting market narrative: the story has moved from energy supply shocks and AI investment growth to rates, liquidity and policy responses. Rebalancing in June has always been a seasonal factor, with 2026 more prone to rotation and asset allocation shifts due to the significant rally in risk assets in the quarter.
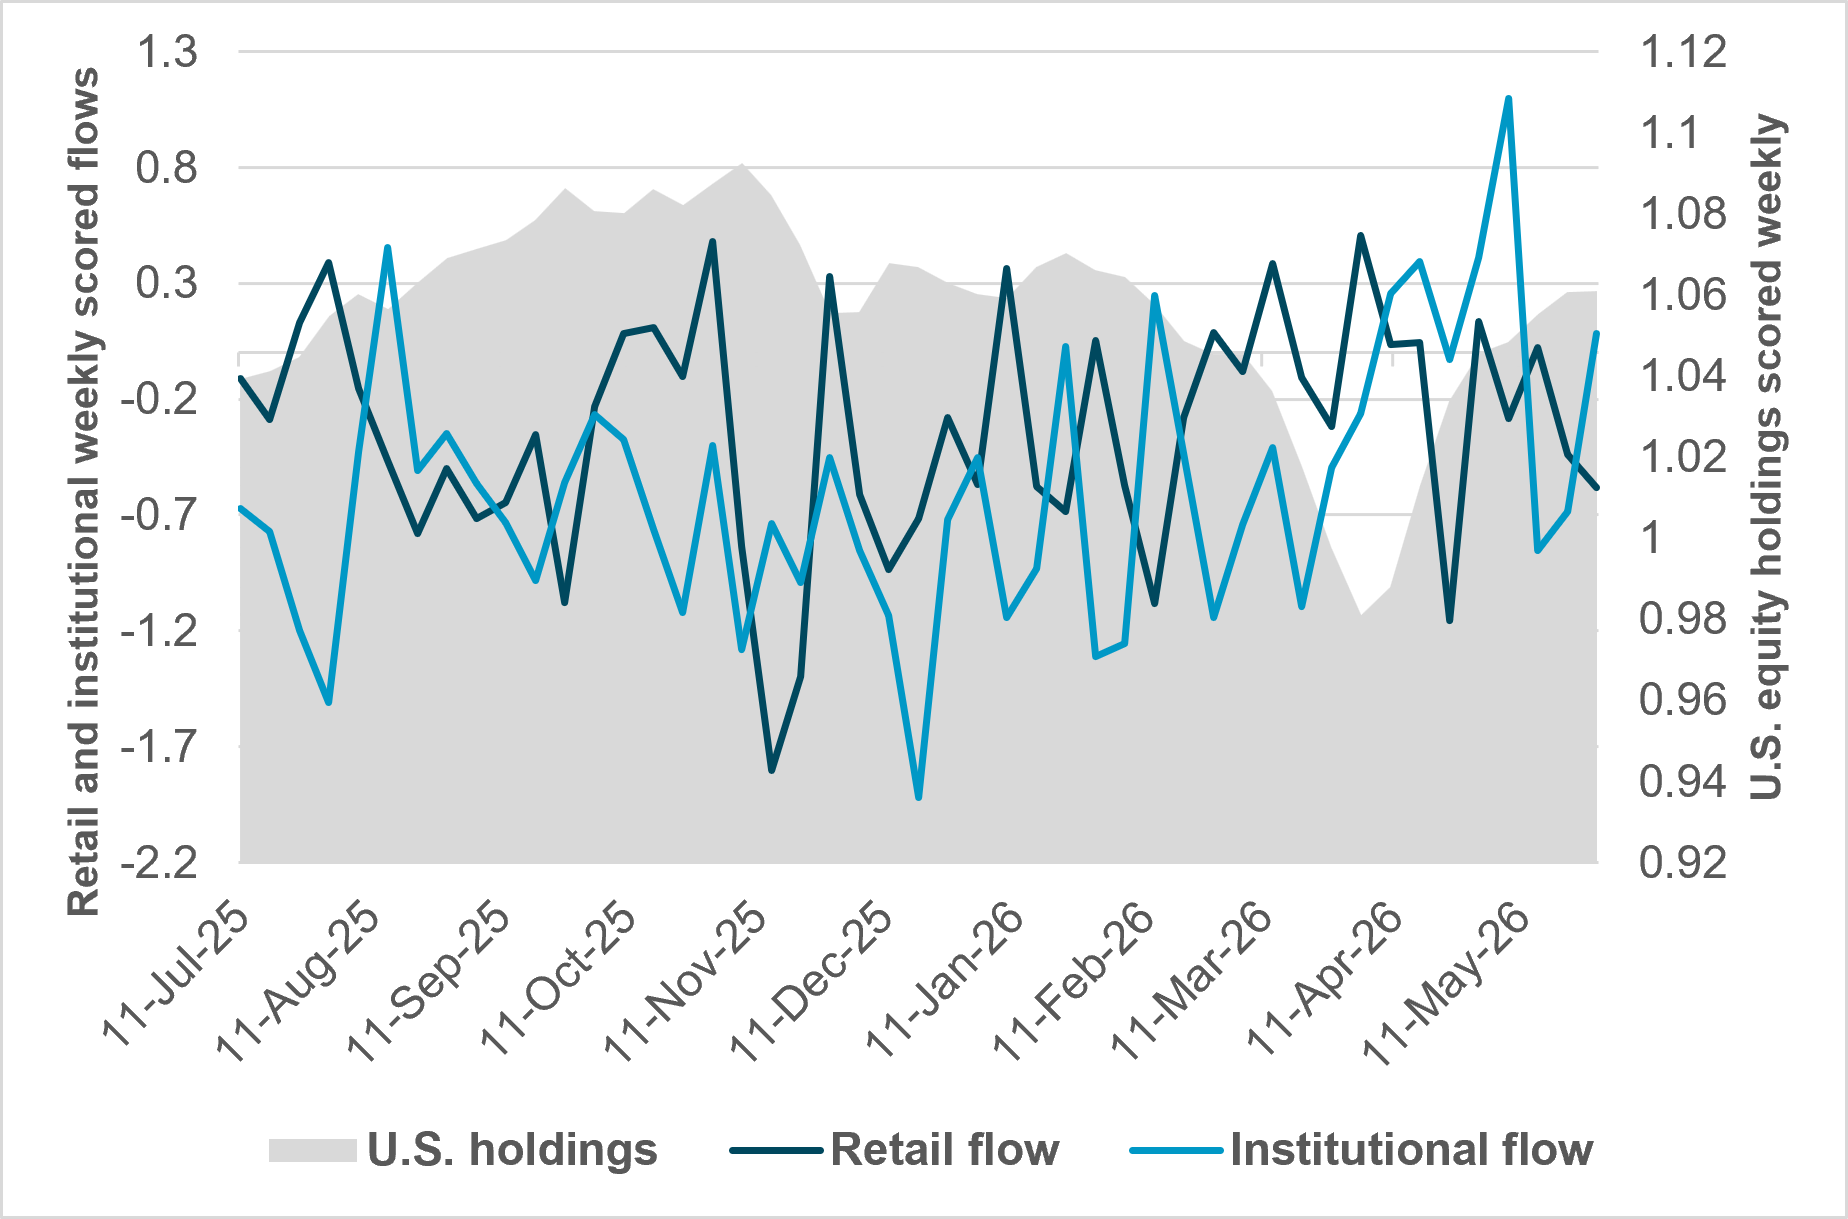
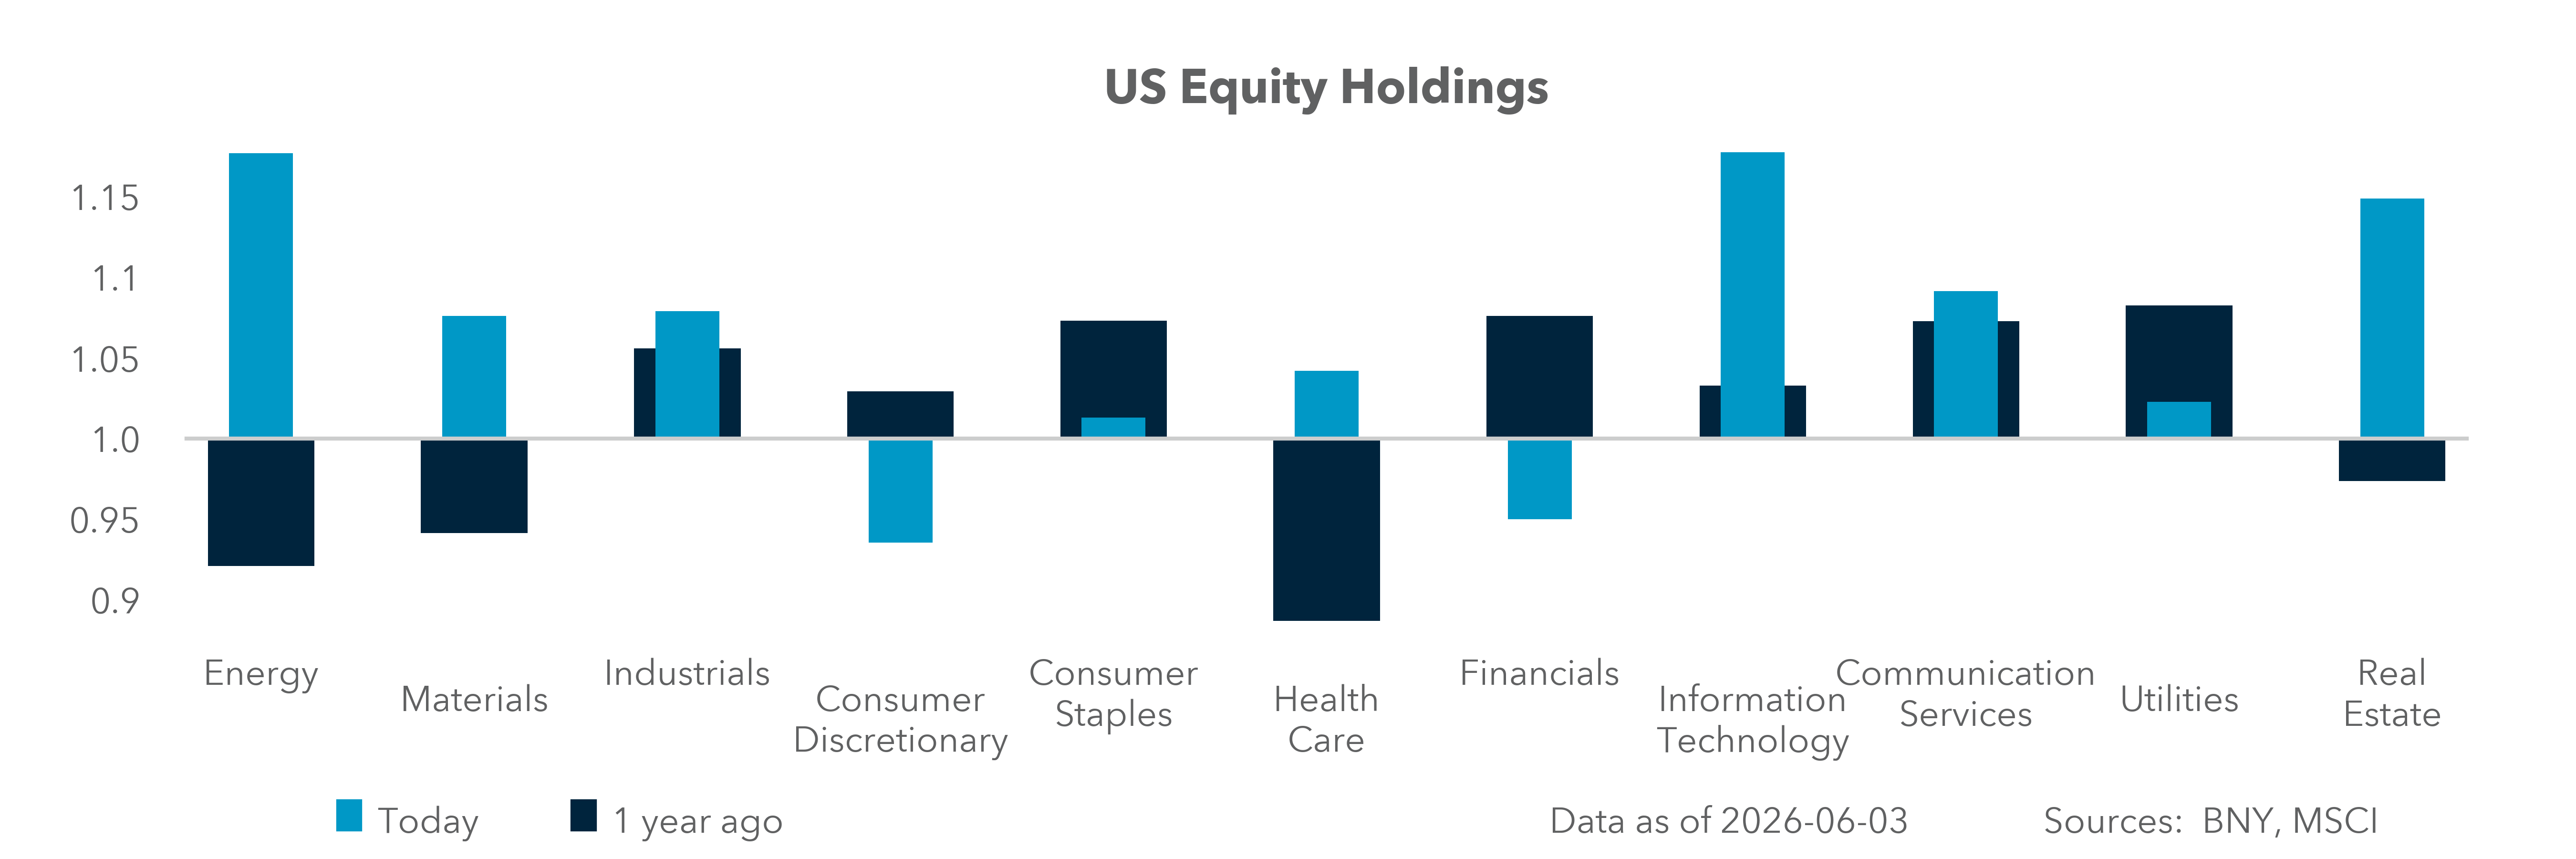
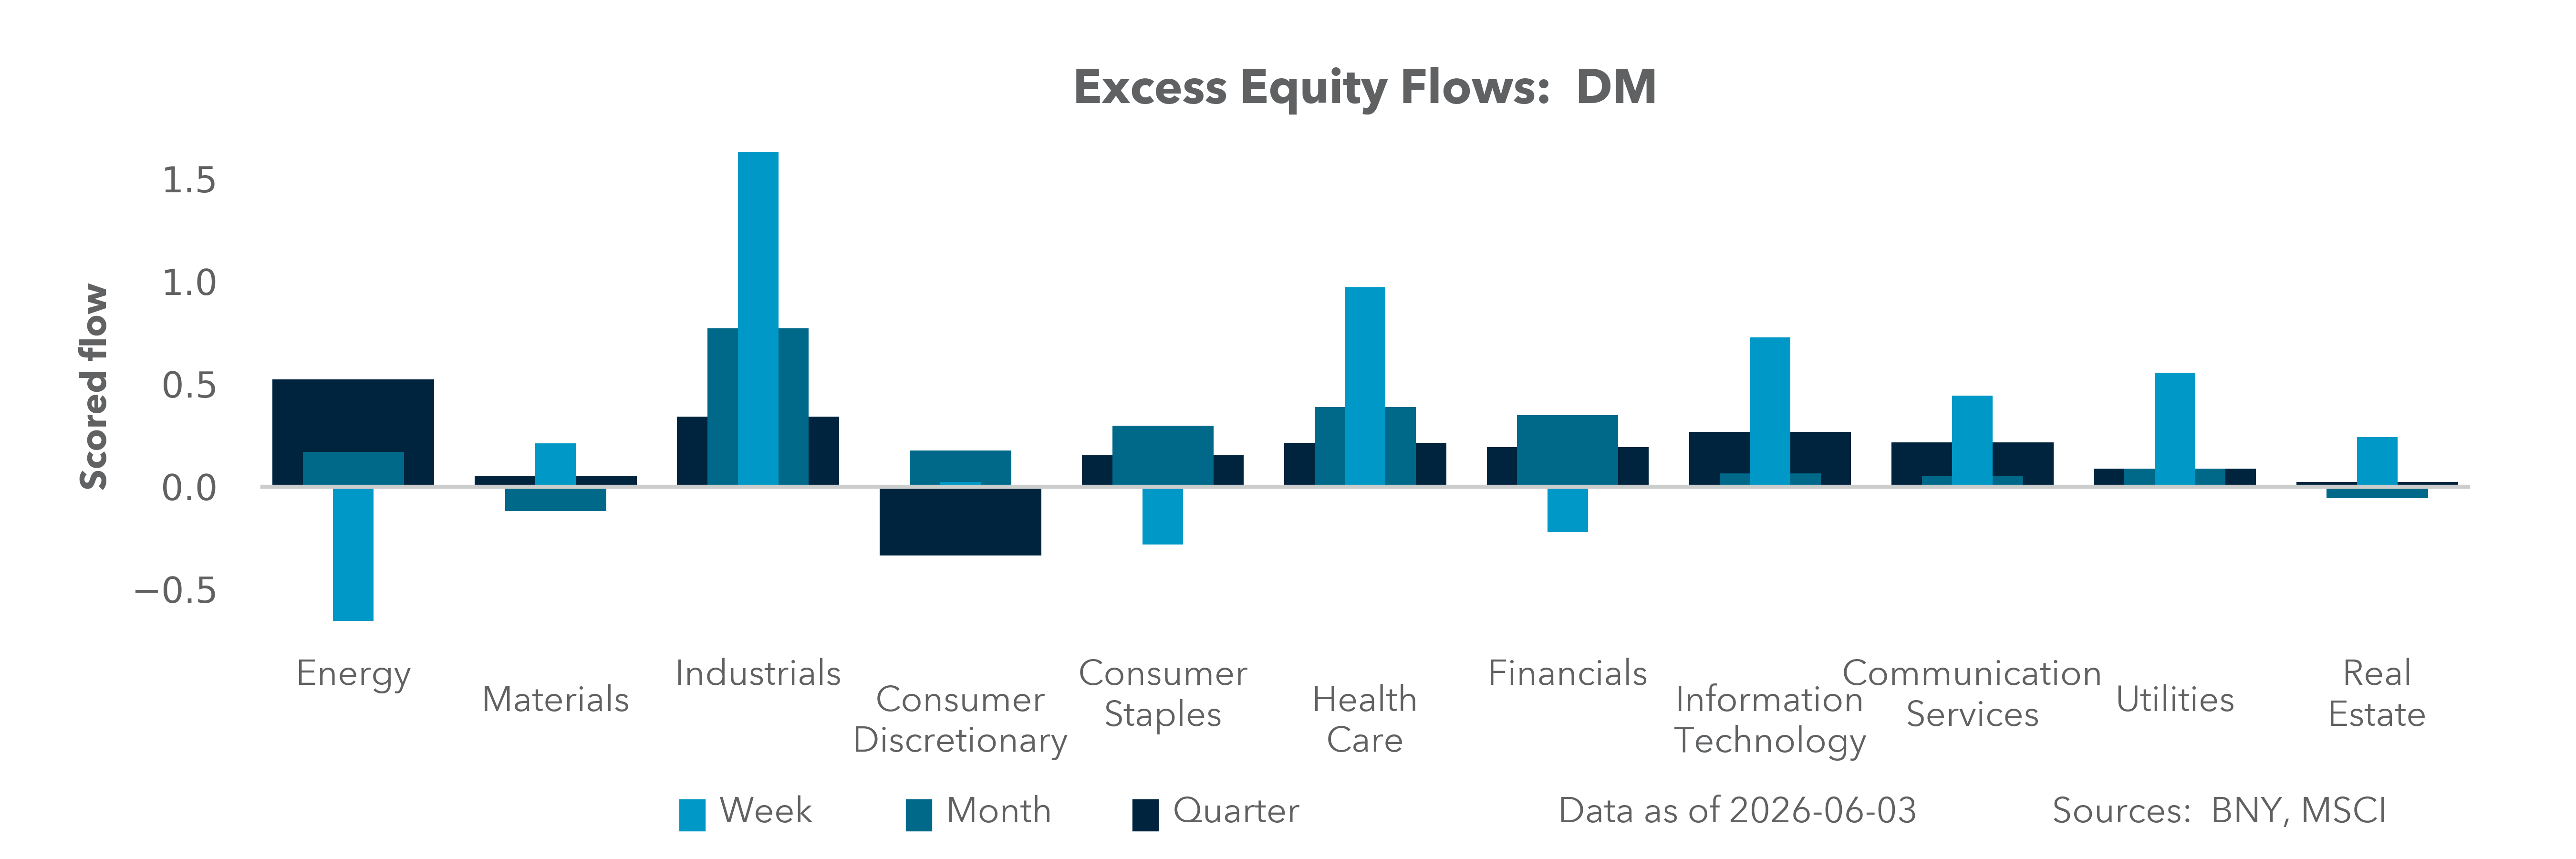
EXHIBIT #1: U.S. HOLDINGS AND FLOWS FROM RETAIL VS. INSTITUTIONS
Source: BNY
Our take
The noise of war has proved to be less a factor in driving U.S. equities. Investors, whether retail or institutional, clearly bought the dip from April. However, the momentum trade stalled for them before the tape. This week is the first drop in U.S. shares after nine weeks of gains. The holdings overall highlight that investors are harvesting the recent equity rally and diverting this money elsewhere. While our data cover real money and some retail investors, the marginal buyer over the last month has clearly been outside of those groups, with hedge fund and fast-money traders dominating alongside the usual buyback pressure from corporations, reflecting their Q1 earnings.
Forward look
The June quarter-end and half-year-end rebalancing is key to understanding the current environment in equities, particularly in the U.S. Institutional holdings in energy and IT are outsized – over 20% above the 10-year average in the U.S. and even more in emerging markets. Retail positioning is no different. The role of the war in driving the buy-the-dip process has lost momentum. The next focus will likely move to liquidity and earnings growth. IPOs from SpaceX and Anthropic will be watched to see if there is selling pressure to make room for additions to the IT sector. Bond yields and FOMC rate policy will also be important factors.
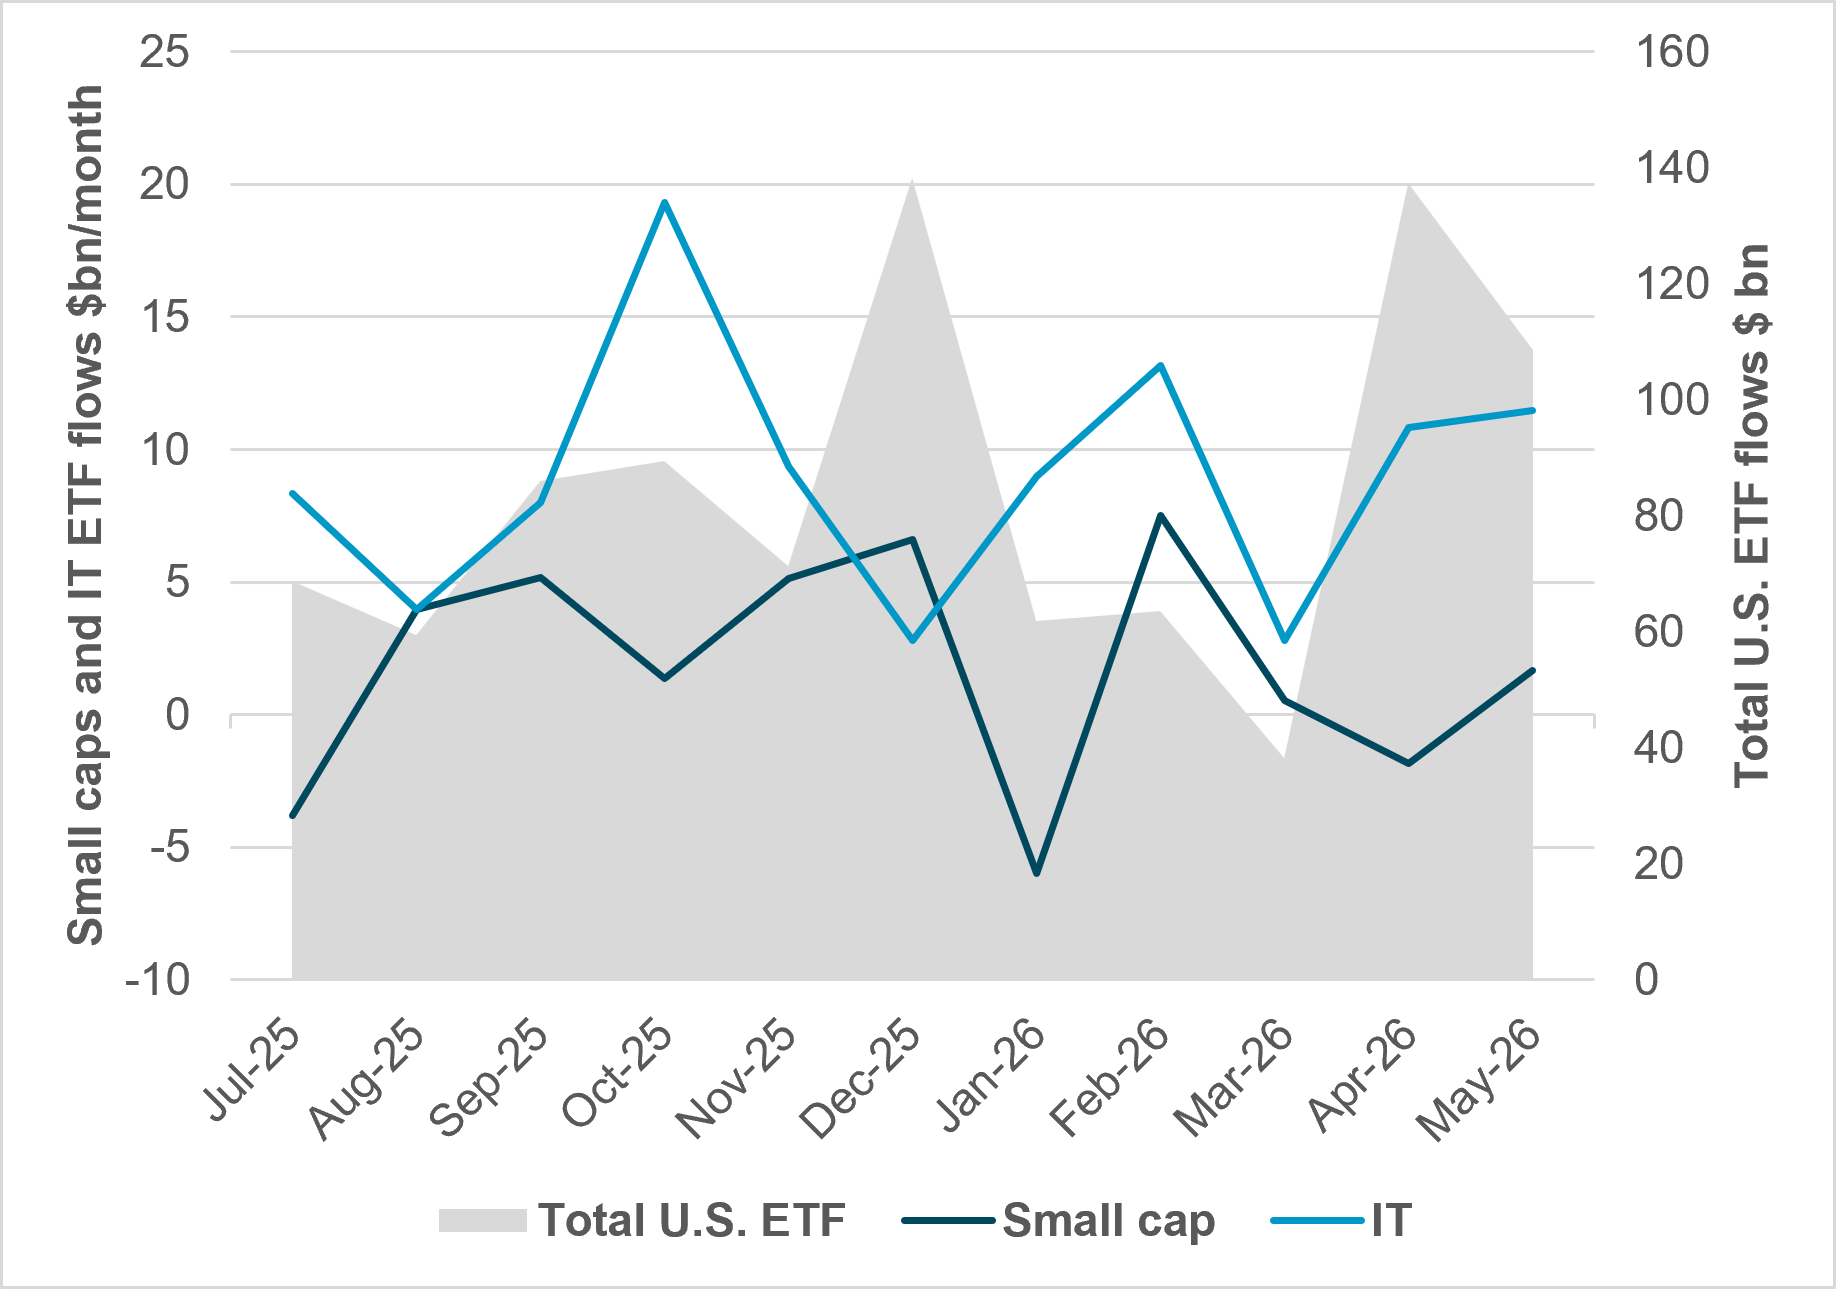
EXHIBIT #2: TOTAL U.S. ETF FLOWS: SMALL CAPS VS. IT SECTOR
Source: BNY, Bloomberg
Our take
The IT sector remains a larger driver of flows in equities than small and medium enterprises (SME). Institutions appear to be using ETFs as temporary holding vehicles, while retail investors are actively trading them. Both IT and SME flows track our iFlow data well and highlight that real money and retail investors showed little interest in May relative to other market participants. The types of ETFs overall are important to watch. Levered equity ETFs are now over $300bn in AUM and control over $750bn in global equities, with daily rebalancing needs for a 1% move estimated to be $12–$18bn. The overall AUM of this type of ETF is up 50% year to date and has accounted for $252bn in equity flows through the end of May.
Forward look
There is a risk for June in U.S. equities from a larger unwind of the energy and IT trades. The question is whether the “buy-the-dip” reaction function will be the same should there be a catalyst for a retracement. Liquidity will clearly be a focus given the focus on private credit, IPOs and shifting rates from the BOJ, ECB and other central banks.
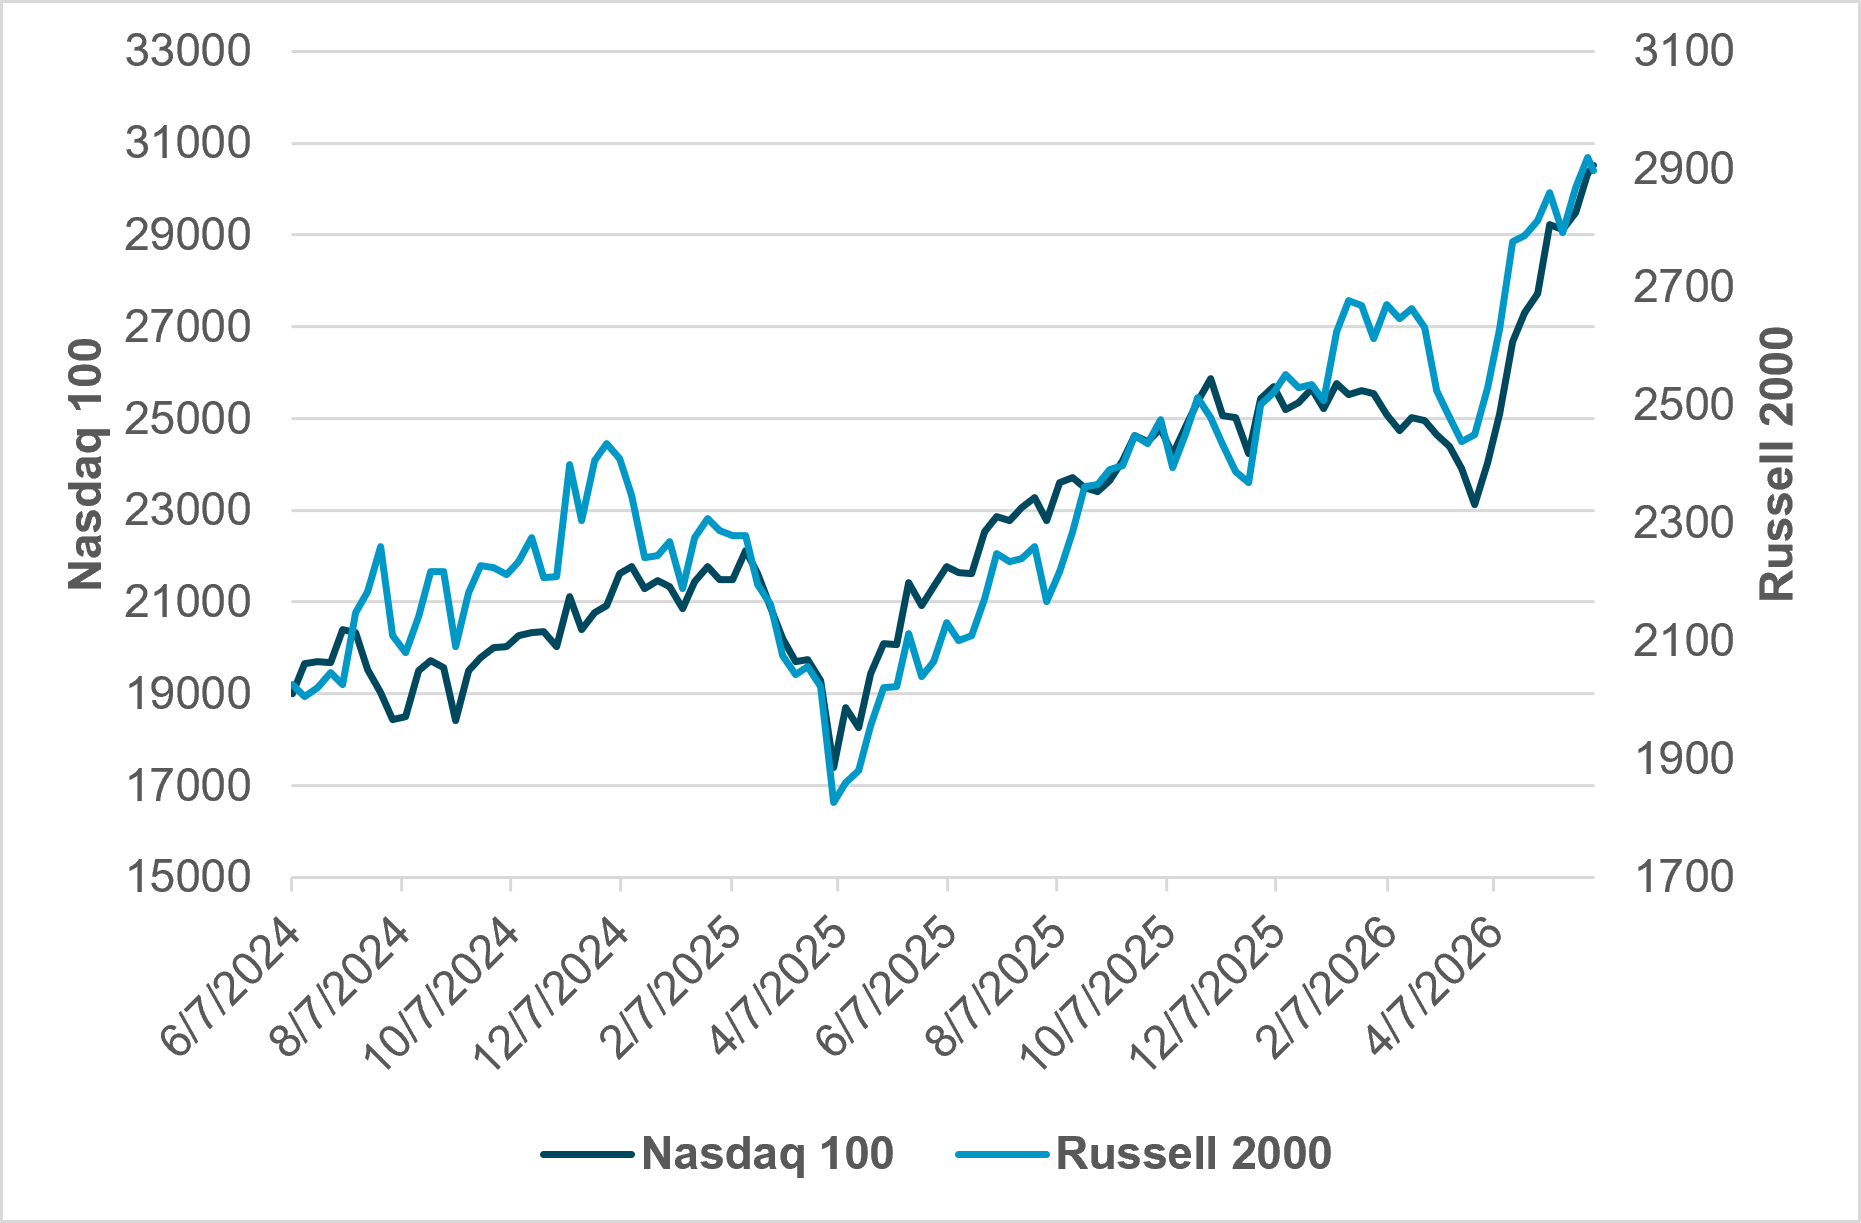
EXHIBIT #3: RUSSELL 2000 AND NASDAQ 100 PERFORMANCE
Source: BNY, Bloomberg
Our take
Since the end of March, the technology-heavy Nasdaq index has risen 33.5%. The Russell 2000 index is also up 21.6% in the same period. The small and medium-sized company index has a P/E of 29 and an EV/Sales ratio (estimated value) of 2.2. Energy, technology and industrials are dominant in the index. The Nasdaq has a P/E of 35.5 and EV/Sales of 6.7. The role of rate expectations from the Fed shows clearly in how the two indices differ, with rate cut expectations for Q4 2025 driving the Russell 2000 outperformance.
Forward look
The shift in rate expectations for the Fed from cutting to hiking has yet to be fully reflected in the Russell 2000 index. The risk of higher-for-longer policy should matter to equities. The other risk to both the Nasdaq and Russell 2000 comes from inflation. The erosion of earnings from energy and other supply shocks, including semiconductor chips, will be a focus heading into Q2 earnings season.
As equities move into the second half of the year, the market appears to be entering a new phase where liquidity, earnings delivery and policy expectations matter more than geopolitical headlines. The strong recovery from the April lows has left both institutional and retail investors with elevated exposure to energy and technology, increasing the importance of quarter-end and half-year-end rebalancing flows. While corporate buybacks and fast-money investors have supported recent gains, the durability of the rally will increasingly depend on the willingness of long-term investors to add risk at current valuations.
The key question is whether the buy-the-dip mentality remains intact if markets face a more meaningful correction driven by higher-for-longer interest rates, persistent inflation, or earnings disappointments. Upcoming IPO activity, evolving central bank policy, and Q2 earnings will provide important tests of investor confidence. We expect greater sector rotation and wider performance dispersion, with fundamentals becoming increasingly important as the market transitions from momentum-driven gains toward a more selective and valuation-sensitive environment.