Momentum, valuations and the IPO test
iFlow > Equities
An in-depth look each Friday at the factors shaping equities markets in developed and emerging economies around the world.
iFlow > Equities
An in-depth look each Friday at the factors shaping equities markets in developed and emerging economies around the world.

Bob Savage
Time to Read: 5 minutes
The ECB raised rates 25bp to 2.25% as expected this week. Bank Indonesia raised rates 25bp to 5.5% in a surprise move. FX and inflation concerns drove both actions. Rate hike risk from the Bank of Japan and others extends into next week, adding to global liquidity tightening pressure. The week also delivered the largest IPO in history with SpaceX, raising $75bn with a $1.77tn valuation. Since 1980, IPOs perform better in Fed rate-cutting cycles than in hiking cycles. The average IPO return 12 months after the first day of trading is 5%. However, in a rate easing cycle, returns rise to 10–20%, while in a hiking cycle they drop to between -5% and +5%. That dynamic sets the tone for summer risk appetite. FOMC Chairman Kevin Warsh’s first meeting will be key for signaling the Fed’s policy bias. Whether this becomes a rotation or a broader pullback depends on the bond/equity allocation decisions investors face at month and quarter end. Cash deployment into equities will remain a key indicator for risk reversals.
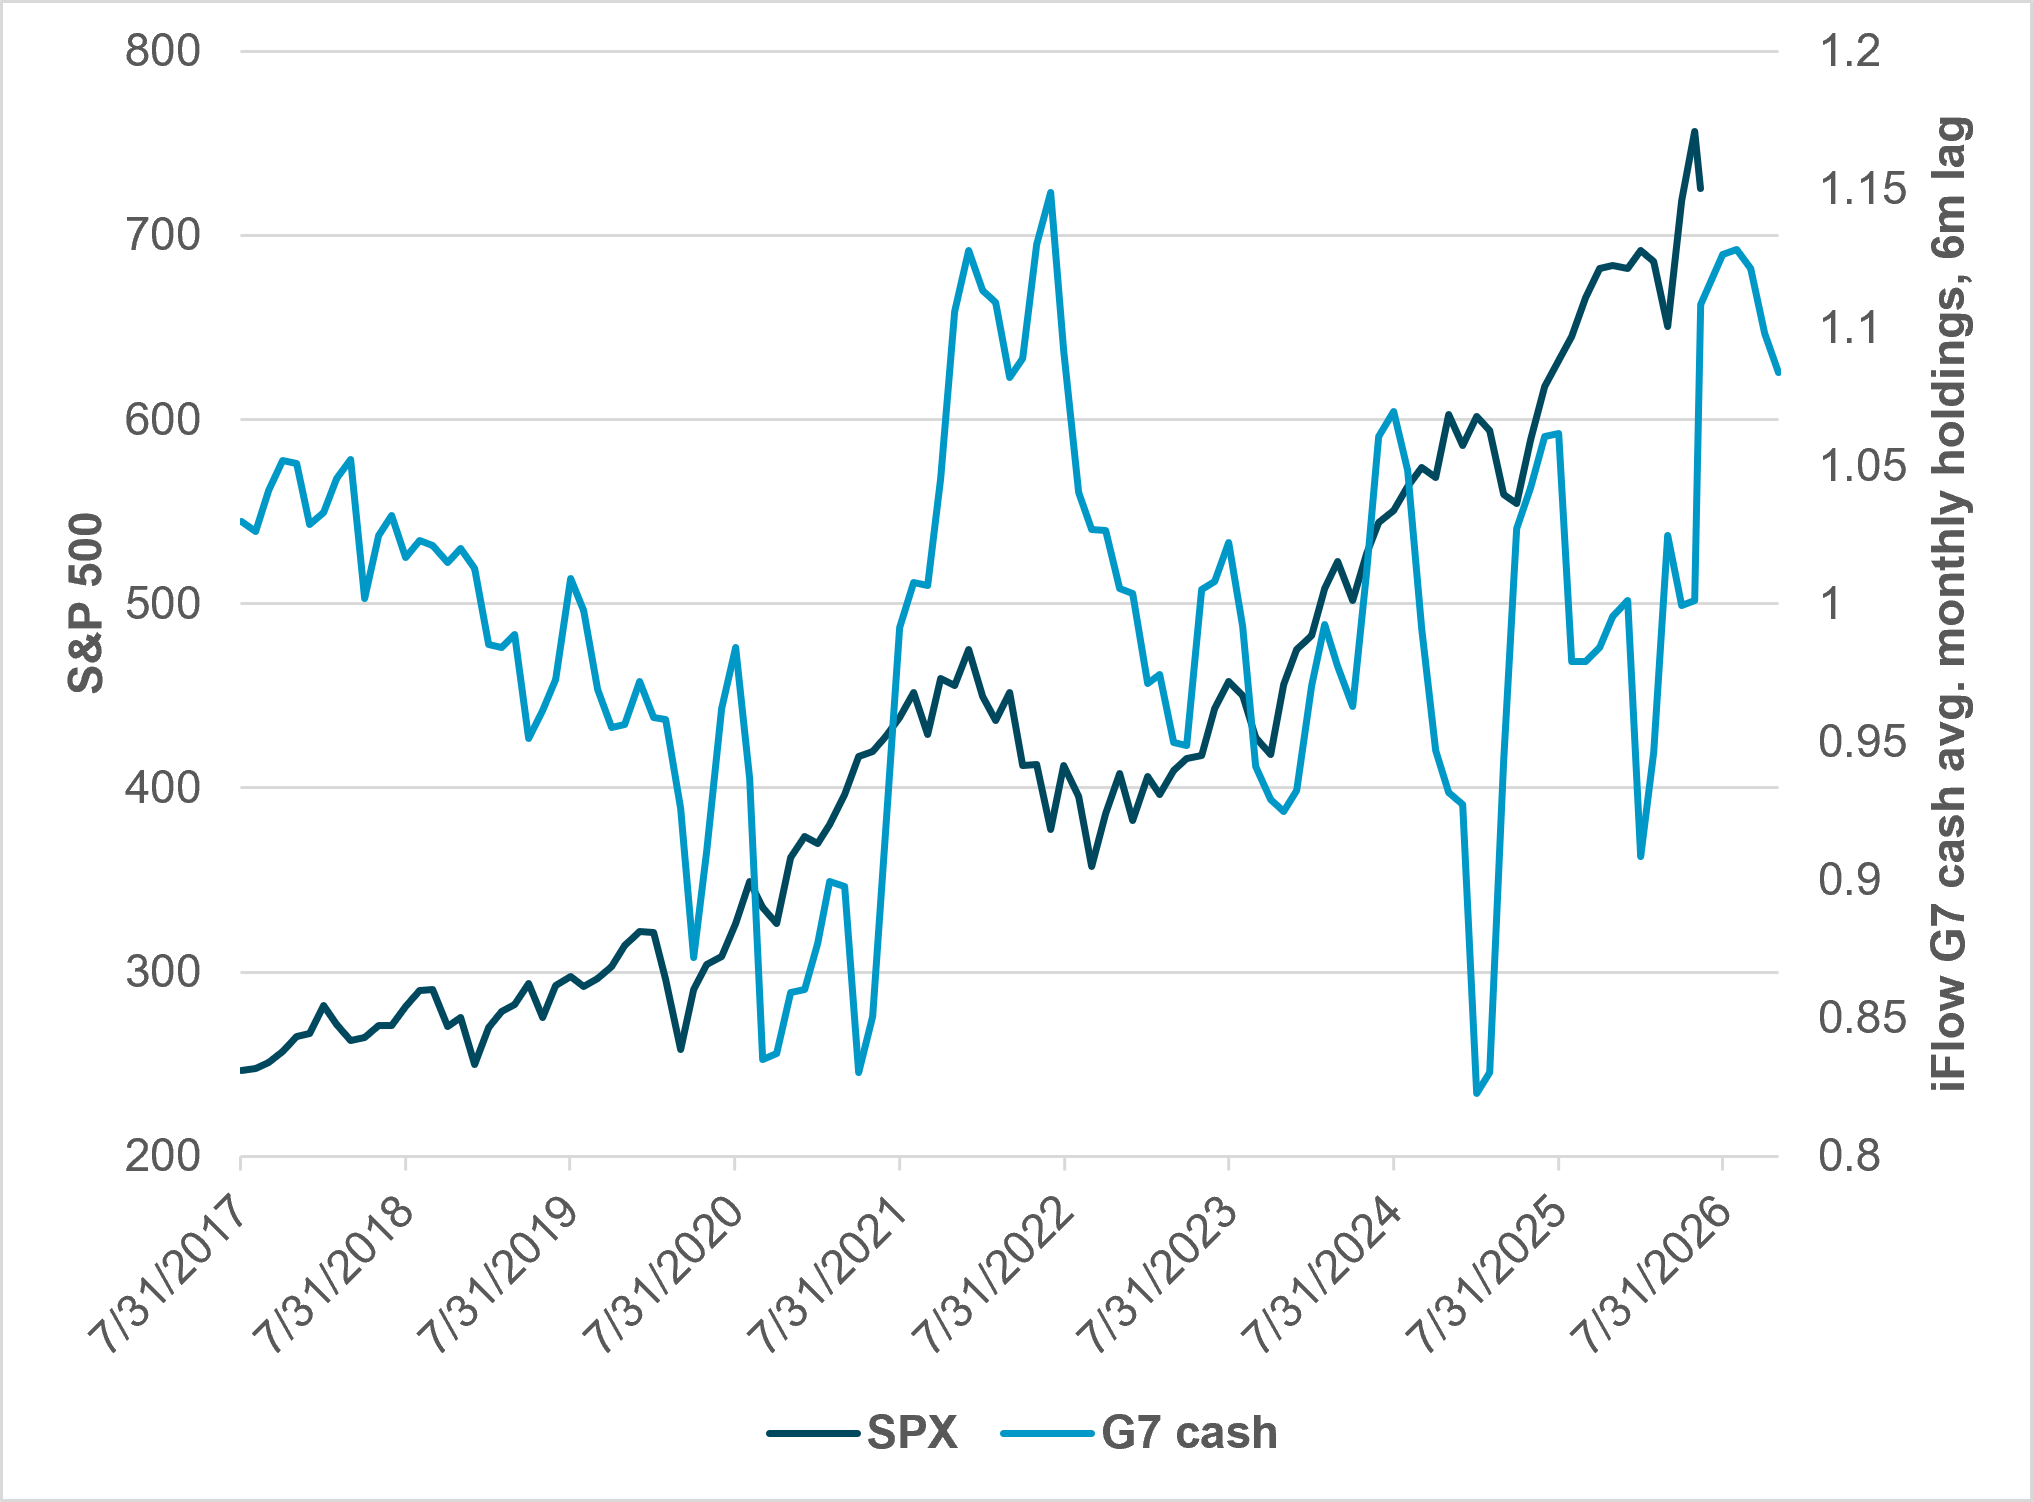
EXHIBIT #1: G7 MONTHLY CASH HOLDINGS, SIX-MONTH LAG VS. S&P 500
Source: BNY, Bloomberg
Our take
Some of the key drivers for equities in the last decade have been low-interest rate policy and high government spending. Measuring cash on the sidelines is not a simple exercise. Cash in money markets at $7.5tn is a nominal size measure as it should be compared against the asset inflation of stocks and other investments. Household cash as a percentage of financial assets reflects retail positioning bias. Bank deposits and M2 measures vary globally, making fund manager cash levels the preferred contrarian indicator. Looking at cash holdings in iFlow is a bit of all four measures. Using the G10 markets as a base for cash is an important twist given the role of U.S. equities in positioning. iFlow institutional cash holdings began tracking the S&P 500 more closely from Covid onward. The magnitude of the peak-to-trough move matters less than the turning points themselves as a timing signal for equity volatility. The current decline in cash holdings looks likely to continue, consistent with previous episodes.
Forward look
The current pullback in cash holdings is modest compared to Covid or the Russia invasion of Ukraine, but the peaks have been good indicators for reversals in equity trends, with one exception: Liberation Day. Cash buying-the-dip remains the dominant narrative. Cash holdings are currently sitting near their 10-year average. That proximity, combined with the buy-the-dip dynamic, suggests room for further momentum buying on a 5–10% correction.
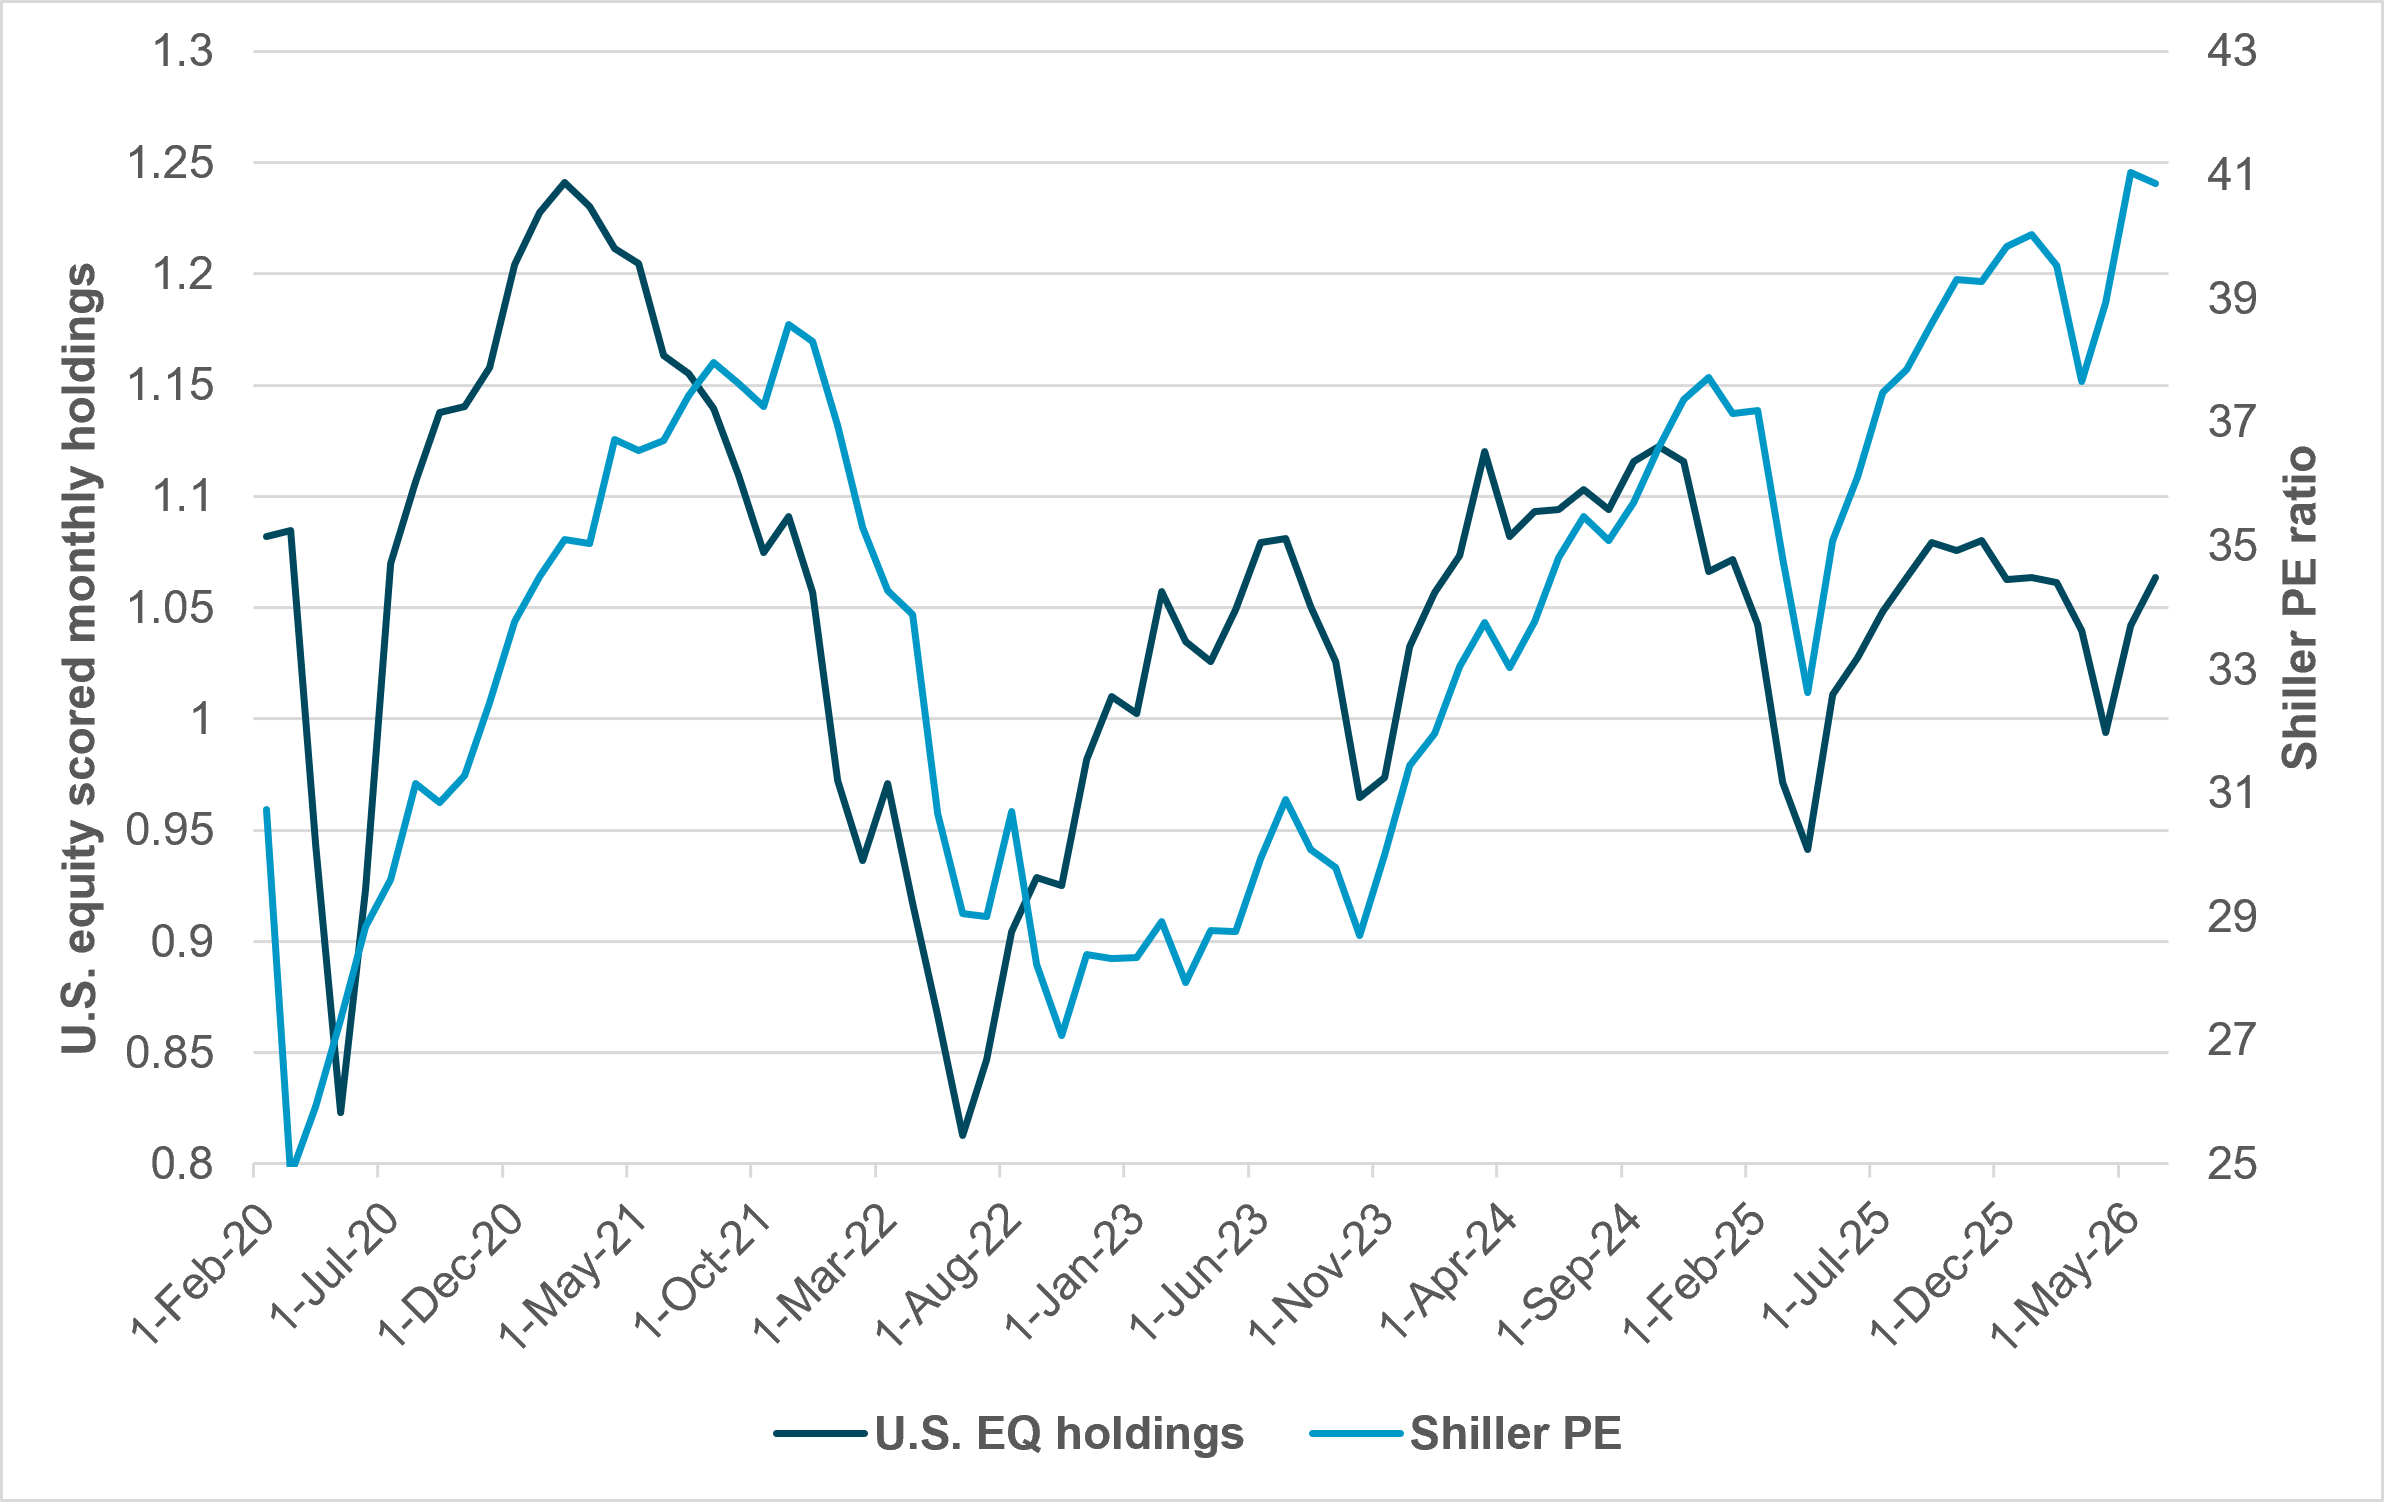
EXHIBIT #2: IFLOW U.S. EQUITY HOLDINGS VS. SHILLER PE RATIO
Source: BNY, Shiller CAPE
Our take
The correlation between holdings and the Shiller PE has been significant, with some lag and notable breaks during periods of rate policy shifts. The current divergence of the index from holdings suggests that investors are wary of the high valuations driving increasing stock issuance. Higher CAPE has generally been linked to higher cash holdings – some of it defensive positioning ahead of an anticipated mean reversion. The IPOs in the weeks ahead are part of the same story.
Forward look
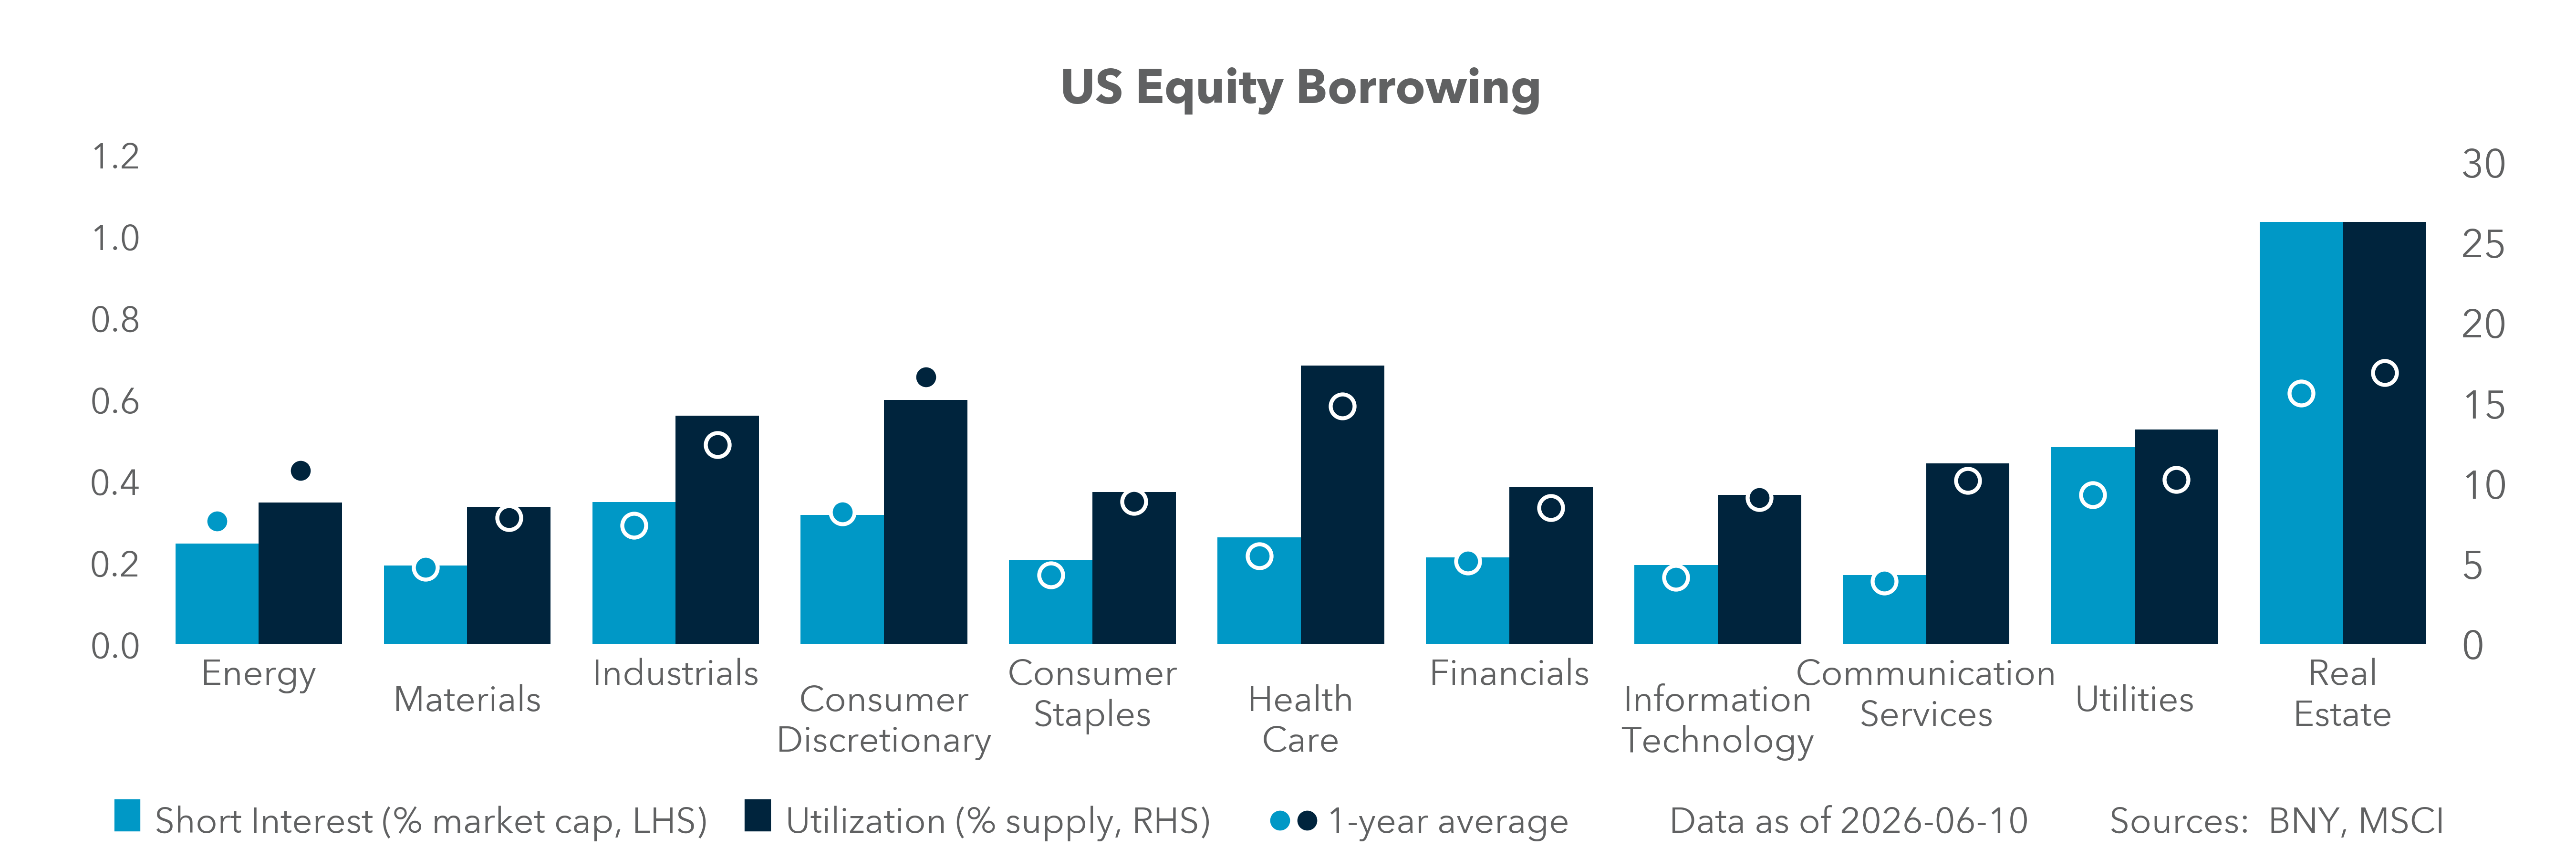
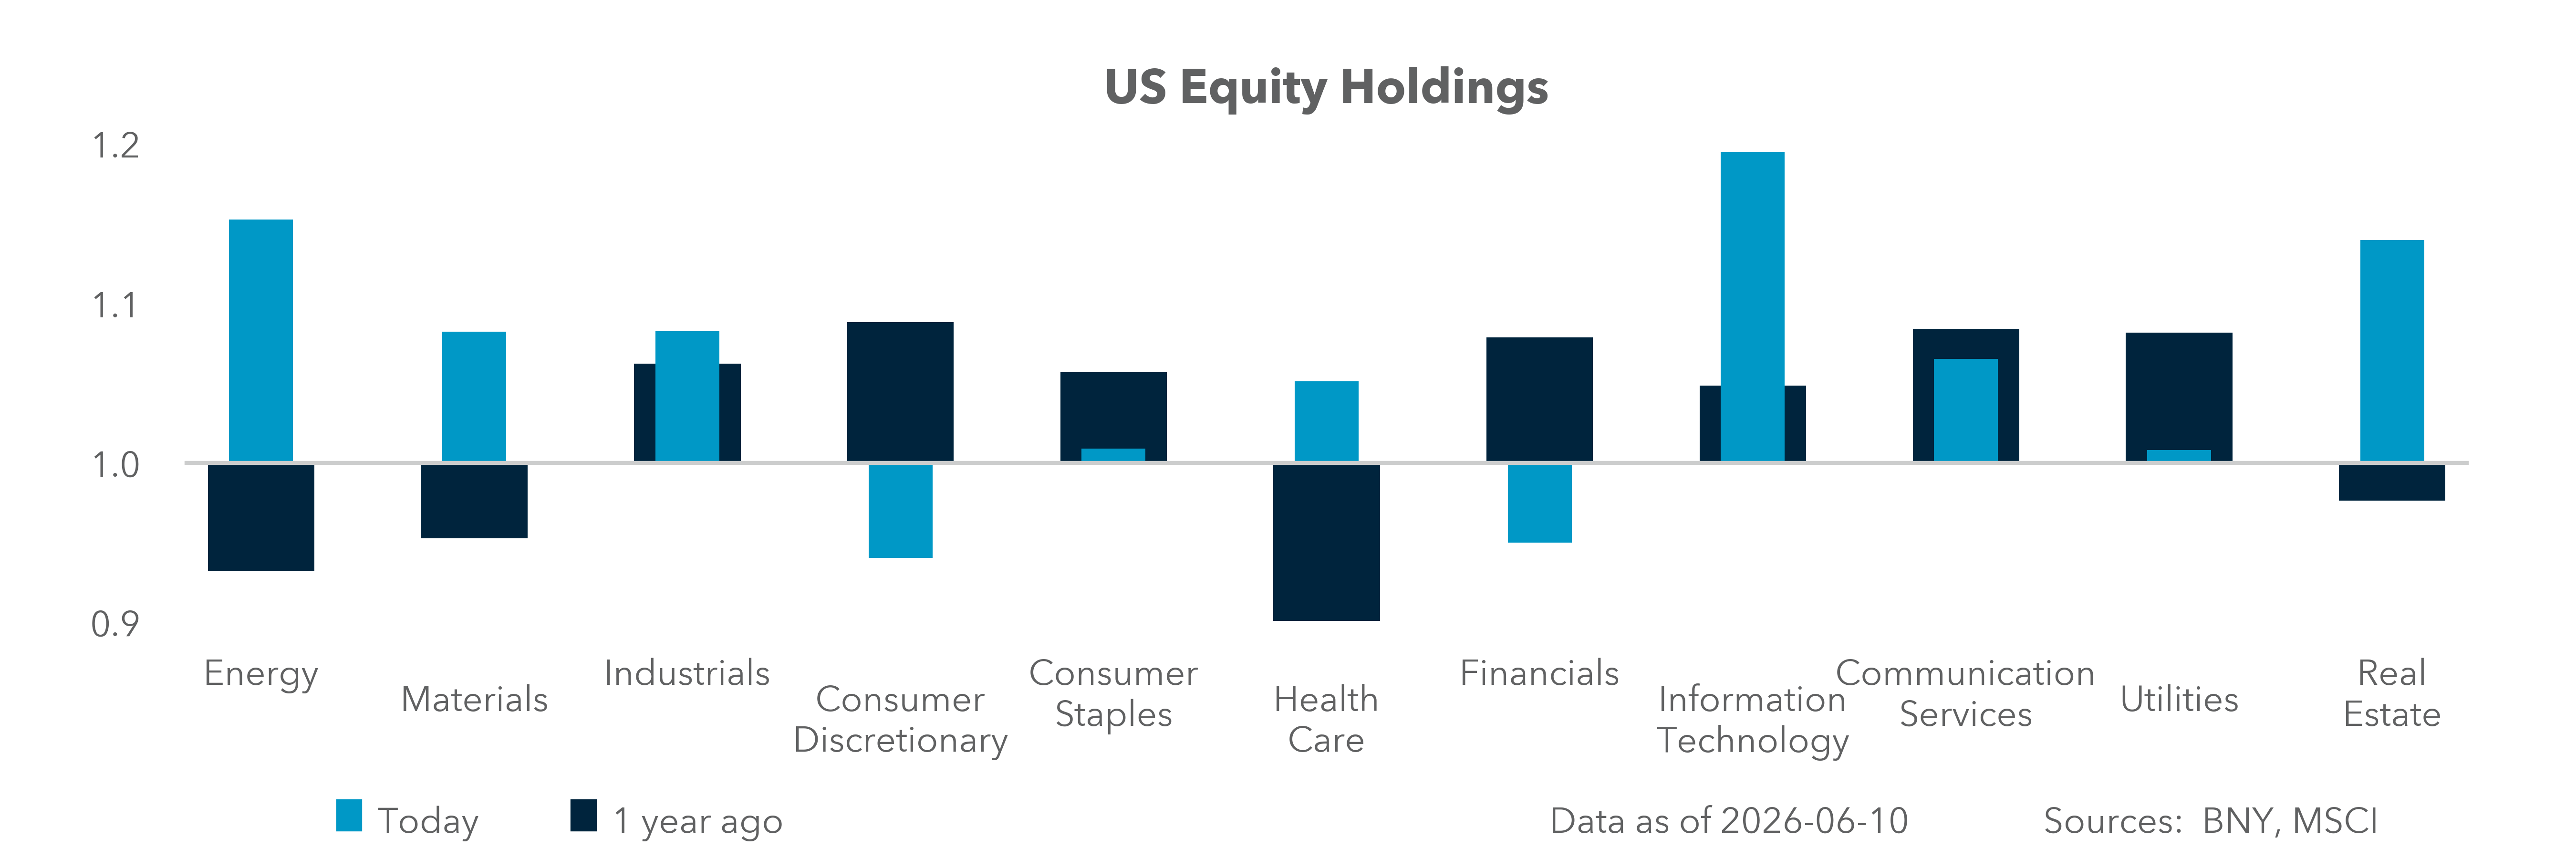
Mega-sized IPOs have not historically called a market top. In the last 50 years, 20% of big IPOs have preceded a market correction. The timing and cash coincide with, but don’t cause, market reversals. The shift to positive real rates over the past five years has also shaped the relationship between cash holdings, valuations, and equity markets. iFlow U.S. equity holdings are just 3% over the 10-year average, led by technology – though the rally has recently broadened into all sectors except financials and consumer discretionary.
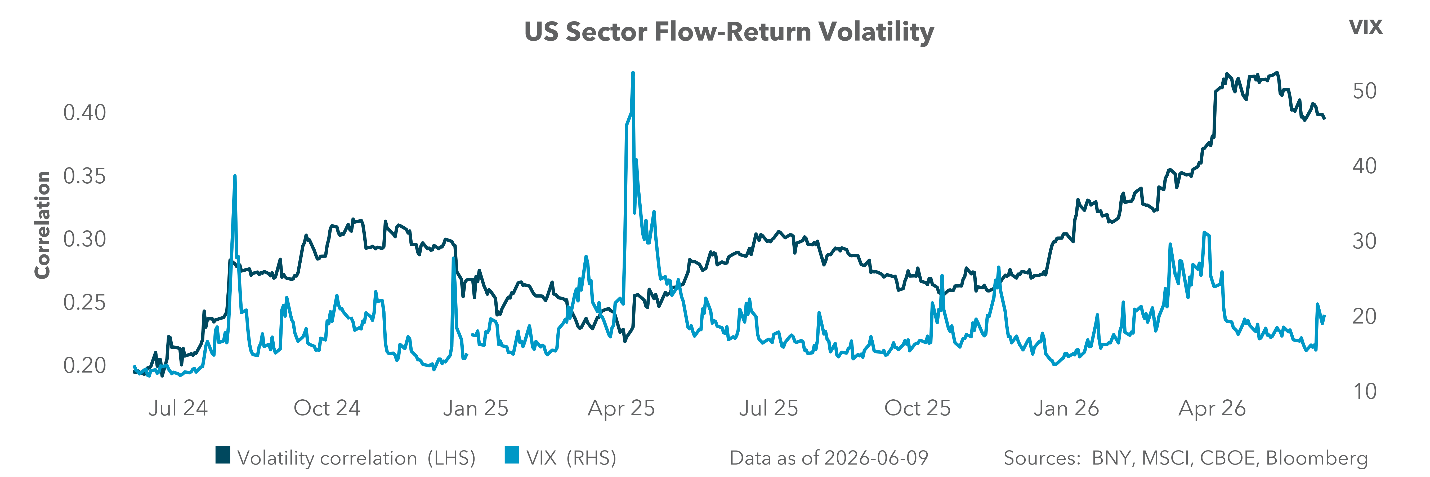
EXHIBIT #3: U.S. SECTOR FLOW CORRELATION VS. VIX
Source: BNY
Our take
We measure our U.S. equity flows by sector and their correlation to each other. The higher the correlation, the more investors are buying composite indices rather than individual shares. Some of this has become structural as passive investment strategies are now over 50% of all holdings. Nevertheless, the relationship between market momentum and volatility is notable and a warning signal for trouble into Q3. The key question for investors is whether it is a stock market or market of stocks. Investors will be watching how passive money absorbs new IPO supply against active managers making room for new market cap in the S&P 500.
Forward look
Rotation pressure on technology – driven by IPO supply and the shift from hyperscalers to AI users generating actual returns – will define the sector’s trajectory. Investors previously gained indirect exposure to SpaceX, OpenAI and Anthropic through hyperscaler holdings. Direct IPO buying may now draw capital away from that proxy trade. Many also expect LLM commoditization to compress hyperscalers’ margins over time. The implications are for more uncertainty until we have Q2 earnings and clarity on the new companies’ trajectories. Concerns about the revenue and cost of AI tokens continue to be in the spotlight as investors rethink value and rates.
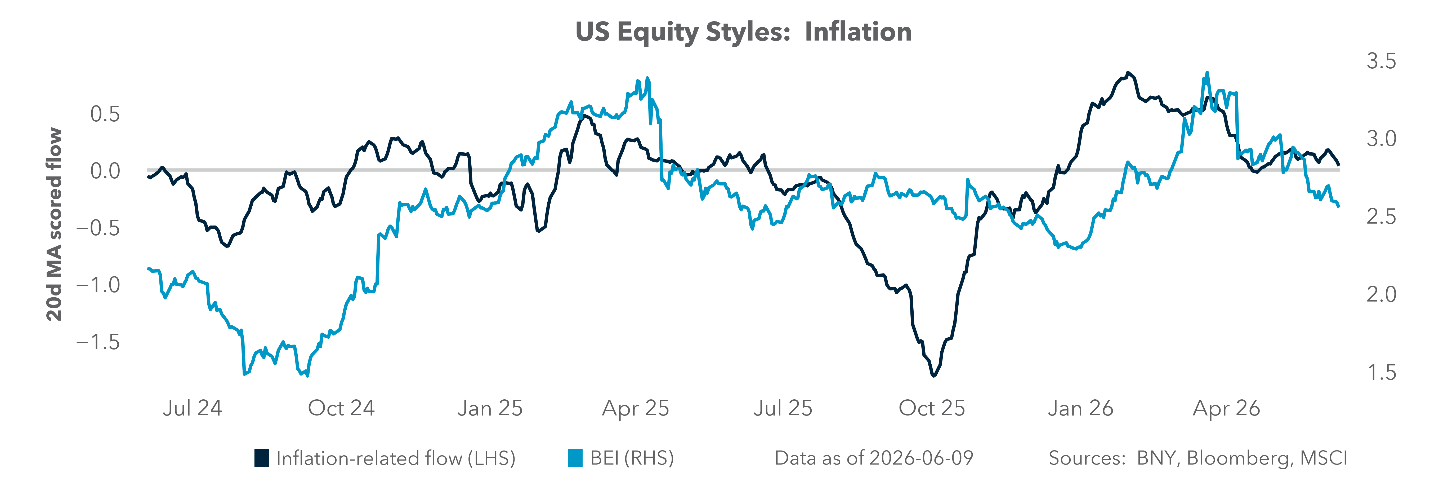
EXHIBIT #4: U.S. INFLATION BETA IN FLOWS VS. BREAKEVEN INFLATION SWAP
Source: BNY
Our take
Inflation hasn’t been a worry for U.S. equities. The rise in U.S. CPI to 4.2% y/y in May from 3.8% has been looked through. The decline in breakeven inflation swaps is a better indicator of how equity investors are pricing inflation risk. The spike in inflation concerns in January peaked and faded as the Fed signaled that its rate cutting plans shifted. Policy expectations, not inflation itself, are driving how equity investors trade inflation risk.
Forward look
We rank inflation beta in the U.S. stock market and track it through our flows, which suggests the recent volatility is more about growth, value, and rebalancing risks into quarter end. The sanguine view on inflation flies in the face of central bank actions this week and next. The potential for higher G7 rates and a shift in equity momentum seems underpriced, according to our flows.
As investors move through June and toward quarter end, the interaction between cash deployment, valuations, and policy expectations is becoming increasingly important for equity performance. While institutional cash holdings continue to decline – limiting the support for risk assets during significant market pullbacks – central banks are signaling a more cautious path that may gradually tighten global liquidity conditions. At the same time, elevated equity valuations and a growing IPO pipeline are testing investor willingness to add risk at current levels. Equity participation has broadened beyond technology, but leadership transitions often create periods of heightened volatility and sector rotation. Meanwhile, markets remain remarkably relaxed about inflation despite renewed rate increases from several central banks and the possibility of higher real rates across developed markets. Energy supply risks from the Iran conflict and a potential Strait of Hormuz closure add a further layer that flows have yet to price. With Q2 earnings, IPO performance and policy guidance converging, the signals from cash flows, valuation discipline, and inflation expectations will determine whether momentum survives into H2.