Material demand
iFlow > Equities
An in-depth look each Friday at the factors shaping equities markets in developed and emerging economies around the world.
iFlow > Equities
An in-depth look each Friday at the factors shaping equities markets in developed and emerging economies around the world.

Bob Savage
Time to Read: 4 minutes
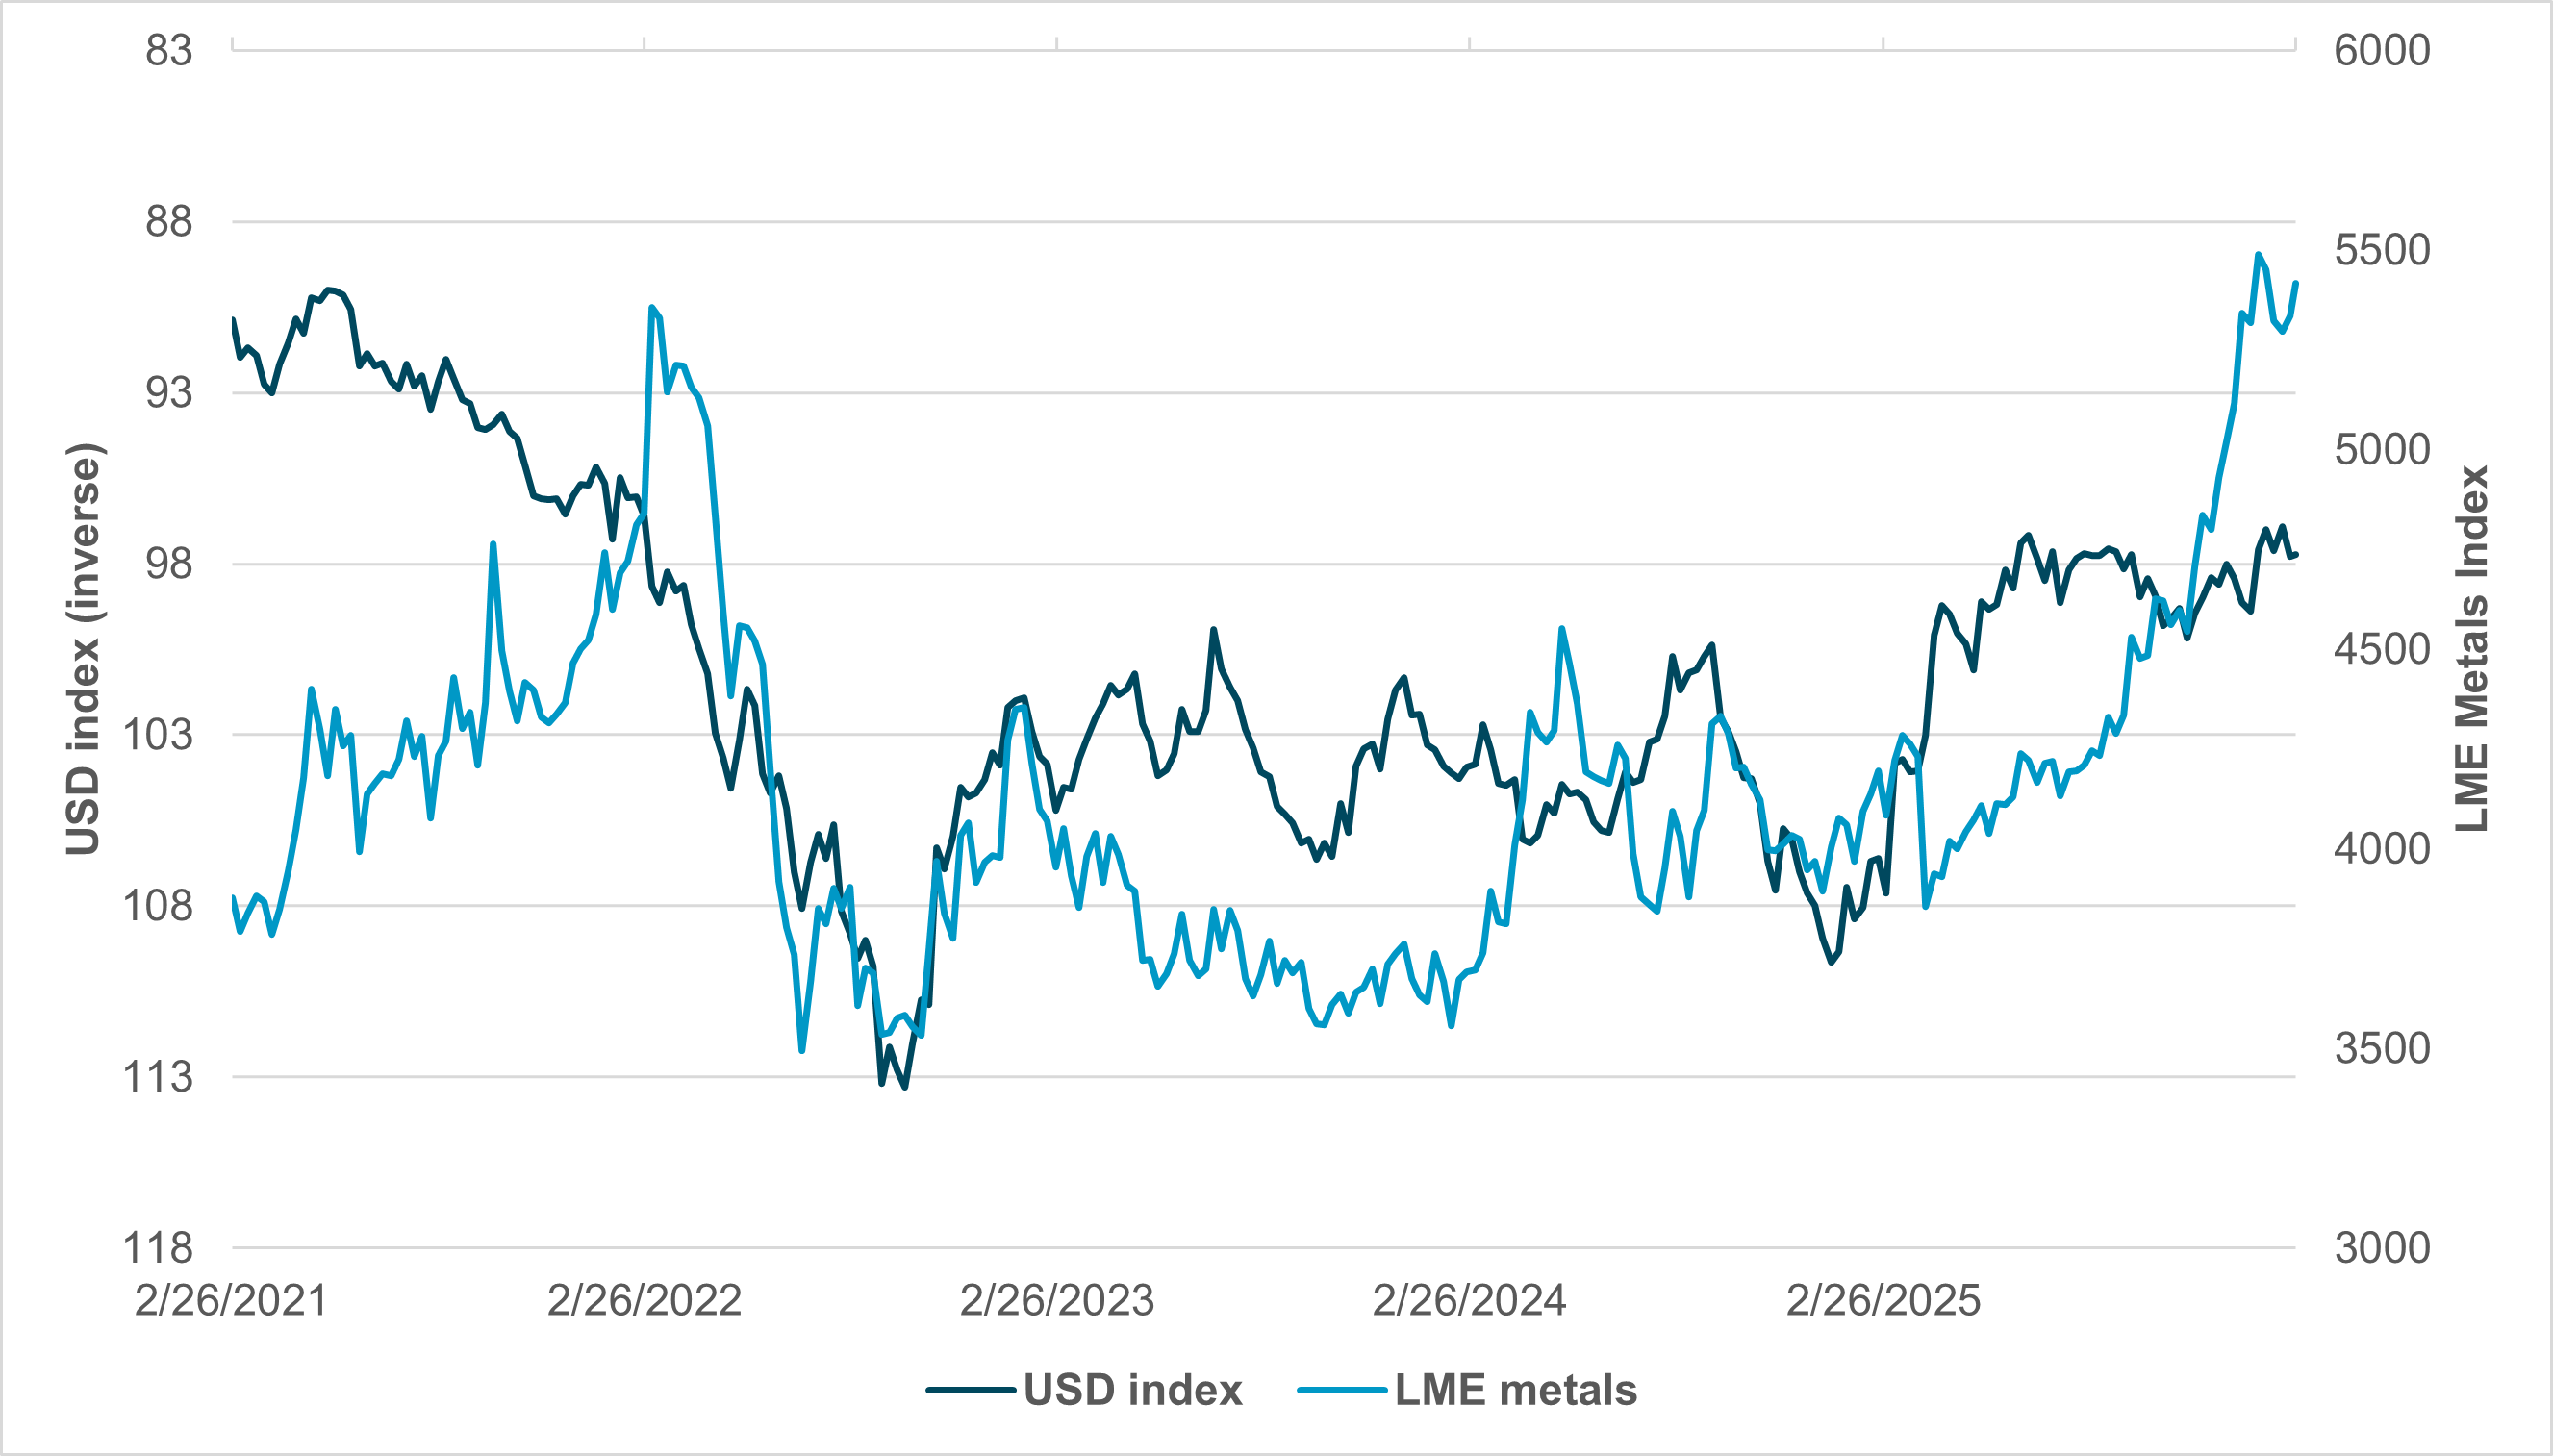
EXHIBIT #1: USD-METALS RELATIONSHIP DIVERGES
Source: BNY, Bloomberg, London Metal Exchange
Metals traded as a safe haven over the past 12 months and are now shifting toward an expansion trade as the 2026 global growth outlook improves and 2025 uncertainty fades. Gold and other metals rallied sharply from April 2025 but have seen significant pullbacks this year. Gold’s rally has been tied to dollar weakness and concerns over global debt sustainability.
More recently, it has joined the value shift from IT into the broader S&P 500. Precious and industrial metals remain closely correlated with developed market real-rates. However, fiat currency debasement fears matter less now. Investors have shifted their focus toward independence from global markets and growing scarcity concerns.
Geopolitical supply-chain risks and demand from semiconductors, energy and machinery are driving prices higher. Broader forces in global equities are balancing inflation against growth recovery. That dynamic favors industrial metals such as copper rather than holding gold or silver as FX alternatives. Debt and rate concerns persist as AI investment shifts from hyperscaler profits to increased borrowing. The clock started ticking in Q4 2025 on generating returns from LLM investments and proving sustainable business models.
The link back to rates is not lost on the materials sector as weaker growth could restart rate cuts and revive FX concerns. The sector retains a perceived win-win bias heading into the month ahead.
Our take
The negative correlation between the U.S. dollar and the LME Metals Index is long-standing and significant. What stands out is when that correlation breaks, as it has in 2026. The U.S. dollar has traded in a 95 to 99 range while metals prices have surged – a divergence not seen since COVID. The economic focus on supply concerns stands out in both cases. Scarcity and stockpiling now explain more of the price action than real-rate valuation dynamics.
Forward look
The USD index’s link to Fed policy also differs this cycle, with investors pricing fewer 2026 rate cuts. However, the dollar has not rallied back, suggesting that ongoing FX hedging demand still plays a significant role. FX risk reduction and supply-chain concerns suggest global investors fear broader financial instability more than a panic USD collapse.
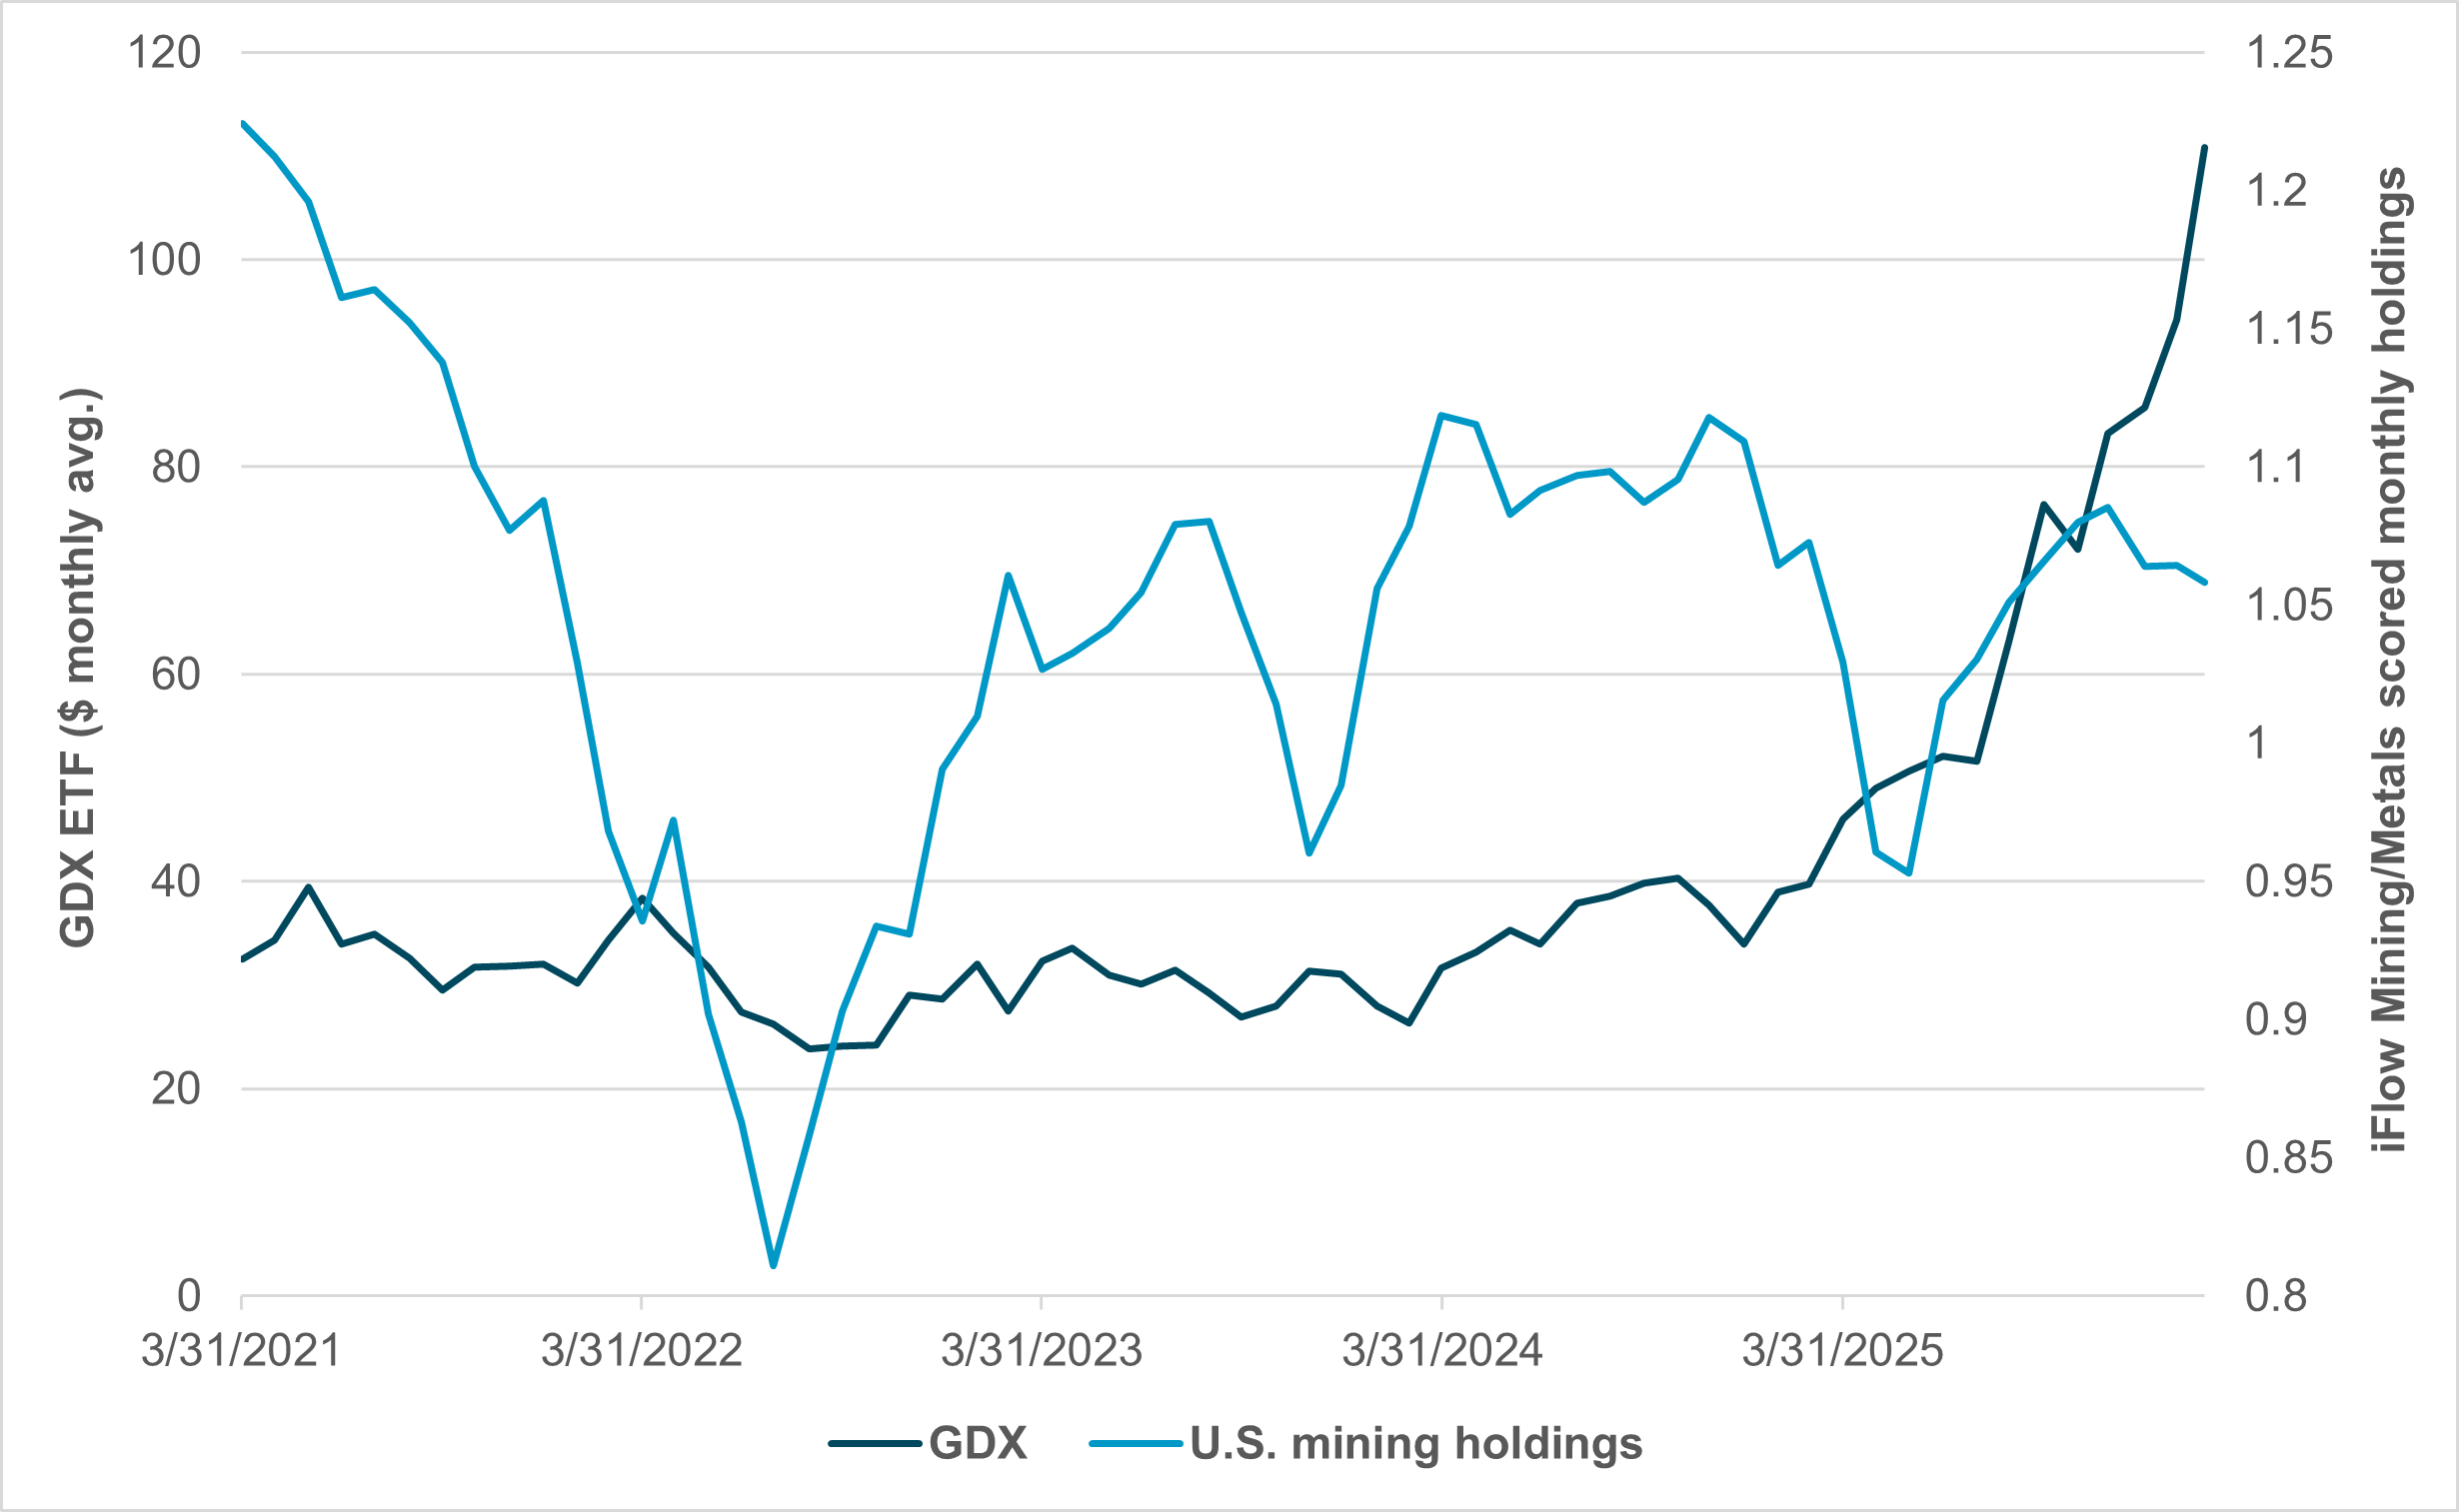
EXHIBIT #2: U.S. GOLD MINING ETF VS. IFLOW MINING HOLDINGS
Source: BNY, Bloomberg
Our take
iFlow data on mining and metals holdings show U.S. holdings have stalled this year, reflecting the unwind of February’s silver bubble. This may also reflect the uneven industrial recovery and tariffs weighing on materials demand. GDX (Gold Mining ETF) reflects broader market positioning for USD weakness. That differs from our client positioning, but the speculative flow still matters in March.
Forward look
The USD’s role in metals should not be forgotten. The cost of industrial metals continues to draw on gold and silver’s valuation as dollar alternatives. Flows into mining companies were notable during the USD weakness trend in 2025 but stalled in October and remain in play. Hedging remains critical, as U.S. managers buying materials shares abroad may hedge differently than foreign investors buying into the U.S.
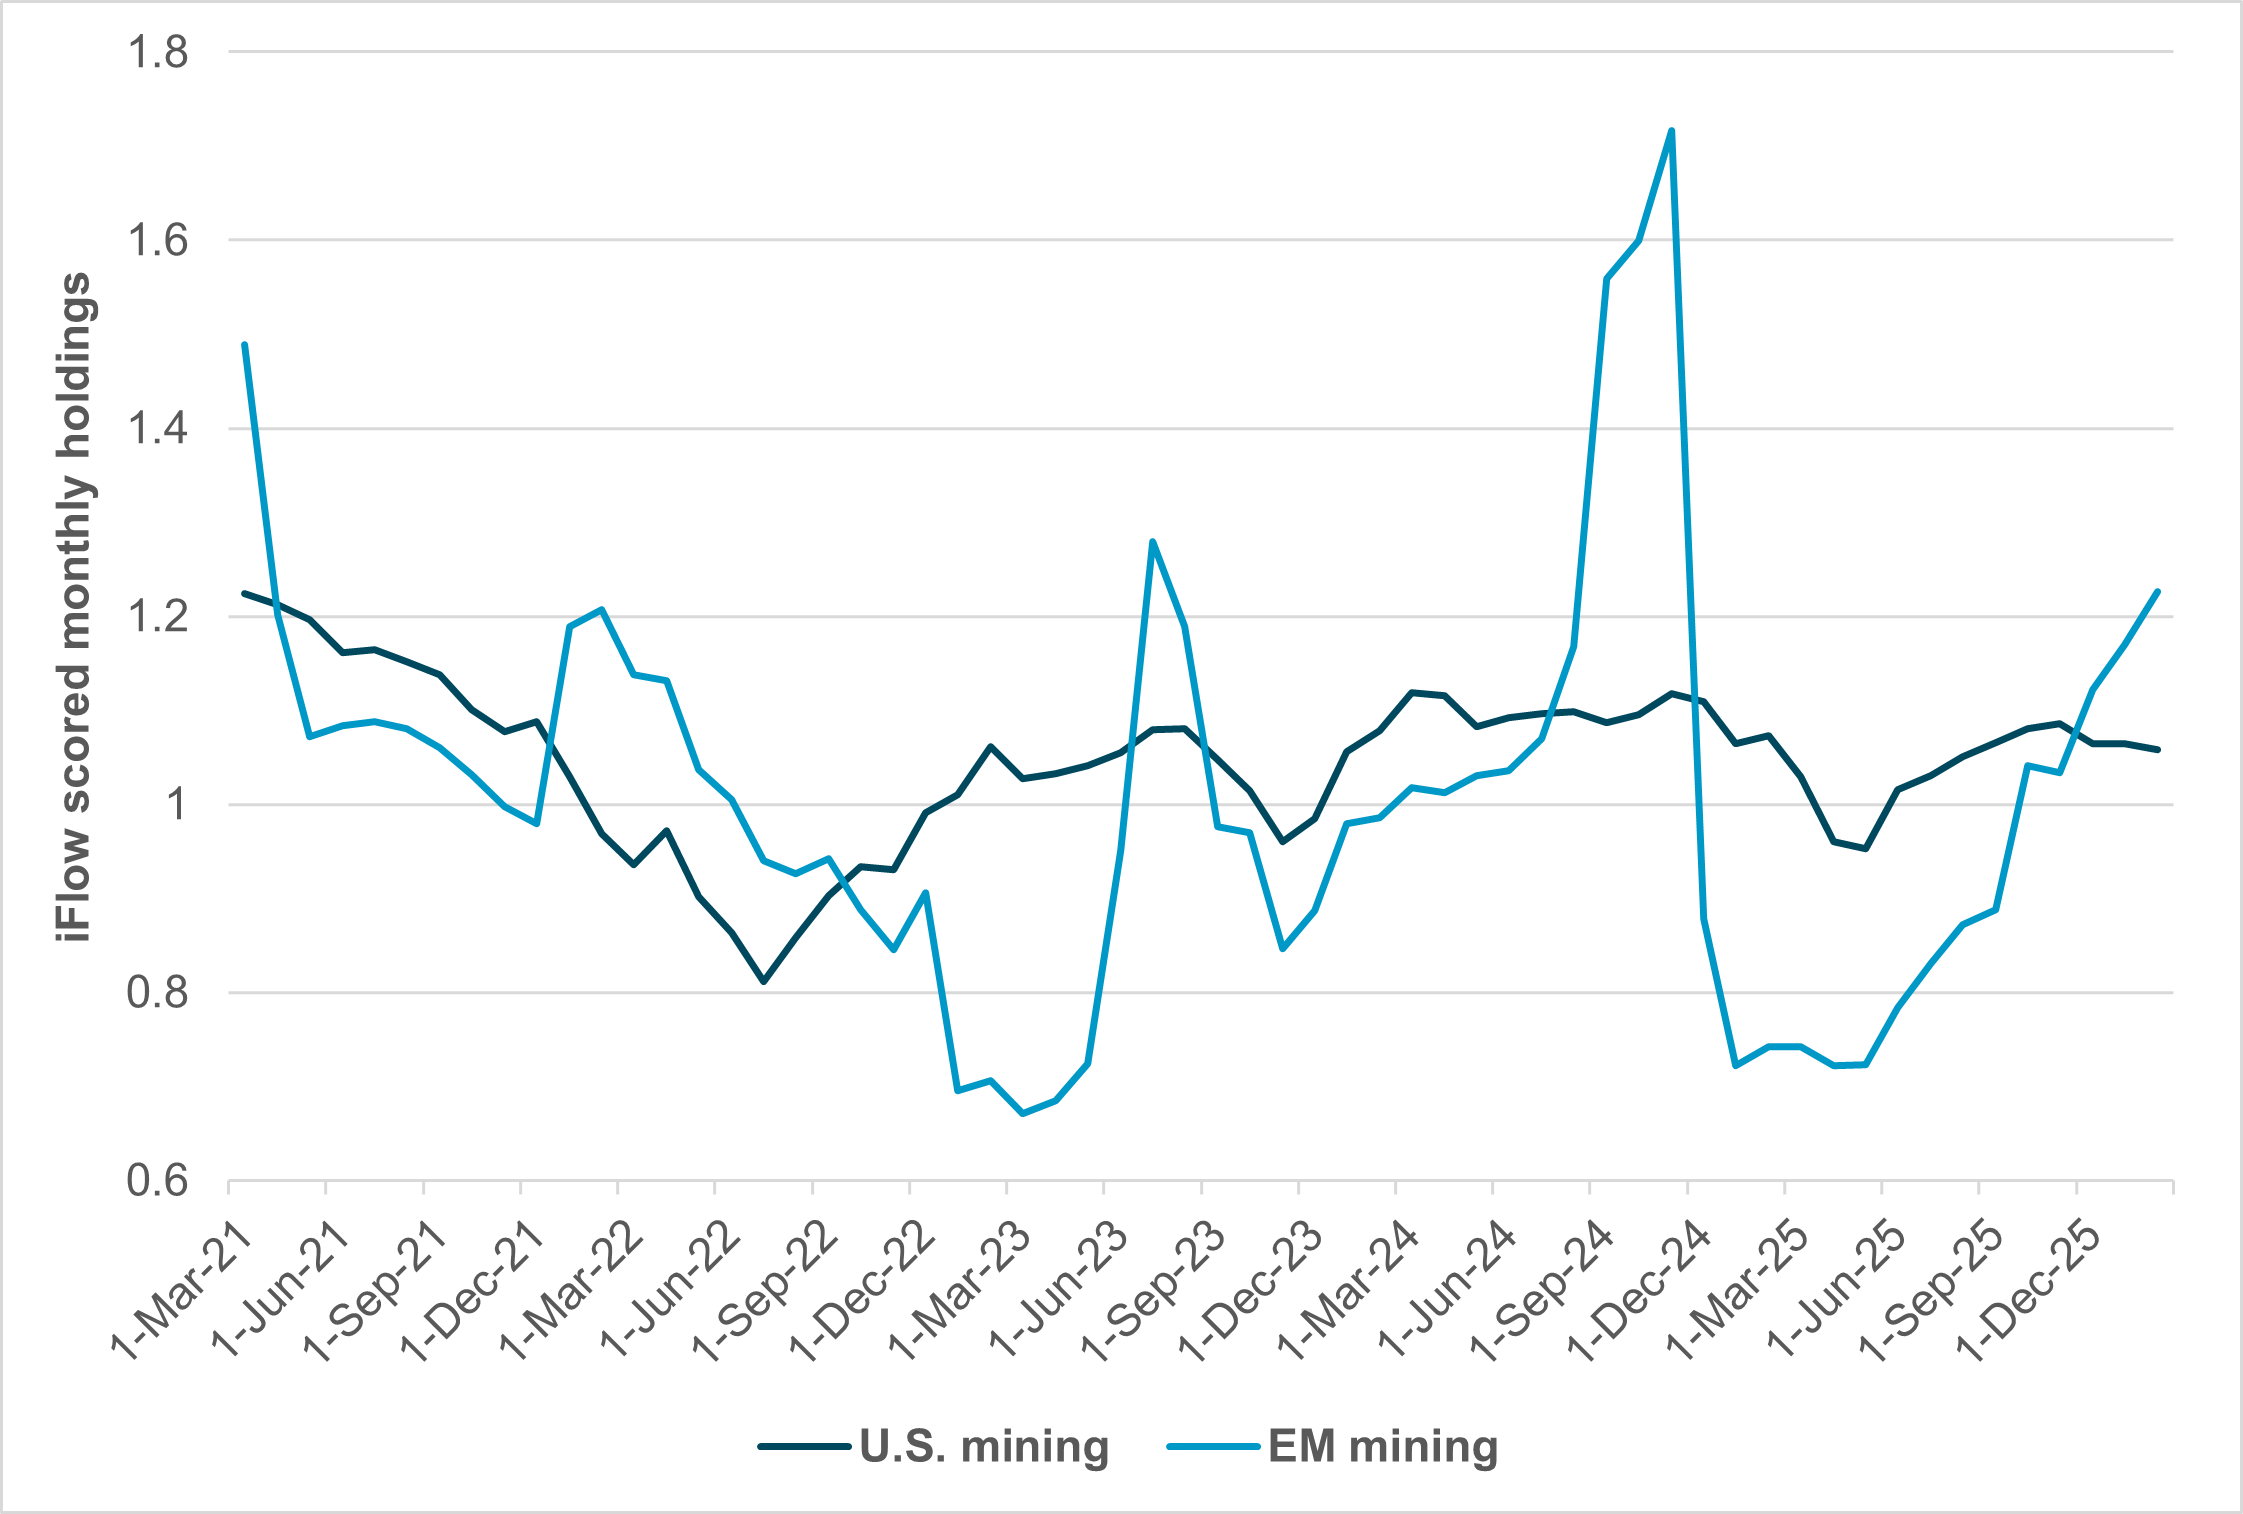
EXHIBIT #3: MINING AND METALS HOLDINGS IN U.S. AND EM MARKETS
Source: BNY
Our take
Emerging market (EM) stocks surprised many investors in 2025 with a 33% return. Materials, specifically Metals and Mining (GICS Level 3), played a significant role, though downside risks from U.S. tariffs remain. The industry’s recovery since April continues into 2026.
There is a clear contrast between EM metals holdings and the U.S., where positions have remained contained since COVID and the start of the Fed’s rate-hiking cycle. U.S. rates divide market logic between holding real assets amid G10 currency doubts and owning metals for global growth and supply-chain security.
Forward look
The risk for the next quarter rests on positioning. EM flows have split between semiconductor-linked IT in South Korea and Taiwan and broader tech sector value plays in China and India. At the same time, current EM materials holdings are outsized relative to the index. That positioning has pushed Brazil and broader LatAm equity risk to multiyear highs. EEM (Emerging Markets ETF) performance reflects a steady rise in materials exposure from the 1.5% target, with current EM materials holdings at 7.5%.
This leaves room for a pullback should there be global demand shocks. Risks from geopolitical events run both ways, with conflict resolutions likely to increase supplies and alleviate pricing concerns.
Metals sit at the intersection of growth recovery, supply-chain resilience and currency positioning. The traditional real-rate and dollar framework remains relevant, but the 2026 divergence between a range-bound USD and rising metals prices points to structural demand and scarcity dynamics becoming more dominant. For equity investors, this broadens the opportunity set beyond gold as a defensive hedge toward copper, diversified miners and select EM materials exposures tied to industrial recovery and energy-transition capex.
However, positioning risk, particularly in EM materials, warrants close monitoring, especially if global demand softens or geopolitical tensions ease and supply normalizes. Fed policy expectations and FX hedging flows will continue to influence sector performance, particularly for U.S.-based investors allocating abroad. In this environment, disciplined exposure to high-quality balance sheets, cost-efficient producers and companies with pricing power should outperform.
Metals are no longer purely defensive but increasingly a barometer of global capital expenditure, policy credibility and supply security.