Energy and the safe-haven test
iFlow > Equities
An in-depth look each Friday at the factors shaping equities markets in developed and emerging economies around the world.
iFlow > Equities
An in-depth look each Friday at the factors shaping equities markets in developed and emerging economies around the world.

Bob Savage
Time to Read: 4 minutes
The fog of the conflict in the Middle East has left investors chasing nonlinear headlines for clarity about growth, inflation and policy. All hope to see around current geopolitical risks while tactically reducing exposure. The risk of an oil supply shock appears underpriced even as prediction markets assign 50% to 80% odds of oil reaching $100/bbl. Stabilizing the situation and restarting shipping remain essential to current market resilience.
Even so, the analyst community has lowered EPS estimates for Q1 for the first time since Q2 2025. Q1 EPS is down 1.5% to $70.50, according to FactSet. Eight sectors show weakening outlooks, led by Health Care and Energy, while two sectors improving are IT and Communications. What stands out is the price action versus actual market positioning. The rush to own oil has been notable, making it one of the clearest new safe havens. Oil was in demand before and after the war. Global consumer outlooks are sanguine despite inflation fears from higher energy costs. The U.S. has benefited from its shift to becoming the largest oil producer and exporter. However, the key risks in the S&P 500 remain wrapped in technology, AI and credit, with 44% of the index linked to those themes.
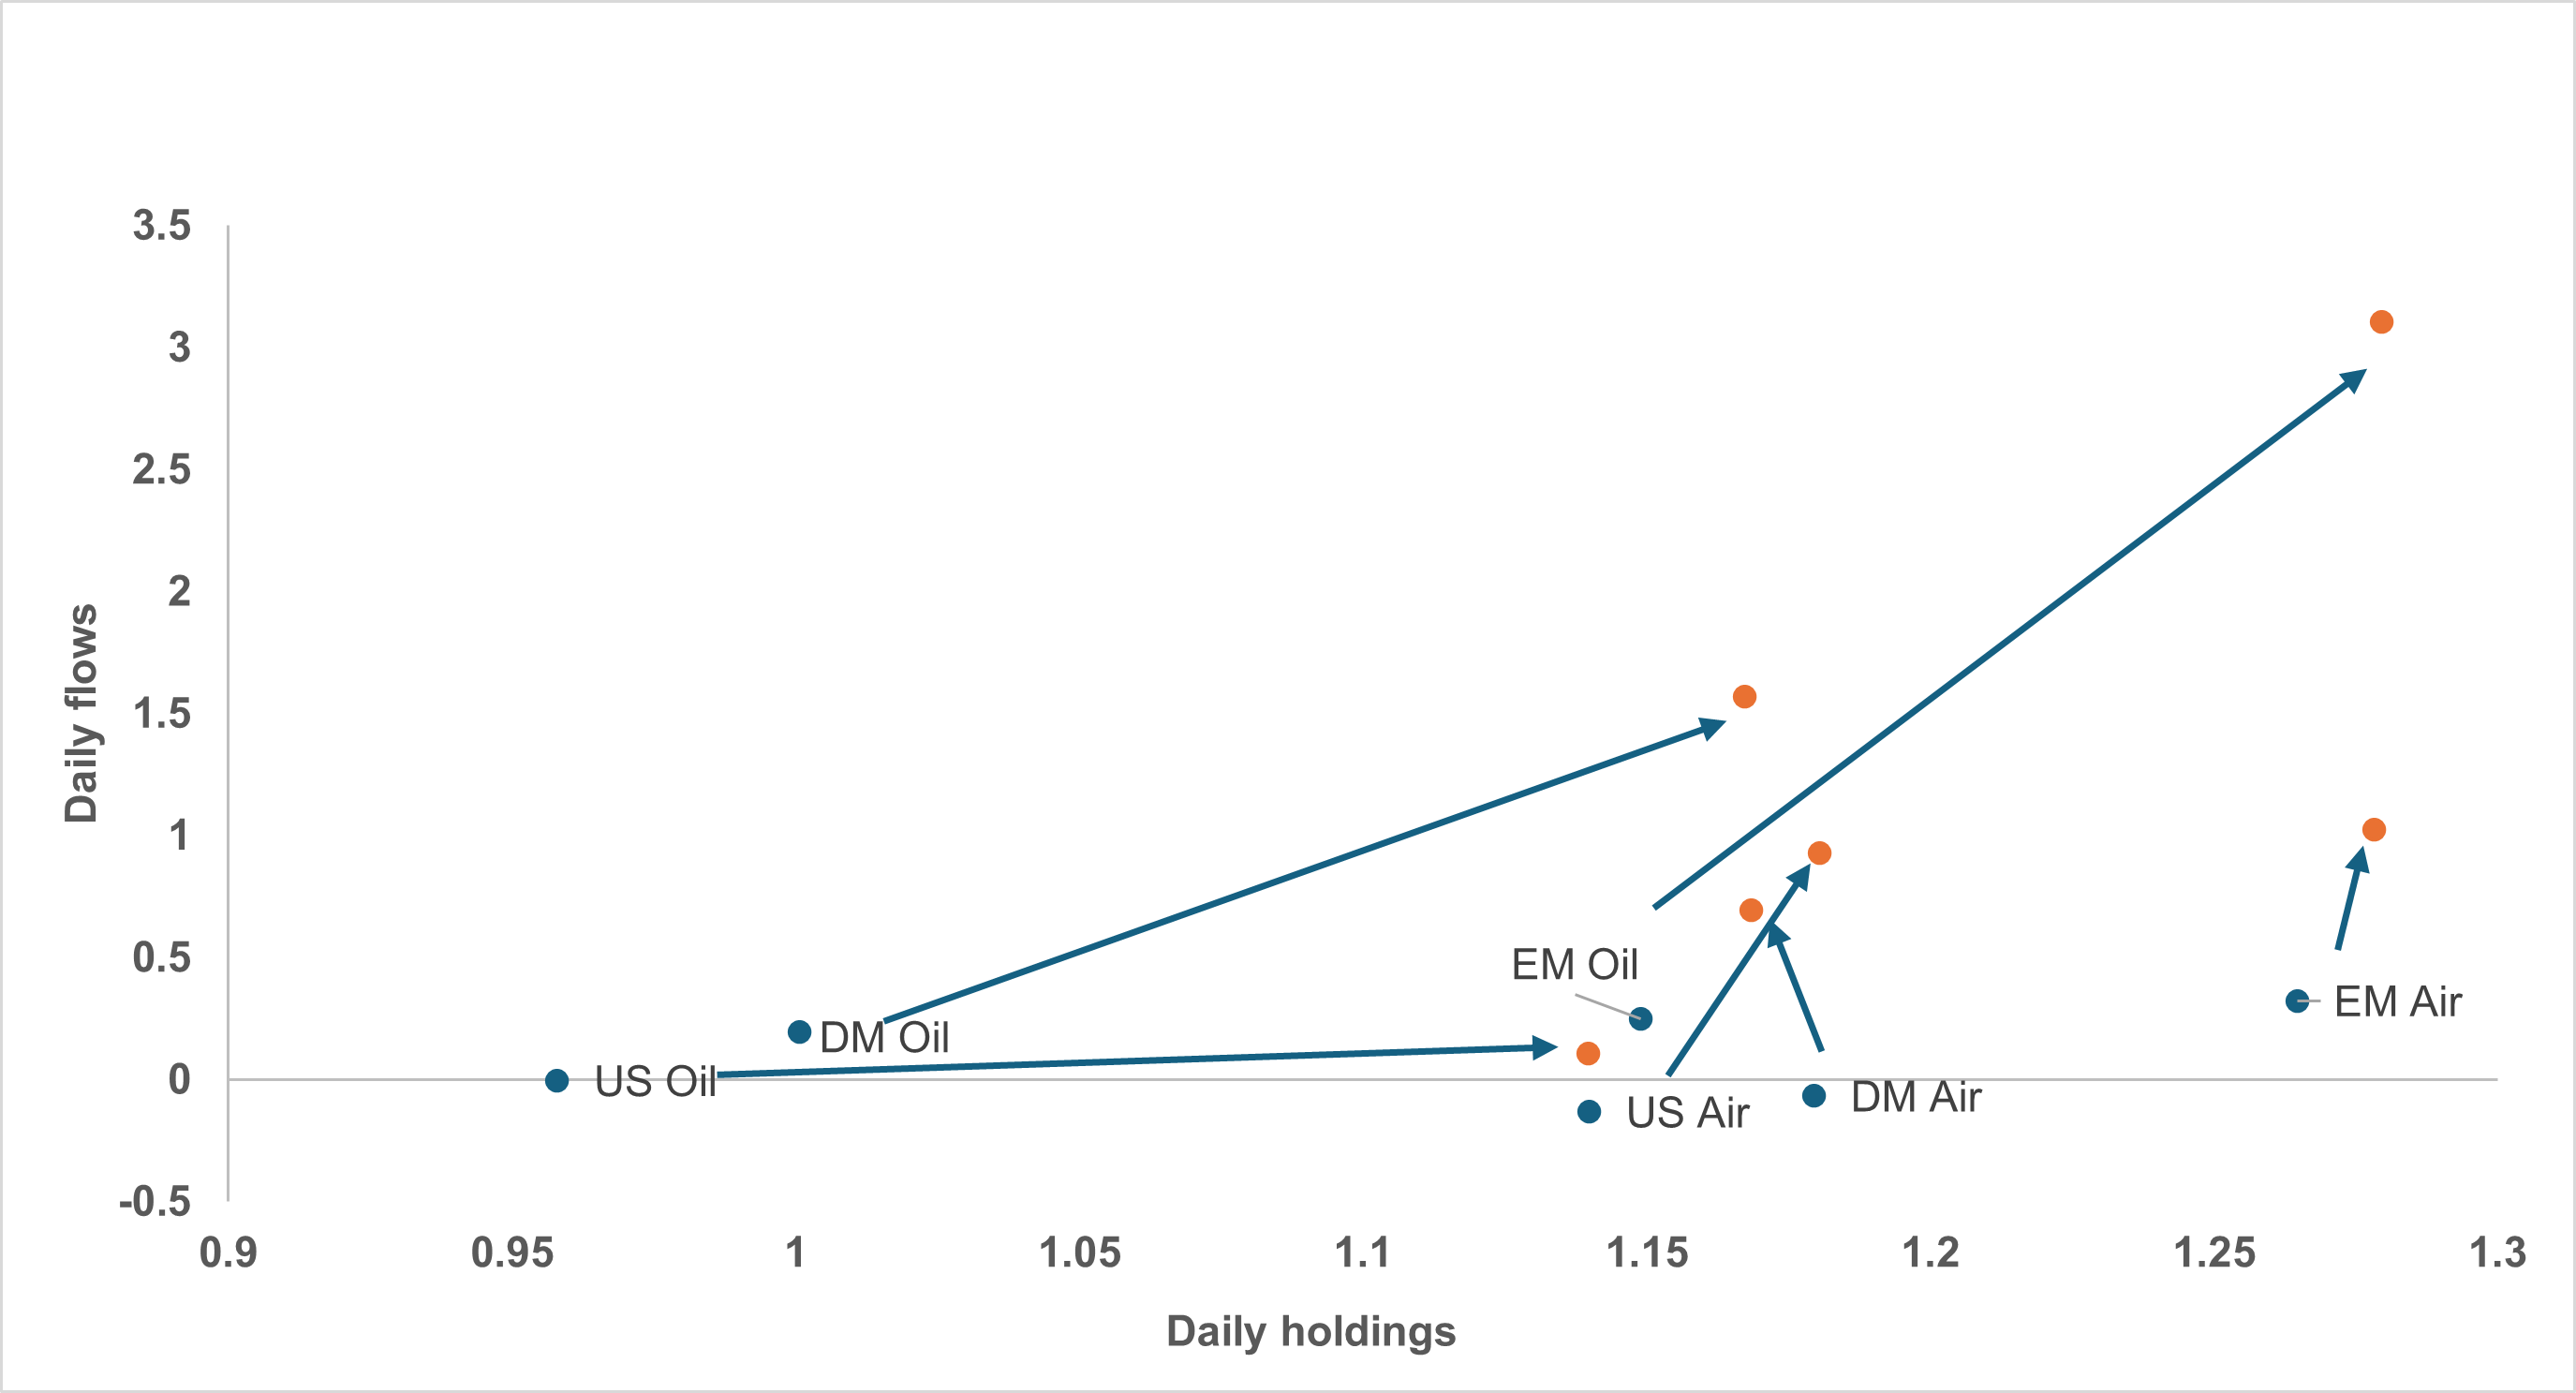
EXHIBIT #1: U.S., EM AND DM AIRLINE AND ENERGY STOCKS, JANUARY 2 TO MARCH 3
Source: BNY
Our take
Expectations that emerging markets (EM) growth would beat developed markets (DM) in 2026 showed up in airline holdings early in the year. Since then, dislocations from the Iran conflict have been modest, and only DM airline holdings have declined on the year. The rush to oil has been more dramatic, with holdings jumping 20% in the U.S., 15% in DM, and 10% in EM.
Forward look
Investors’ ability to look through the current crisis and see value in energy will depend on the balance between inflation and demand destruction. Much of the current reaction in markets has been resilient because the consensus is for the conflict to end quickly, within two to four weeks. Energy is viewed as a win-win investment, given the supply shock and the structural uptick in capex linking materials and industrials, particularly defense and data centers. The USD has rallied notably, with oil tied both to energy production and to its role as a safe haven.
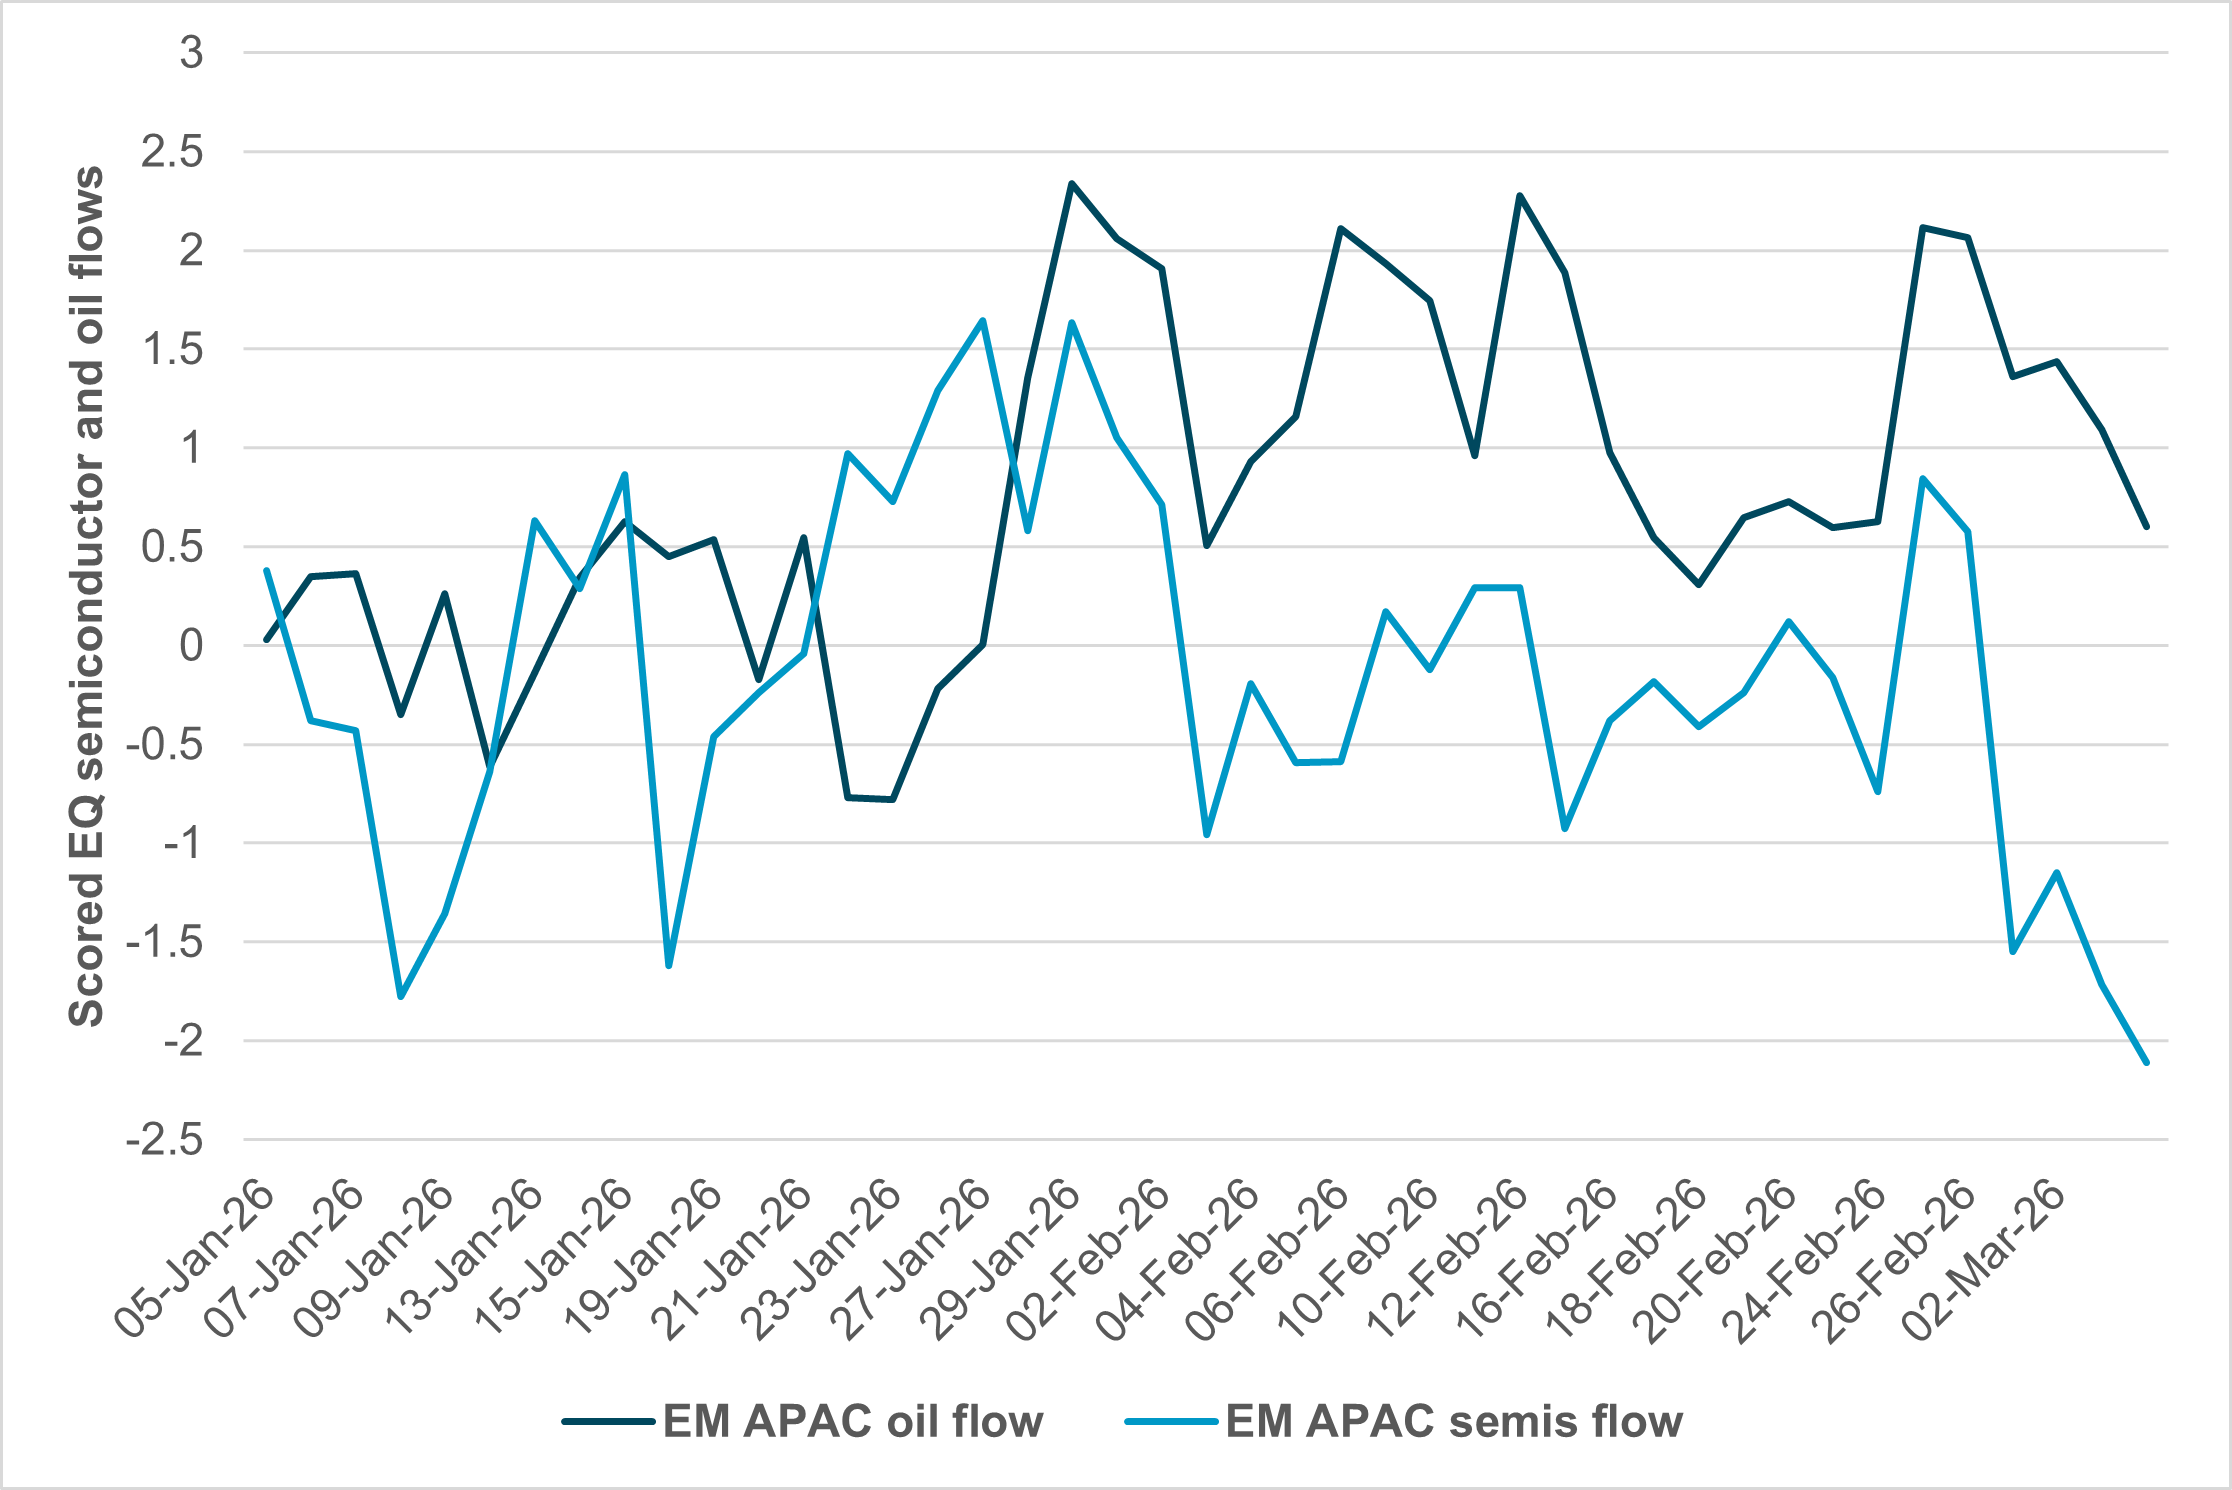
EXHIBIT #2: EM APAC SEMICONDUCTOR VS. OIL FLOWS
Source: BNY
Our take
The APAC equity washout this past week was historic. Moves in the KOSPI reflect energy fears, supply-chain disruption, related inflation and credit concerns. The region’s dependence on Middle East energy supply – especially for China, South Korea, Japan and Taiwan – stands out. Flows since the conflict show a dramatic selloff in semiconductor stocks, but not enough to explain the broader risk reduction across the region. Oil and gas holdings suggest this was not the safe-haven hedge seen in other EM regions. Some of this reflects the refining-versus-production split in regional stocks. Note that China ordered its refiners to stop diesel and gasoline exports. The conflict has also shifted expectations for APAC demand and growth, along with FX levels, monetary policy and fiscal plans. There is also a credit component to the price action, since semiconductor holdings were closely tied to data-center demand in both the U.S. and the Middle East.
Forward look
The key concern for EM APAC shares is a reversal of the rotation tied to growth and value outlooks after this week’s headlines. The length and severity of the conflict remain unknown, and that uncertainty leaves the region vulnerable to repricing. Key trading risks into the rest of the quarter revolve around positioning, with the Nikkei, KOSPI, and other APAC bourses outperforming the Nasdaq 100. Energy and FX moves over the past week may put a relative value floor under rotation out of U.S. tech and into the rest of the world.
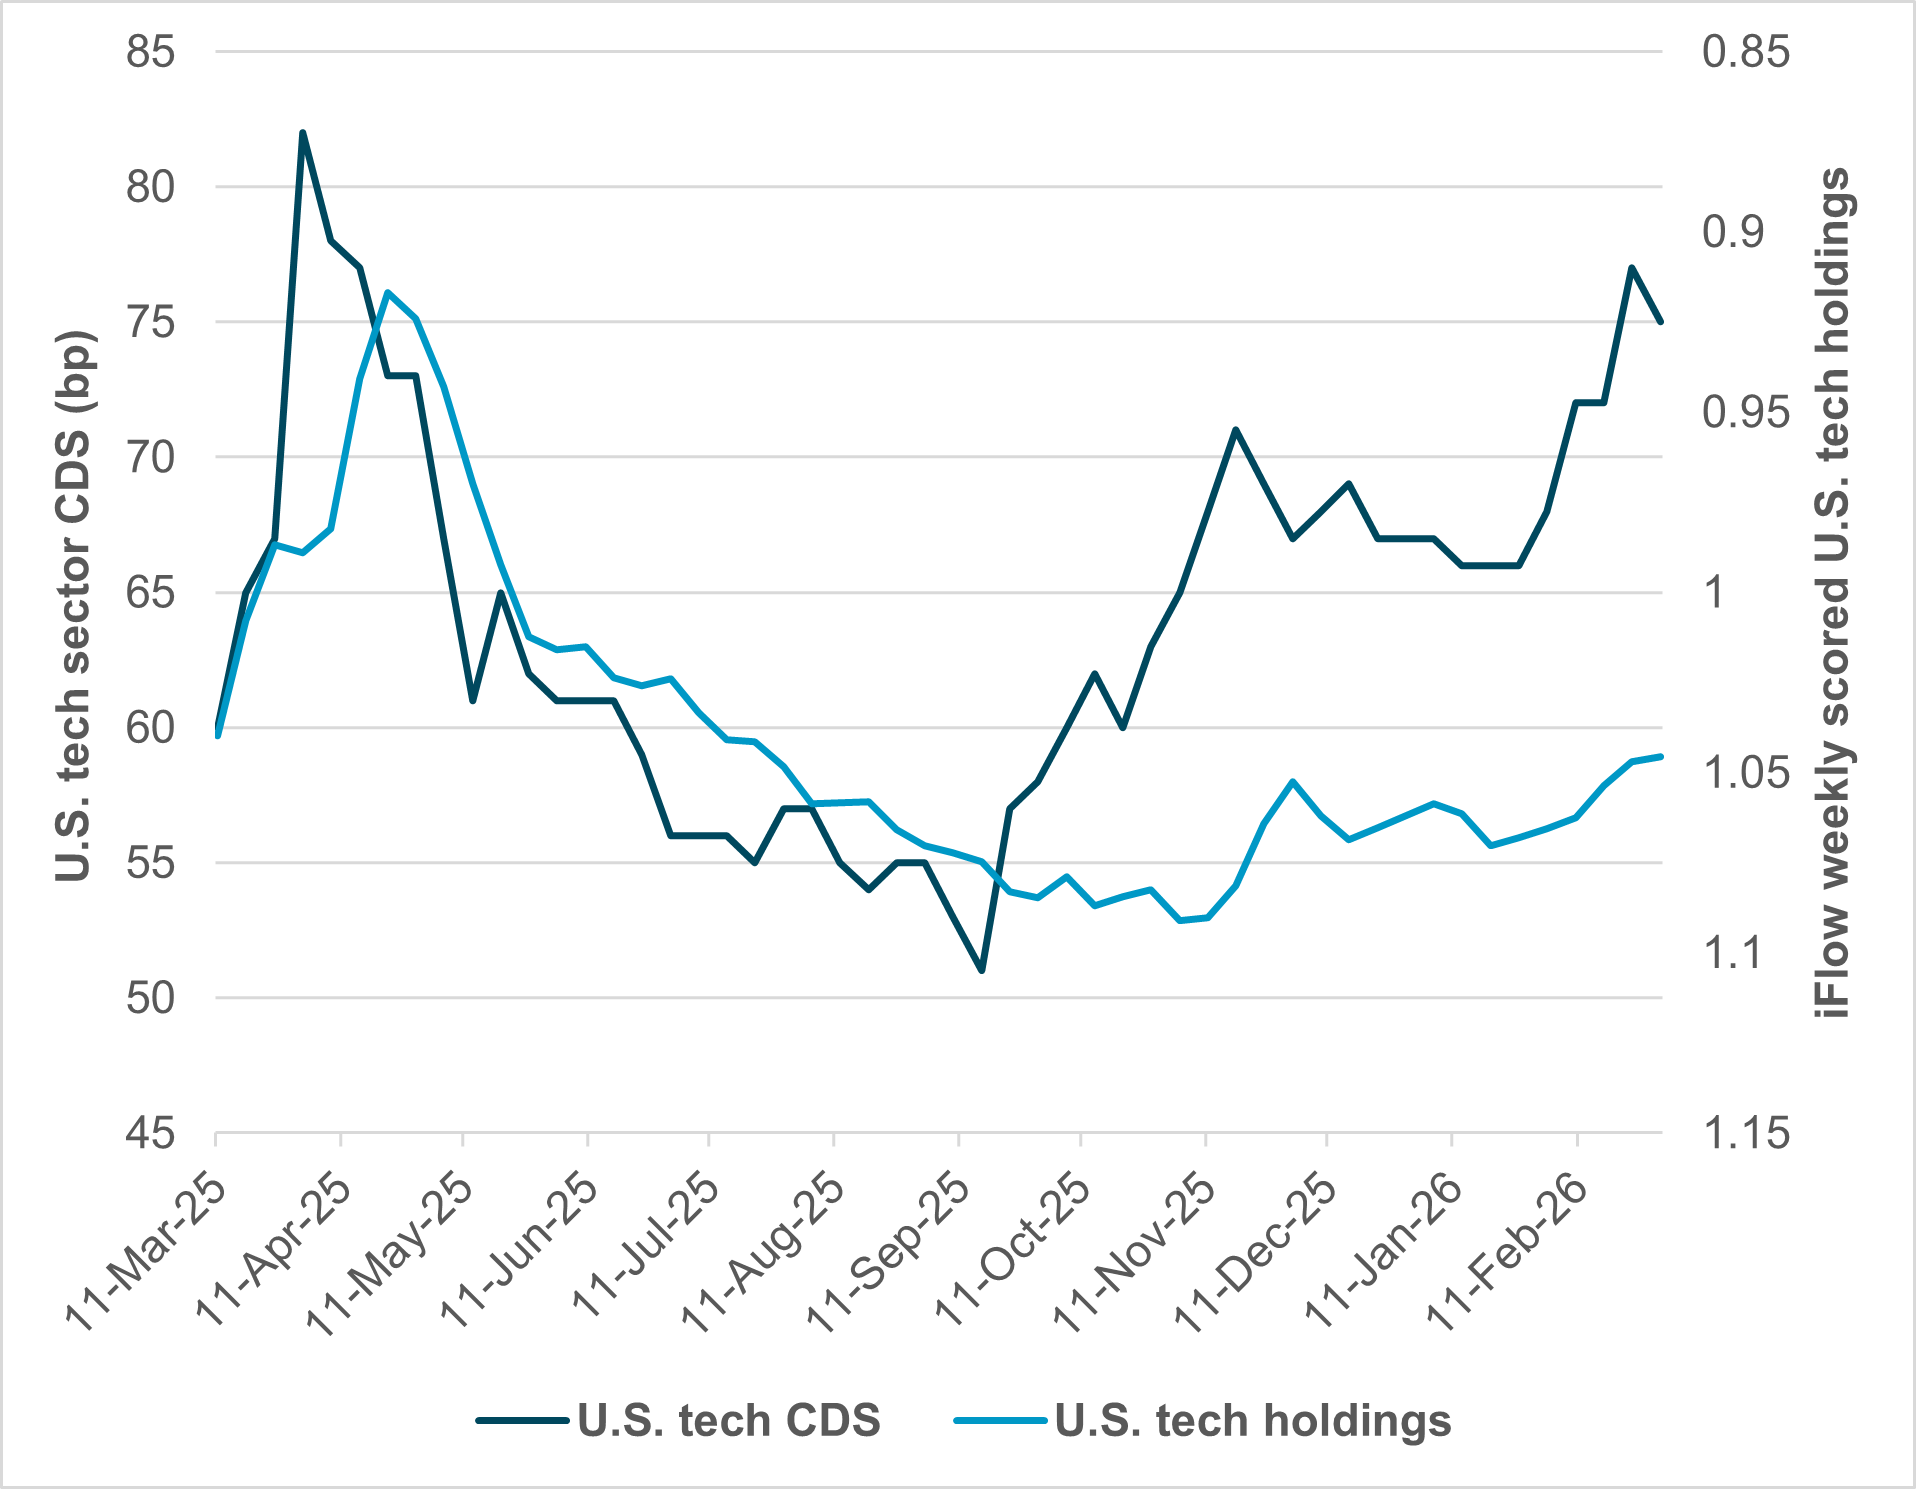
EXHIBIT #3: U.S. TECH HOLDINGS VS. CDS
Source: BNY, Bloomberg
Our take
Tech holdings matched the CDS market until Q4 2025. This was the break point, as large-cap tech firms began borrowing more to fund AI investment. The CDS market for tech has diverged sharply from client holdings, suggesting investors could sell the sector further if earnings or outlooks change. The relationship between U.S. and EM tech is also in play, with valuation and long-term growth as key variables.
Forward look
Investors face more than geopolitical risk, especially the risk of underestimating how long hostilities last. The knock-on effect of uncertainty on volatility and funding costs lifts rates and raises the risk of a larger revaluation in tech growth and investment flows. The surprise over the past week has been the ongoing positive correlation between stocks and bonds, as equity resilience has kept inflation worries higher than concerns about consumer demand. Higher gasoline prices may be more important in shifting the outlook for the conflict than the cost of natural gas.
Looking ahead, markets remain priced for a short-lived conflict and contained macro spillovers. That assumption underpins equity resilience, AI-linked holdings, and the bid for energy as both a hedge and a growth proxy. The central question is whether oil acts primarily as a safe haven or ultimately as a consumer tax that erodes demand.
If crude sustains levels closer to $100/bbl, as it did at the start of the Ukraine-Russia war, inflation expectations may firm, reinforcing higher-for-longer rate dynamics and pressuring duration-sensitive growth equities, particularly given that 44% of the S&P 500 is tied to tech, AI and credit-linked themes. At the same time, structural capex cycles in energy, defense and data infrastructure provide an offset, linking materials and industrials to the same geopolitical impulse driving oil. In EM APAC, positioning and FX sensitivity leave markets vulnerable to further repricing if supply-chain stress or credit tightening intensifies. The next inflection point will hinge less on headlines and more on duration: how long energy flows remain impaired, how quickly shipping stabilizes, and whether consumer resilience can withstand higher gasoline prices without tipping into demand destruction.