Record ETF and SMA Sales as Active ETFs and Custom Index Shine
U.S. Distribution Pulse Quarterly | 1Q 2025
U.S. Distribution Pulse Quarterly | 1Q 2025

Scott Anderson
Time to Read: 3 minutes
Year-end data confirms explosive growth in active ETFs — with net sales almost equal to the previous three years combined. SMAs also prospered, seeing more net sales in 2024 than the previous two years combined. While active ETF demand remains concentrated, the data points to new opportunities in the space, particularly with registered investment advisors (RIAs).
Custom index drove United States equity SMA sales across 2024, accounting for 25% of wirehouse SMA net sales ($22 billion). Taxable fixed income also performed robustly, with strong sales across all three wrappers.
Record ETF inflows for 2024 were the highest since 2021 at $113 billion. Active ETFs accounted for 22% of 2024 ETF net sales while making up only 6% of ETF assets under management (AUM) at year-end. Net sales of active ETFs also outstripped the previous two and a half years combined. SMAs experienced a similar acceleration in growth with net sales amounting to $86 billion, which is greater than the last two years combined.
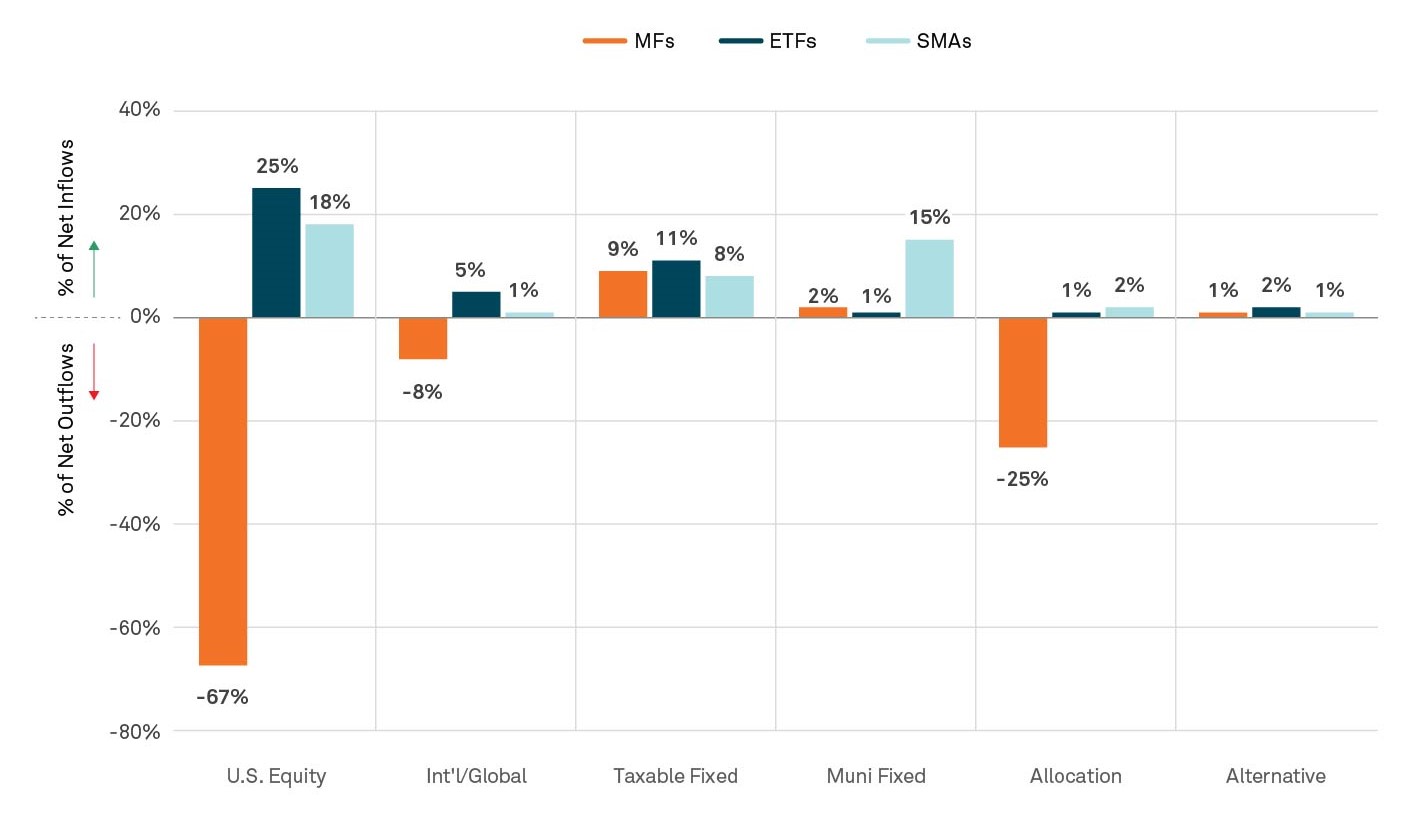
Much like in 2023, ETFs and SMAs each took share from mutual funds across wirehouse programs in 2024. Outflows from mutual funds slowed significantly year-on-year, however — to $16 billion compared with $50 billion the previous year. The few bright spots for mutual funds were around taxable fixed income and small-cap equity funds.
Figure 1: % of Fee Based Netflows by Asset Class - 2024 Wirehouse channel ($151B)
Source: BNY Growth Dynamics. Trend data as of December 31, 2024.
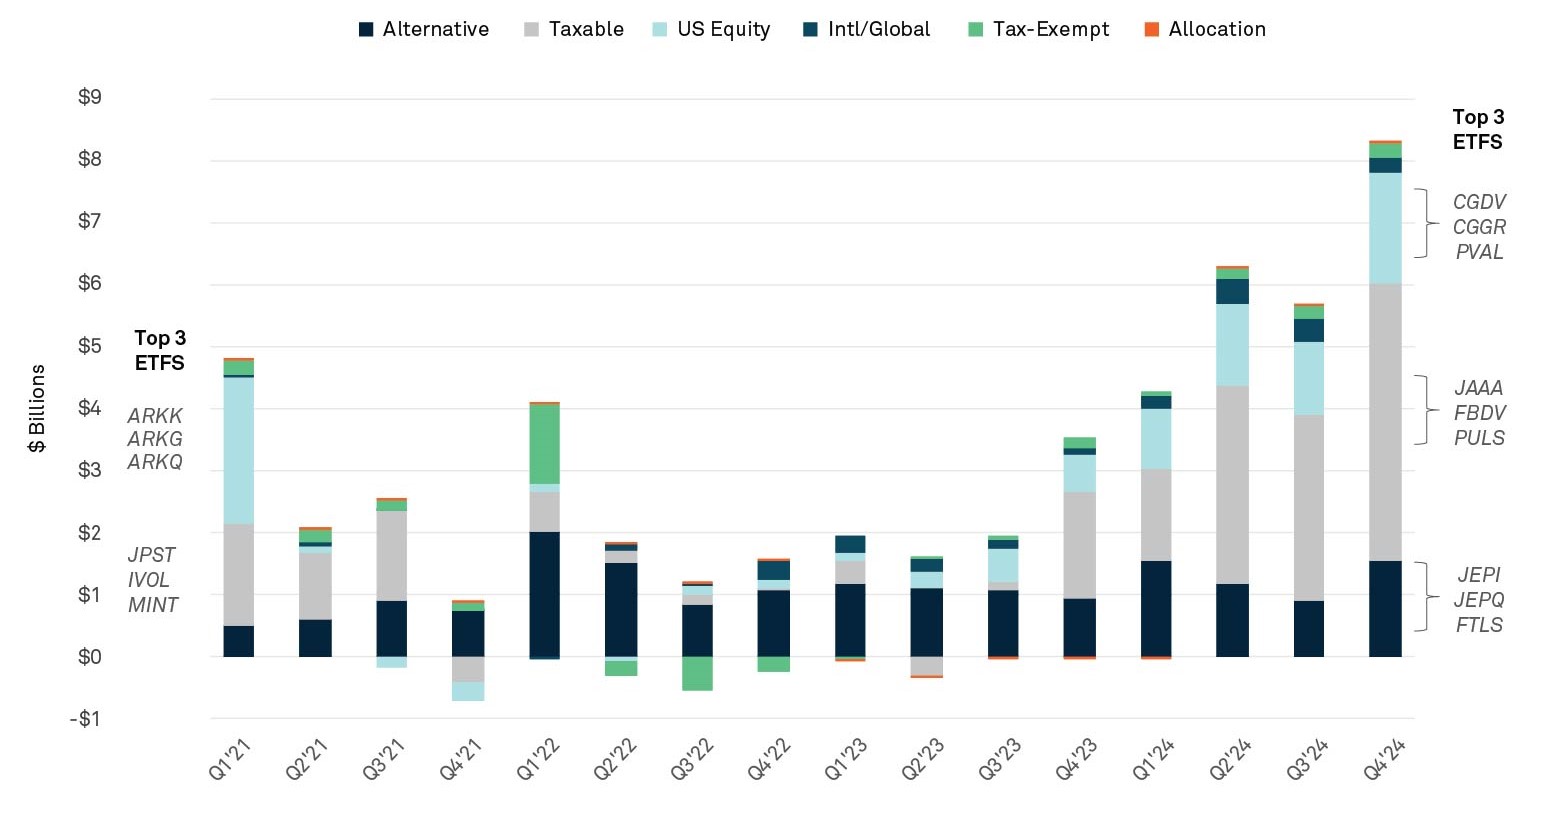
Active ETF net flows for 2024 of 24.6 billion fell just short of the combined $25.9 billion for the prior 3 years combined. Rep-as-PM programs were a major driver of the uptick, seeing a 183% increase in active ETF net sales at wirehouses, which is more than double the 89% jump for total ETF net sales.
Among RIAs on BNY Pershing’s platform, active ETF net sales rose by 44% while total ETF net sales grew by 6%. The flow concentration of active ETFs has began to decline somewhat. While 39 active ETFs accounted for 80% of Rep-as-PM net sales, 63 different products accounted for 80% of RIA net sales. From an issuer standpoint, the five issuers captured 80% of Rep-as-PM flows in the wirehouses versus ten issuers for the same proportion of RIA flows. Overall, the top ten issuers represented 81% of AUM in Q4 2024, down from 93% in Q4 2021.
Figure 2: Wirehouse - Active ETF Net Flows
Source: BNY Growth Dynamics. Trend data as of December 31, 2024.
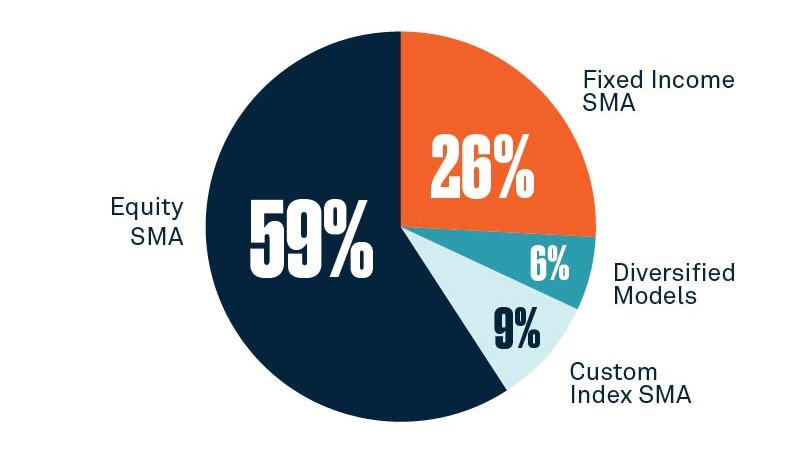
AUM in wirehouse third-party managed accounts reached $921 billion, with 59% of that amount in equity SMAs and 26% in fixed-income SMAs. Custom index SMA was a frontrunner in 2024, accounting for 28% of SMA net sales while representing just 9% of SMA assets at the end of Q4 2024. Consistently strong demand also saw custom index make up 68% of U.S. equity SMA net sales.
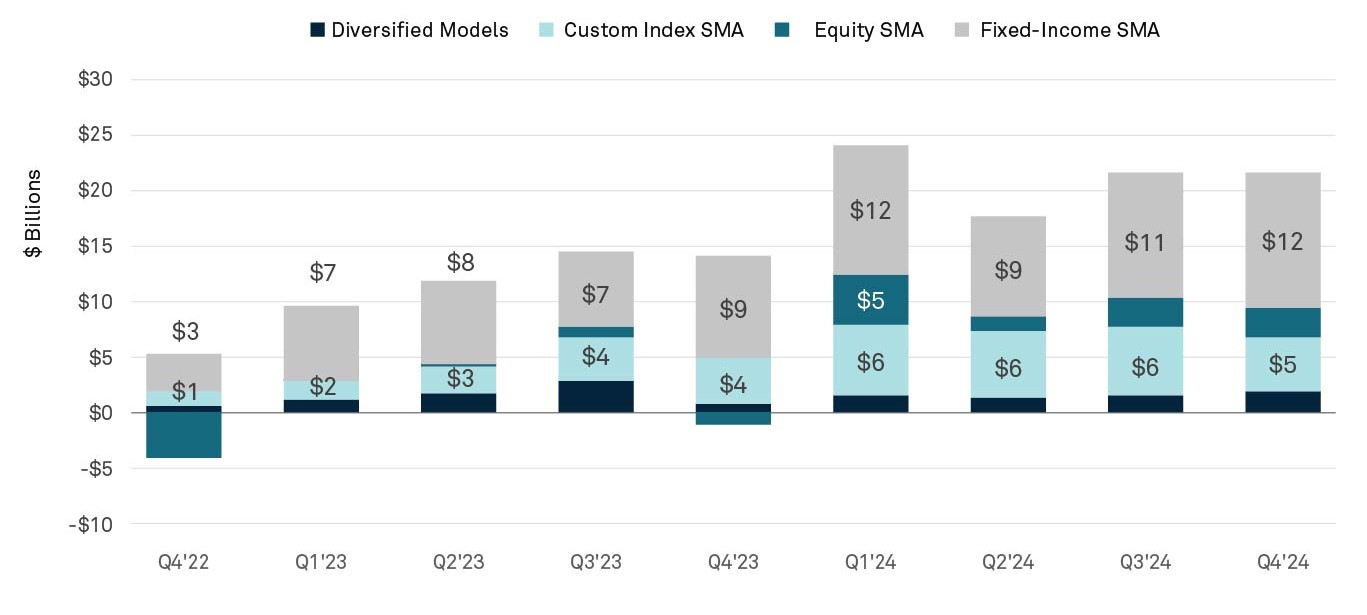
Taxable fixed-income SMA fared well, with 2024 sales totaling $16 billion surpassing the previous two years combined. Taxable fixed-income SMA made up 10% of year-end SMA assets but 19% of the year’s net sales.
Figure 3: 3rd Party Managed Account Net Sales
Source: BNY Growth Dynamics. Trend data as of December 31, 2024.
Figure 4: Wirehouse 3rd Party Managed Account AUM ($921B)
Source: BNY Growth Dynamics. Trend data as of December 31, 2024.
Likewise, taxable fixed-income active ETFs ($10 billion) also saw more net sales in 2024 than in the previous two years combined. The data also reveals a year-on-year uptick for taxable fixed-income mutual funds with net sales of $18 billion in 2024.
As growth continues to expand, advisors are turning to products that offer tax efficiency and flexibility. Staying informed with the latest data is crucial to identifying emerging opportunities that can enhance a firm's ability to meet its growth objectives.
For more information please reach out to the BNY Growth Dynamics team.
All flow data is sourced from BNY Growth Dynamics as of December 31, 2024. The aggregate data used in this analysis is based on Mutual Fund, ETF and SMA asset and sales data reported to BNY Growth Dynamics under a data sponsor agreement. Data currently represents approximately $3.1 trillion in assets under management (AUM) with national broker-dealers. The data set includes sales through a financial advisor and excludes institutional and retirement plan sales.

Scott Anderson
Director of Research, BNY Growth DynamicsSM
Disclaimers:
BNY is the corporate brand of The Bank of New York Mellon Corporation and may be used to reference the corporation as a whole and/or its various subsidiaries generally.
This material does not constitute a recommendation by BNY of any kind. The information herein is not intended to provide tax, legal, investment, accounting, financial or other professional advice on any matter, and should not be used or relied upon as such. The views expressed within this material are those of the contributors and not necessarily those of BNY. BNY has not independently verified the information contained in this material and makes no representation as to the accuracy, completeness, timeliness, merchantability or fitness for a specific purpose of the information provided in this material. BNY assumes no direct or consequential liability for any errors in or reliance upon this material.
This material may not be reproduced or disseminated in any form without the express prior written permission of BNY. BNY will not be responsible for updating any information contained within this material and opinions and information contained herein are subject to change without notice. Trademarks, service marks, logos and other intellectual property marks belong to their respective owners.
© 2025 The Bank of New York Mellon. All rights reserved. Member FDIC.

The European Commission’s 2025 Supplementary Pensions Package proposes to align depositary requirements for DC occupational pension schemes with the UCITS V framework. Ton Tol, Head of Netherlands Trustee and Depositary Services at BNY, examines what the shift from national discretion to a common EU standard means for pension funds, depositaries and administrators across Europe.

Franc now looks cheap, especially vs. APAC FX. Long BRL vs. RON the widest real-rate divergence. Readying for momentum trades to hit extremes.

Global curves steepen amid doubts over U.S. price stability China’s Politburo sends stimulus signals for H2 Central bank gold purchases rose sharply in Q2