Market Movers: Uneasy Balance
Market Movers highlights key activities and developments before the U.S. market opens each morning.
Market Movers highlights key activities and developments before the U.S. market opens each morning.

Bob Savage
Time to Read: 7 minutes
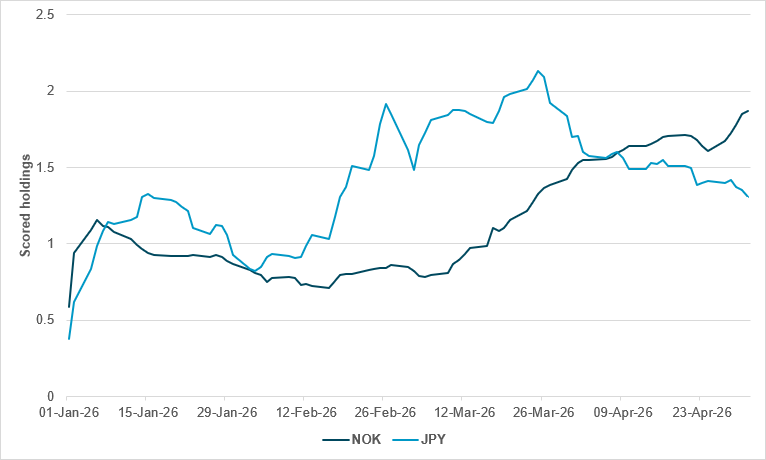
NOK and JPY both well-held but flow momentum differs strongly
Source: BNY
Conflict-related risk aversion appears to be picking up again, and some assets which have done well during the ceasefire may be at risk of an adjustment. Ranking the top two names by various categories, we find that there are a few themes that are dominating asset allocation across different markets. Should investor sentiment regarding these themes begin to reverse, the best-held names could see some of the biggest outflows. We also note that high holdings do not uniformly suggest good flow momentum either: in some cases outflows are already accelerating from high levels, and any shift in preference could lead to even worse performance as investors exit existing longs.
For example, the best-held G10 names are NOK and JPY. The former is the biggest beneficiary from high energy prices and central bank hawkishness, whereas the latter arguably has the strongest case for valuation gains. Both central banks are now active in markets to support their currencies, albeit for different reasons and under different frameworks. Despite this, the direction of flow is extremely different, clearly underscoring the credibility of policy activity in the current environment. Norges Bank has already committed to a hike and may signal more this week (although that is not our base case). It has announced a small uplift in FX sales, and oil prices do not appear to be falling any time soon, which will support terms of trade.
In contrast, JPY has been struggling with real rates for some time, while the balance of payments is working in the opposite direction. Large-scale intervention appears to have commenced, but questions remain over its efficacy. It remains to be seen whether the decline in holdings – which have shed over 40% of YTD gains – can be arrested.
Tracking the ships going through the Strait of Hormuz continues to be the key risk barometer for investors as they watch for supply relief in energy. Ceasefire doubts rose yesterday after Iran and the U.S. exchanged fire and UAE suffered significant missile attacks, but that has not escalated today. The inherent volatility of the situation continues. Nevertheless, risk assets are higher, with stocks mostly up and oil lower, while USD is bid and gold is higher.
AUD and the RBA: Central bank policy divergence is in play, with the RBA hike today contrasting with the ongoing rate cuts in Brazil last week and potentially in Mexico this week. What stands out is that AUD has lost ground today even with the hike. The dissenting vote to hold rates highlights the risk that the RBA will now stand pat, with policy seen as restrictive enough to cope with the uncertainty of inflation from the energy shock. “We feel we are now in a position where we have got space to be alert to both sides of the risks, the inflation and potential risks to the downside, if the war continues,” RBA Governor Michele Bullock noted.
Watching margins and pass-throughs: While the U.S. Q1 earnings season is ongoing, the impact of the higher-than-expected earnings has been to support growth but leave doubts about Q2. Inflation risks from the war and energy supply shock are showing up. As the FT reports, references to “pricing action” and “passing on costs” during first-quarter U.S. earnings calls have climbed to the highest level since Russia’s full-scale invasion of Ukraine sparked the last global inflation shock in 2022.
Private credit and banks: Markets are back to watching the link between AI investments, private credit and banks. The worry about a bubble bursting continues. HSBC has reported a $400mn hit from fraud linked to private credit. Meanwhile, the bank link to AI investments continues, with Meta picking Morgan Stanley and JPM for its $13bn data center in Texas.
Bottom line: The focus for the day will remain on the truce with Iran and the ongoing hopes that Project Freedom will deliver energy relief. On top of that, U.S. economic data will matter, with the JOLTS and trade numbers serving as important guideposts for policy. The Trump/Xi meetings next week are starting to matter to markets, as trade and geopolitics set the agenda. Fed speakers and their spin on policy will keep monetary policy in focus. Bonds have yet to counterbalance stocks, testing retail vs. institutional appetites for risk. The modest equilibrium for risk today rests in the balancing act between inflation and growth expectations, overlaid by President Trump and a host of potential headlines.
Chair Jerome Powell has decided to remain on the Fed Board after his term ends to safeguard institutional independence amid escalating political pressure, the Wall Street Journal has reported. The decision follows a series of legal and political actions by the Trump administration, including a Justice Department investigation and efforts perceived as attempts to exert greater control over the central bank. Powell signaled that these developments posed a risk to the Fed’s autonomy, prompting him to stay despite prior plans to retire. The move has drawn criticism from political allies of the administration, while also raising concerns about governance tensions and the potential for increased scrutiny of monetary policy decisions. S&P Mini +0.26% to 7249, DXY +0.104% to 98.476, 10y UST -0.8bp to 4.43%.
The Reserve Bank of Australia has raised its policy rate by 25bp to 4.35%, highlighting a renewed escalation in inflation risks driven by both domestic capacity pressures and external shocks, particularly the Middle East conflict. The board emphasized that higher fuel and commodity prices are already feeding through to broader costs, with firms beginning to pass these increases onto consumers, raising concerns about second-round effects and elevated inflation expectations. Updated forecasts indicate inflation will peak higher than previously expected before easing as tighter financial conditions dampen demand. However, policymakers stressed that there is significant uncertainty, noting that a prolonged conflict could further lift inflation while simultaneously weighing on global and domestic growth, reinforcing a cautious but tightening policy stance. ASX -0.09% to 5558, AUDUSD -0.252% to 0.7149, 10y ACGB -1bp to 4.971%.
The U.S. will announce Norway as the 15th member of Pax Silica, a consortium aimed at countering China’s influence in critical minerals, technology and AI. Norway’s sovereign wealth fund and mineral reserves are key assets. The U.S. plans commercial deals with major corporations to develop a manufacturing hub in the Philippines, leveraging its nickel and copper resources to diversify supply chains away from China. The initiative seeks to secure supply chains for U.S. factories and reduce dependence on China, whose export controls are seen as a global economic risk. This announcement precedes a planned U.S.-China trade summit in mid-May. CSI 300 -0.06% to 4807, USDCNY -0.18% to 6.8281, 10y CGB +0.5bp to 1.752%.
A group of Senate Republicans is drafting a military authorization for potential renewed strikes on Iran, anticipating a fresh notification if hostilities resume. Under the War Powers Act, such authorization could receive expedited Senate consideration within the first 30 days of renewed conflict. Discussions include whether the measure would require a 60-vote supermajority or a simple majority. The proposed authorization is expected to limit the deployment of ground troops and set a finite timeframe for the conflict. This move follows President Trump’s recent statement that the initial period of conflict has ended and an increase in tensions over control of the Strait of Hormuz. Brent -0.848% to 113.47, WTI -2.124% to 104.16, Omani crude +4.743% to 106.9, Dubai crude +6.023% to 106.929.
U.S. March trade balance is forecast to widen to -$60.8bn vs. -$57.3bn with imports expected to ease to 2.7% m/m vs. 4.3% m/m and exports expected to ease to 1.9% m/m vs. 4.2% m/m.
U.S. April ISM Services Index is forecast to ease to 53.7 vs. 54.0 with prices paid expected to rise to 73.0 vs. 70.7, new orders expected to ease to 57.5 vs. 60.6 and employment expected to rise to 49 vs. 45.2.
U.S. March new home sales forecast at 660k vs. 587k in January.
U.S. March JOLTS job openings forecast to ease to 6.850 million vs. 6.882 million.
Canada March merchandise trade is expected to narrow to CAD -2.63bn vs. CAD -5.74bn.
Canada April S&P Services PMI is expected at 47 vs. 47.2.
Canada April S&P Composite PMI is expected at 47.5 vs. 47.6.
U.S. Treasury sells $75bn in 6-week bills.
Central bank speakers: The Fed’s Michelle Bowman speaks at the Washington Financial Symposium. The Fed’s Michael Barr speaks on banking regulation. ECB Chief Economist Philip Lane gives a keynote speech at the Climate, Nature and Price Stability Conference.
Mood: iFlow mood is converging toward neutral (0.023), as stronger demand for core government bonds offset softer global equity demand.
FX: Flows remained moderate with a sell bias, led by COP. Selective inflows were seen in EUR, GBP, NOK, CNY, THB and INR.
FI: Flows were moderate and mixed. Buying was more pronounced in the G10 and EMEA –particularly Eurozone government bonds and U.K. gilts – while LatAm and APAC bonds saw a selling bias.
Equities: G10, EMEA and APAC equities were broadly sold, in contrast to buying in LatAm. Within DM, the industrials, materials and consumer discretionary sectors saw outflows, while energy and consumer staples attracted the strongest demand.
“Balance is not something you find, it’s something you create.” – Jana Kingsford
“Anxiety is the dizziness of freedom.” – Søren Kierkegaard
Spanish unemployment fell 2.59% m/m in April, with the number of registered unemployed down 62,668 to 2.36 million, dipping below 2.4 million for the first time since 2008 since 2008. Unemployment was 6.2% lower y/y. The improvement was broad-based across all sectors, with services leading the decrease, and extended to all regions. Youth unemployment fell sharply to a record low of 169,693, while both female and male unemployment decreased, with female unemployment reaching its lowest level since 2008. Labor market conditions were supported by strong hiring, including a high share of permanent contracts. Meanwhile, the unemployment benefit coverage rate rose to 78.8% in March, the highest March reading since 2010, indicating improved social protection alongside labor market tightening. IBEX 35 -0.03% to 17337, EURUSD +0.009% to 1.1692, 10y Bono -2.3bp to 3.543%.
Swiss inflation remained subdued in April, with consumer prices rising 0.3% m/m and 0.6% y/y, indicating limited underlying price pressures despite some energy-driven increases. The m/m rise was largely attributed to higher petrol, diesel and heating oil prices, alongside increases in air transport and international travel costs, while lower accommodation and car rental prices partially offset the gains. Core inflation remained muted at 0.3% y/y, highlighting contained domestic price dynamics. Imported goods prices rose more strongly than domestic components, reflecting external cost pressures. Overall, the data point to modest inflation momentum, with energy-related volatility playing a key role. SMI -1.01% to 13003, EURCHF -0.015% to 0.91641, 10y Swiss GB -1.1bp to 0.425%.
Australia’s services PMI for April showed a second consecutive monthly decline in new orders amid rising inflationary pressures driven by higher fuel costs linked to the Middle East conflict. Despite this, business activity returned to growth, with the business activity index rising to 50.7 points from 46.3 in March, supported by sustained job creation – the sixteenth consecutive m/m increase. Input price inflation accelerated sharply to its highest level since August 2022, which affected the transport and storage sectors in particular. Output prices rose at the fastest pace since January 2023. Business confidence remained muted and unchanged from March, with firms hopeful that orders will recover if the conflict ends soon. ASX -0.09% to 5558, AUDUSD -0.252% to 0.7149, 10y ACGB -1bp to 4.971%
Australia’s household spending rose 1.6% m/m in March, accelerating from modest gains of 0.3% in February and 0.2% in January, while y/y growth remained elevated at 6.3% in nominal terms. The increase was largely driven by a 5.1% spike in transport spending, reflecting a surge in fuel prices linked to the Middle East conflict, alongside stronger public transport usage as households adjusted their behavior. Food spending also rose solidly (+1.7%), supported by higher prices and some precautionary stockpiling on supply concerns. Despite higher nominal spending on fuel, estimated volumes declined, indicating price-driven effects rather than underlying demand strength.
The April 2026 ANZ World Commodity Price Index fell -0.8% m/m and rose 2.5% y/y (March: +4.2% m/m, +3.4% y/y). This was mainly attributable to a 3.8% m/m drop in volatile dairy prices, which were down 7.5% y/y on strong global supply. Forestry prices rose 7.1% m/m, reflecting higher production and transport costs, while aluminum surged 6.3% m/m to a record high, up 50.9% y/y, after damage to a UAE smelter tightened supply. The NZD Commodity Price Index fell 0.7% m/m. Meat and fiber prices edged up 0.2% m/m to record levels, with lamb and wool rising despite seasonal supply pressures. Horticulture was unchanged. NZX 50 -0.47% to 13036, NZDUSD +0.052% to 0.5876, 10y NZGB -0.8bp to 4.648%.
Singapore’s retail sales rose 4.8% y/y in March, easing from the 8.3% growth recorded in February, while sales excluding motor vehicles rose 3.3%. On a seasonally adjusted basis, retail sales grew 3.7% m/m, indicating a rebound in activity, with broad-based gains across most sectors. Petrol service stations recorded a sharp 16.2% increase, largely reflecting higher fuel prices, while apparel and convenience store sales also posted strong gains. Online sales continued to expand their share, rising to 15.7% of total retail turnover. However, some categories such as recreational goods and food and alcohol experienced falls, pointing to uneven consumption patterns despite overall growth. STI -0.61% to 4894, USDSGD -0.016% to 1.2767, 10y SGB -1bp to 2.095%.
ASEAN’s manufacturing sector experienced a further slowdown in April, with the manufacturing PMI falling to 50.7 from 51.8 in March and 53.8 in February. Output growth nearly stalled, and new orders rose at the slowest pace in eight months, while new export orders shrank for the second consecutive month. Employment fell slightly for the first time in eight months. Supply chain delays lengthened delivery times, leading to reduced inventories. Inflationary pressures intensified, with input costs and output prices rising at the fastest rate since March 2022. Despite challenges, business confidence remained positive. MSCI Asia +2.05% to 262, USD vs. APAC FX Index -0.026% to 104.2328, BBG AGG APAC Government High Grade USD 0bp to 4.766%.
Indonesian GDP expanded by 5.61% y/y in Q1, with the economy valued at IDR 6.187qn in current prices and IDR 3.448qn in constant 2010 prices. Growth was driven on the production side by strong performance in accommodation and food services, which rose 13.14%, while on the expenditure side government consumption surged 21.81%. However, on a q/q basis the economy contracted by 0.77%, reflecting a pullback after previous strength, with mining and quarrying declining sharply and government spending also reversing. By region, Java remained dominant, accounting for over half of economic activity and posting solid annual growth, underscoring its central role in Indonesia’s economic structure. JCI +0.85% to 7031, USDIDR +0.346% to 17440, 10y IDGB +1.4bp to 6.814%.
Indonesia’s labor market saw modest improvement in February, with the labor force rising to 154.91 million people, up by 1.86 million from a year earlier, while the labor force participation rate edged slightly lower to 70.56%. The employment count increased to 147.67 million, reflecting solid job creation, particularly in agriculture, forestry and fisheries, which remained the largest employer with nearly 29% of total employment. The unemployment rate fell to 4.68%, indicating a gradual tightening in labor market conditions. Meanwhile, average wages reached IDR 3.29mn, suggesting some income growth alongside improving employment dynamics, although participation trends point to limited expansion in overall workforce engagement.
Thailand’s manufacturing sector saw a solid improvement in April 2026, with the manufacturing PMI at 52.7 points, down from 54.1 in March. Output and new orders continued to grow but at a slower pace, hitting an eight-month low for new orders. Input costs rose at the fastest rate since September 2022, driven by the Middle East war's impact on oil, fuel, transportation and raw materials. Factory gate charges increased for the first time in eight months. Supply chain disruptions intensified, and inventories rose amid concerns over future price hikes. Employment remained stable, while business confidence improved but remained subdued. SET -0.45% to 1487, USDTHB +0.402% to 32.728, 10y TGN +3.8bp to 2.181%.
Thai business sentiment deteriorated in April, with the Business Sentiment Index falling to 43.5 points, reflecting broad-based declines across all sectors because of the impact of the Middle East conflict. The downturn was driven by rising costs and weakening performance, particularly affecting energy-intensive firms, businesses reliant on Middle East inputs and tourism-related sectors. Manufacturing sentiment weakened on tighter upstream supply in petrochemicals and concerns over raw material shortages in electronics, while non-manufacturing confidence fell sharply, led by hotels and restaurants amid weaker tourism demand. The three-month-ahead index dropped further to 40.9, below the neutral threshold, signaling growing concerns about prolonged disruptions, higher energy costs and weakening order books.
The Philippines’ inflation rate accelerated sharply in April to 7.2% y/y, from 4.1% in March, marking a significant pickup compared with 1.4% a year earlier and bringing the YTD average to 3.9%. The surge was primarily driven by food and non-alcoholic beverages inflation, which rose to 6.0%, alongside a steep increase in transport costs to 21.4% and a substantial rise in housing and utilities inflation to 8.2%. These three categories were also the largest contributors to headline inflation, jointly accounting for the bulk of the increase. Broader price pressures were evident across most other consumption categories, indicating increasingly generalized inflation momentum rather than isolated shocks. PSEi -0.74% to 5898, USDPHP +0.142% to 61.659, 10y PHGB +14bp to 7.026%.
Hong Kong GDP grew 5.9% y/y in Q1, accelerating from 4.0% in the previous quarter and marking the strongest expansion in nearly five years, while q/q growth reached 2.9%. The pickup was broad-based, with private consumption rising by 5.0% and government spending by 2.9%, alongside a sharp 17.7% expansion in investment. External demand remained a key driver, with goods exports surging 23.8%, although imports grew even faster, reflecting strong trade flows. Services exports posted more moderate gains. The outlook remains supported by technology demand and tourism recovery, though geopolitical tensions present downside risks. Hang Seng -0.96% to 25845, USDHKD +0.04% to 7.8358, 10y HKGB -1.2bp to 1.417%.