Market Movers: Opposing Forces
Market Movers highlights key activities and developments before the U.S. market opens each morning.
Market Movers highlights key activities and developments before the U.S. market opens each morning.

Bob Savage
Time to Read: 8 minutes
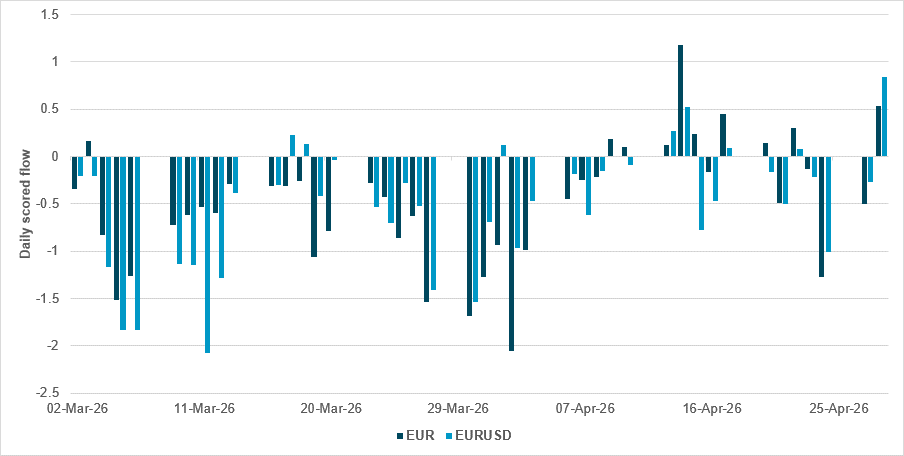
EUR and EURUSD trying to recover ahead of ECB decision
Source: BNY
The EUR is continuing to struggle with net flow figures as we head into the ECB decision. The strong ECB inflation expectations print helped to strengthen flows and push for additional exposures, but the overall flow picture is weak. While we do also anticipate some additional buying into month-end, the prospect of policy missteps in the form of hikes continues to impact interest.
EURUSD is continuing to react to the Fed decision, but flows up to this Tuesday suggest that clear divergence between the ECB and Fed is still being priced in – and based on hedging needs alone some purchases are justified. In contrast, EURGBP is continuing to struggle even though 2026 rate expectations now clearly favor the ECB, as the growth outcomes are far from guaranteed.
The extended run of poor survey data out of Germany supports the view that caution is needed ahead of the policy decision, and we suspect that a large part of the Governing Council membership is not in the business of very tactical policymaking.
The outflows show clear signs of asymmetry amid a supply shock, in which efforts to tighten in the name of enforcing restraint do not do much good for asset allocation. That is especially the case when the starting point for rates is very low, while cuts will continue to undermine flow and holdings due to rate differentials. If the Fed were in a different position where easing was not the base case, we suspect EUR would have struggled even more. In addition, markets are starting to take notice that U.S. equity performance is beginning to pick up again. This raises the prospect of U.S. total return flow starting to support the “U.S. exceptionalism theme,” and suggests the dollar will swiftly play catch-up to equities.
As Brent oil prices break through the $126/barrel mark to set a four-year high, risk sentiment continues to erode. The concerns over an escalation in the U.S.-Iran war are dominant, with ongoing fears about the inflationary impact. However, market correlation is clearly different. Global shares are lower, while bond yields are mixed, with gains in APAC but falls in Europe and the U.S. It is also noteworthy that gold and steel are higher within commodities. USD has lost ground today, with JPY intervention risks a key focus along with key rate decisions from the BoE and ECB today, all of which are capping the dollar rally. The opposing forces of AI productivity and oil inflation are pushing a focus on the growth and policy mixes into May and the rest of the year.
Big tech earnings: The focus today will shift to Apple, after capex spending plans from Meta and others worried investors on the return and sustainability fronts, even as earnings beat expectations. Total AI spending plans for 2026 are now over $725bn. Overnight, Samsung beat earnings predictions, with AI chip demand strong, while Cambricon made gains on chip sales to China. The U.S. SOX index rose by more than 2.3% again, but that did not lift Asian stocks: South Korean industrial production and a mixed China PMI report represented drags on growth views outside the tech sector.
Japan warnings: Final warnings from the Ministry of Finance FX chief Atsushi Mimura drove JPY from 160.73 overnight to 159.50. JGB 10y yields jumped 6bp higher to 2.51%, while 30y rates rose to 3.72%, even as a 2y debt auction enjoyed strong demand. The bid/cover ratio was 5.24, the best since August 2024, but 2y yields still rose to nearly 1.40%. Japanese shares fell in a catch-up session that saw selling, with the focus on Golden Week holiday illiquidity and month-end pressure. The next risks for Japan beyond the JPY 160 line will come from the APEC summit and Japan-China ties.
Central bank bias: The ECB and BoE are in the spotlight today, with both expected to keep rates on hold but with a hawkish bias. This contrast with the Fed, where an easing bias was opposed by three FOMC voters. The worry over weak growth, supply-led inflation and a policy mistake is high, showing up in stocks, bonds and the FX markets. It is worth noting that out of all the central bank decisions over the last two days, while Brazil’s COPOM made a 25bp cut to 14.5%, it too highlighted doubts over the inflation outlooks caused by the Iran war. Economic data and the reactions to these releases now matter more than central bank guidance. As an example, the EU’s stagflationary dataset today will be compared with the U.S. data to come, despite Powell’s swansong of a “hawkish hold.”
Bottom line: The ECB’s ability to guide risk across markets has been mixed but it will matter today, after Eurozone growth undershot expectations at 0.8% y/y while core CPI rose to 2.2% y/y. Earnings have been critical in offsetting the worst outcomes in risk this week, but we are at month-end and rethinking portfolios based on new facts makes trading on headlines even riskier. The mixed reactions to U.S. big tech earnings highlight the tension between productivity and supply shocks. The fraying of correlations reflects the opposing forces at play, as investors try to match the news to the duration in the weeks ahead. USD will remain the barometer to watch, with EURUSD 1.1550 or 1.1750 the binary risk metric of the day.
President Trump has said the U.S. is reviewing a potential reduction of troops in Germany, highlighting rising tensions with Europe amid the Iran conflict. The announcement follows criticism from German Chancellor Friedrich Merz, who described the U.S. handling of the Iran war as poorly planned and damaging, reflecting growing European frustration over economic fallout from higher energy prices and weaker growth. Germany, which hosts around 37,500 U.S. troops, fears that a drawdown could undermine security as it works to rebuild its defense capabilities. The review will form part of a broader U.S. military posture assessment, with European leaders concerned about the future of transatlantic security cooperation. DAX -0.22% to 23903, EURUSD 0% to 1.1677, 10y Bund -0.3bp to 3.107%.
Japanese Finance Minister Satsuki Katayama has warned that the time for potential currency intervention is approaching as the yen weakened past the 160 per dollar level, its lowest ebb since mid-2024. The move followed policy decisions by the BoJ and Fed to keep rates unchanged, maintaining a wide interest rate differential that has exerted pressure on the yen. Katayama signaled readiness to take “bold steps,” typically implying market intervention, and said the authorities would closely monitor markets during the Golden Week holiday period. The yen strengthened briefly after her comments, highlighting market sensitivity, while higher oil prices linked to Middle East tensions have added further downside pressure. Japan’s key currency official Atsushi Mimura also stated that this was a “final warning” before action. Nikkei -1.06% to 59285, USDJPY -0.455% to 160.49, 10y JGB +4.6bp to 2.523%.
China has allowed state-owned refiners to export around 500,000 tons of gasoline, diesel and jet fuel to selected Asian buyers, signaling a partial easing of earlier export restrictions. The one-off quota comes as the Iran conflict disrupts supply through the Strait of Hormuz, tightening fuel availability across the region and particularly affecting emerging Asian economies. Shipments are expected to head to countries such as Vietnam and Laos and have already been prepared for export. The move follows a period in which China restricted fuel exports to protect domestic supply, leading to high inventory levels, and suggests a policy adjustment aimed at balancing domestic conditions with regional demand pressures. Brent crude +2.915% to 121.47, WTI +0.927% to 107.87, Omani crude +18.554% to 111.44, Dubai crude +0.136% to 105.692.
Hungary’s incoming leader Péter Magyar has signaled he will make support for Ukraine’s EU accession talks conditional on expanded rights for the Hungarian minority in Ukraine, maintaining a stance similar to that of his predecessor. This is a clear disappointment for EU officials and Kyiv, who had expected that the change in leadership would remove a key obstacle and accelerate Ukraine’s membership process. Instead, Magyar’s position risks prolonging delays at a critical stage, as the EU seeks to advance accession negotiations in the coming weeks. While he has indicated willingness to engage with Ukraine, the continued focus on minority rights underscores persistent tensions that may hinder broader EU enlargement efforts. Budapest SI +0.95% to 133897, EURHUF +0.11% to 366.11, 10y HGB -4bp to 6.03%.
Bank of England bank rate is expected to be kept unchanged at 3.75%.
The European Central Bank is expected to hold its deposit rate at 2.00%.
U.S. March personal income is forecast to rise to 0.3% m/m vs. -0.1% m/m, while personal spending is expected to rise to 0.9% m/m vs. 0.5% m/m.
U.S. March PCE price index is forecast at 0.7% m/m, 3.5% y/y vs. 0.4% m/m, 2.8% y/y in February, while the core PCE price index is expected at 0.3% m/m, 3.2% y/y vs. 0.4% m/m, 3.0% y/y in February and real personal spending is expected to rise to 0.3% m/m vs. 0.1% m/m.
U.S. initial jobless claims are expected to ease to 213k vs. 214k.
U.S. Q1 employment cost index forecast to rise to 0.8% q/q vs. 0.7% q/q.
U.S. Q1 advance GDP is forecast to rise to 2.2% q/q vs. 0.5% q/q, with personal consumption expected to ease to 1.4% q/q vs. 1.9% q/q while the GDP price index is expected to rise to 3.8% q/q vs. 3.7% q/q and the core PCE price index is seen rising to 4.1% q/q vs. 2.7% q/q.
U.S. April MNI Chicago PMI is expected to rise to 55.2 vs. 52.8.
U.S. March leading index is expected at -0.20% m/m vs. -0.1% in January.
Canada February payroll employment change is due; the January reading was 45.6k.
Canada February GDP is expected at 0.2% m/m, 1.0% y/y vs. 0.1% m/m, 0.6% y/y in January.
U.S. Treasury sells $80bn in 4-week bills and $75bn in 8-week bills.
Mood: Continued strong demand for core sovereign bonds, alongside a marginal easing in equity flows, pushed the iFlow Mood index lower to 0.087.
FX: Outflows were concentrated in G10 and LatAm, with selective inflows into USD and CAD. EMEA flows were mixed, while APAC saw a modest inflow bias led by THB, offset by outflows in CNY and IDR.
FI: Strong buying across major sovereigns – U.S. Treasurys, U.K. gilts, JGBs and Eurozone government bonds – contrasted with selling in LatAm, China, the Philippines and Hungary.
Equities: Robust inflows into Chinese, LatAm and South African equities, followed by the U.S., while the rest of the universe saw light selling, notably in Norway, Hungary and South Korea.
“Strong people are made by opposition like kites that go up against the wind.” – Frank Harris
“Do not see dirt thrown at you as your enemy, but as ground to grow.” – Matshona Dhliwayo
The euro area inflation rate rose to 3.0% y/y in April from 2.6% in March, marking a clear acceleration in price pressures. This increase was driven primarily by a sharp rise in energy inflation, which jumped to 10.9%, while services inflation eased slightly but remained elevated. Food prices saw modest gains, and non-energy industrial goods inflation remained subdued. Core inflation measures excluding energy eased slightly, indicating that the headline increase was largely energy-driven. Overall, the data suggest renewed inflationary momentum in the euro area, with energy costs playing a dominant role despite some easing in underlying price pressures. Euro Stoxx 50 -0.63% to 5780, EURUSD 0% to 1.1677, BBG AGG Euro Government High Grade EUR +3.4bp to 3.316%.
Euro area Q1 GDP was up 0.1% q/q, while the EU matched this pace, slowing from 0.2% growth in the previous quarter in both areas. On a y/y basis, growth softened to 0.8% in the euro area and 1.0% in the EU, down from stronger rates in late 2025. Performance across member states was mixed, with Finland, Hungary and Spain recording the strongest quarterly expansions, while Ireland, Lithuania and Sweden experienced contractions. Overall, the data indicate a loss of momentum in early 2026, with growth remaining positive but subdued and uneven across the region.
The euro area unemployment rate fell to 6.2% in March from 6.3% in February, while the EU rate remained unchanged at 6.0%, indicating broadly stable labor market conditions. The unemployment count fell on both a m/m and y/y basis in the euro area, while changes at EU-wide level were more modest. Youth unemployment showed mixed dynamics, rising slightly in the EU to 15.4% but remaining stable at 14.9% in the euro area. Gender disparities persisted, with higher unemployment rates for women than men. Overall, the data point to a resilient labor market with gradual improvements, though youth unemployment remains elevated.
The EU’s business investment rate fell 21.8% in Q4 2025, its lowest level since Q3 2015. This continued a downward trend in place since 2021, after earlier gains between 2014 and 2018. The fall reflects weakening investment activity among non-financial corporations, with the decline contrasting sharply with earlier peaks driven partly by intellectual property-related investment flows. At country level, investment rates remain uneven, with the highest levels recorded in Hungary, Croatia and Czechia, while Luxembourg, Ireland and Cyprus saw the lowest rates. Overall, the data indicate subdued corporate investment across the EU, pointing to softer capital formation dynamics in recent years.
German GDP grew by 0.3% q/q and 0.5% y/y in Q1, indicating a modest continuation of economic expansion following growth in late 2025. The quarterly growth was supported by higher private and government consumption as well as an increase in exports, suggesting a broad-based but moderate improvement in demand conditions. On a y/y basis, growth remained weak, reflecting the subdued pace of recovery. Overall, the data point to a fragile economic environment, with positive momentum sustained but still limited, highlighting that Germany’s economy is expanding only gradually amid ongoing structural and external challenges. DAX -0.22% to 23903, EURUSD 0% to 1.1677, 10y Bund -0.3bp to 3.107%.
German import prices rose by 2.3% y/y and 3.6% m/m in March, marking the strongest annual increase since February 2025 and a sharp turnaround from prior declines. The rise was driven primarily by energy and intermediate goods, with energy prices jumping significantly amid geopolitical tensions linked to the Middle East, while metals and fertilizers also recorded strong gains. Excluding energy, import price growth was more moderate, indicating concentrated cost pressures. Export prices also increased by 1.5% y/y and 1.1% m/m, supported by intermediate goods and energy. Despite y/y declines in agricultural and consumer goods prices, m/m increases point to emerging inflationary pressures.
German retail sales fell by 2.0% m/m in real terms and 1.5% in nominal terms in March, reversing the modest decline seen in February and marking a 2.0% y/y contraction in volume terms. The weakness was broad-based, with food retail sales falling sharply both m/m and y/y, while non-food sales also contracted modestly. Fuel station sales highlighted the impact of Middle East tensions, with real volumes dropping significantly despite nominal gains due to higher prices. In contrast, online and mail order trade remained resilient, posting solid growth on both m/m and y/y measures. Overall, the data point to subdued consumer demand amid rising price pressures.
German employment fell 0.1% m/m on a seasonally adjusted basis in March, equivalent to a drop of around 25,000 people. This continues a gradual downward trend dating back to mid-2025. In non-adjusted terms, employment was broadly flat on the month, while on a y/y basis it fell by 0.4%, extending the ongoing contraction. Over the first quarter, employment also edged lower, confirming weakening labor market momentum. Meanwhile, unemployment increased substantially compared with a year earlier, with the unemployment rate rising to 4.2%, although it remained stable at 4.0% on a seasonally adjusted basis. Overall, the data indicate a softening labor market backdrop with declining employment levels and rising slack.
France’s consumer price index rose by 2.2% y/y in April, accelerating from 1.7% in March, while m/m inflation remained firm at 1.0%. The pickup in headline inflation was primarily driven by a sharp acceleration in energy prices, which surged by 14.2% y/y due to higher petroleum product costs. Services inflation also edged higher, supported by increases in transport and accommodation prices. In contrast, food price inflation softened and manufactured goods prices continued to decline slightly, limiting broader price pressures. The harmonized measure rose to 2.5% y/y, reinforcing the trend of rising inflation momentum largely concentrated in energy-related components. CAC 40 -1.2% to 7975, EURUSD 0% to 1.1677, 10y OAT -0.5bp to 3.773%.
French industrial producer prices rose by 2.4% m/m and 0.3% y/y in March, rebounding from a 1.2% m/m fall in February. The pickup was broad-based across both the domestic and export markets, with domestic prices up 2.0% and foreign market prices up 3.5%. The surge was driven primarily by energy-related components, above all refined petroleum products, which recorded exceptionally sharp increases as the Middle East disruptions affected oil supply routes. Excluding energy, price pressures remained modest, indicating limited underlying inflation momentum. Import prices also rose strongly, up 6.2% m/m, reflecting similar energy dynamics, while most manufacturing categories saw only moderate gains, highlighting the dominant role of external cost shocks.
French private payroll employment was broadly unchanged in Q1, edging down by 0.1% q/q, equivalent to a loss of around 11,400 jobs, and recording a fifth consecutive y/y decline at -0.3%. The weakness was uneven across sectors, with construction continuing to contract and agriculture reversing prior gains, while industry remained largely stable. Market services showed little momentum, whereas non-market services posted a modest rebound. Temporary employment fell again, signaling ongoing labor market fragility. Despite the recent stagnation, overall employment levels remain significantly above pre-pandemic levels, suggesting that while cyclical conditions have softened, the labor market retains some structural resilience.
French Q1 GDP was flat at 0.0% q/q, slowing from 0.2% growth in Q4 2025, reflecting weak domestic demand and a drag from external trade. Household consumption dipped slightly and investment contracted, leaving the domestic demand contribution neutral. Net trade weighed heavily on growth, subtracting 0.7 percentage points as exports fell sharply, particularly in transport equipment, while imports also declined. In contrast, inventory accumulation provided a strong positive contribution, offsetting underlying weakness. On the supply side, overall production remained subdued, with gains in manufacturing offset by falls in the construction and energy sectors, highlighting a fragile and uneven economic backdrop.
French household consumption of goods rallied by 0.7% m/m in March, following a 1.4% fall in February, driven primarily by a recovery in engineered goods. Within this category, durable goods led the increase, supported by stronger purchases of transport equipment and household durables, while textile and clothing spending also rose modestly. In contrast, energy consumption remained broadly stable and food consumption was little-changed. Despite the m/m rally, underlying momentum remains weak, as total goods consumption shrank by 0.6% over Q1, largely due to a sharp contraction in energy spending. This suggests that consumer demand remains fragile, with gains concentrated in discretionary durable goods, rather than seeing broad-based improvement.
Italian Q1 GDP growth was 0.2% q/q and 0.7% y/y, indicating modest economic expansion. This was driven by gains in the services sector, while value added declined in both agriculture and industry, highlighting uneven performance across sectors. From a demand perspective, growth was supported by a positive contribution from net exports, which offset a negative contribution from domestic demand, including inventories. Calendar effects were neutral y/y, though the quarter had one fewer working day than the previous period. Overall, the acquired growth for 2026 stands at 0.5%, suggesting a moderate but fragile recovery with reliance on external demand rather than domestic momentum. FTSE MIB -0.66% to 47478, EURUSD 0% to 1.1677, 10y BTP 0bp to 3.957%
Italy’s consumer price index rose by 2.8% y/y in April, accelerating from 1.7% in March, while increasing by 1.2% m/m, indicating a sharp pickup in inflation. The rise was driven primarily by a surge in energy prices, both regulated and non-regulated, alongside faster growth in unprocessed food prices. In contrast, services inflation eased, particularly in transport and recreational services, contributing to a slowdown in core inflation to 1.6%. Goods inflation accelerated significantly, overtaking services, while frequently purchased items saw stronger price increases. The harmonized measure also rose to 2.9% y/y, with acquired inflation for 2026 at 2.4%, highlighting renewed price pressures led by energy and food components.
Italy’s labor market recorded a slight m/m fall in employment in March, at -0.1% m/m or 12,000 jobs, alongside a decrease in unemployment and a rise in inactivity. The unemployment rate fell to 5.2%, while the inactivity rate increased to 34.1%, indicating some withdrawal from the labor force. Employment losses were concentrated among women, temporary workers, self-employed people, younger workers and over-50s, while employment rose among men and those aged 25-49. On a q/q basis, employment edged up slightly, but unemployment was down more sharply and inactivity increased. Compared with a year earlier, employment fell marginally and inactivity rose, while unemployment dropped significantly, pointing to a softening but still relatively stable labor market overall.
Spain’s Q1 GDP was up 0.6% q/q and 2.7% y/y, with growth easing slightly vs. the previous quarter but remaining solid overall. Domestic demand remained the main driver, contributing positively to both q/q and y/y growth, supported by household consumption and investment, while external demand exerted a negative drag despite lower imports. On the supply side, all major sectors expanded on a q/q basis, with particularly strong gains in primary activities. Employment indicators were robust, with full time equivalent jobs rising 2.8% y/y and hours worked increasing by 2.1%, although productivity growth remained weak. Overall, the data point to resilient economic activity driven by domestic factors despite external headwinds. IBEX 35 -0.36% to 17567, EURUSD 0% to 1.1677, 10y Bono -0.5bp to 3.578%.
Spain’s financing capacity in the 12 months to February was equivalent to 3.9% of GDP, slightly below the 4.2% recorded a year earlier but still close to recent historical highs. The current account surplus was 2.9% of GDP, broadly in line with recent averages, supported by a strong tourism surplus of 4.1% of GDP, while the non-tourism goods and services balance remained slightly negative. The capital account also remained elevated at around 1% of GDP. On the financial side, net inflows were down y/y, reflecting weaker other and direct investment, partly offset by stronger portfolio investment. Overall, the data indicate continued external strength driven by tourism, despite some easing in financial flows.
The U.K. Lloyds Bank Commercial Business Barometer for April showed a deterioration in business sentiment, as the summary indicator slid to 44 from 55 in March (February: 44). Business activity expectations for the next 12 months fell to 54 from 60 (February: 53). Current economic optimism decreased sharply to 33 from 50 (February: 36). Prices charged for the next 12 months edged down to 53 points from 55 (February: 65). The survey of over 1,200 U.K. companies reflects weakening confidence and subdued business outlook in April. We believe the ongoing weakness in U.K. household and corporate expectations will prevent the BoE from taking an overtly hawkish approach to rates. FTSE 100 +0.46% to 10260, GBPUSD +0.06% to 1.3483, 10y gilt -0.9bp to 5.062%.
Switzerland’s KOF economic barometer rose by 2.3 points to 97.9 in April, recovering from the previous month’s fall but remaining below its long-term average, signaling still-subdued economic prospects. The improvement was driven mainly by stronger manufacturing, services and consumer demand indicators, while hospitality weakened and external demand, financial services and construction were broadly unchanged. Within the production sector, most activity indicators improved, particularly inventories of intermediate goods, capacity utilization and assessments of production constraints, although overall business conditions and employment expectations deteriorated. At industry level, outlooks improved in the metals, paper and electrical sectors, while wood, glass and food-related industries showed weaker momentum, pointing to a mixed and still-cautious economic outlook. SMI -0.22% to 13003, EURCHF -0.222% to 0.92225, 10y Swiss GB -0.8bp to 0.442%
Norway’s labor market data for April 2026 showed 62,443 fully unemployed people, corresponding to 2.1% of the labor force, alongside 24,416 partially unemployed people and 13,032 jobseekers in programs. Unemployment remains higher among men (2.3%) than women (1.8%), with notable concentrations in construction, transport and service-related occupations. Regional disparities persist, with higher unemployment rates in Oslo and parts of eastern Norway. At the same time, 52,190 job vacancies were registered, down 10% y/y, indicating softer labor demand. New jobseeker inflows totaled 15,152, with the largest share linked to job losses, highlighting ongoing labor market churn despite relatively moderate headline unemployment levels. OSE +0.54% to 2008, EURNOK +0.297% to 10.9335, 10y NGB +2.5bp to 4.483%.
Poland’s consumer price index rose by 3.2% y/y and 0.6% m/m in April, as inflation picked up again after previously easing. The y/y increase was driven largely by higher energy-related costs, with electricity, gas and other fuels rising significantly, while transport fuel prices recorded particularly strong y/y gains despite falling m/m. Food and non-alcoholic beverage prices contributed more modestly to overall inflation. The data suggest that energy price dynamics remain the dominant driver of headline inflation, with monthly momentum also firming, pointing to renewed upward pressure on consumer prices in the near term. WIG -0.43% to 128479, EURPLN -0.003% to 4.2587, 10y PGB +7.4bp to 5.849%
Hungary recorded an external trade in goods surplus of €924mn in March, narrowing by €773mn y/y as export volumes declined by 8.6% while import volumes rose by 1.1%. Despite weaker volumes, export and import values rose as higher prices, particularly in exports, led to improved terms of trade. The contraction in exports was driven mainly by machinery, transport equipment and manufactured goods, while imports were supported by strong growth in machinery categories. Trade with EU partners remained relatively resilient, but performance with non-EU countries deteriorated significantly. Over Q1, export volumes fell and imports increased; this resulted in a smaller surplus, highlighting weakening external demand conditions. Budapest SI +0.95% to 133897, EURHUF +0.11% to 366.11, 10y HGB -4bp to 6.03%
Hungarian GDP grew by 1.7% y/y and 0.8% q/q in Q1, indicating a moderate expansion in economic activity. Growth was primarily driven by the services sector, particularly professional, scientific, technical and administrative activities, while industry also contributed positively after a prolonged period of weakness. The data suggest a broad-based recovery with both domestic activity and industrial output improving, although the overall pace of growth remains relatively modest compared with earlier cycles. MNB Governor Mihály Varga also warned overnight that the market should not be “too bullish” on HUF after its recent strong run linked to the Hungarian election.
Czech Q1 GDP increased by 0.2% q/q and 2.1% y/y, reflecting modest sequential growth alongside firmer annual expansion. The q/q increase was primarily driven by higher gross capital formation, while net exports acted as a drag on growth. On a y/y basis, expansion was supported entirely by domestic demand, notably household consumption and fixed investment, with external trade again contributing negatively. From a production perspective, services activity provided the main positive impulse q/q, whereas industry weighed on growth. However, industry and trade-related sectors contributed significantly to y/y value added gains. Labor market conditions remained stable, with employment unchanged q/q but rising by 0.7% y/y. Prague SE -1.48% to 2554, EURCZK -0.021% to 24.376, 10y CZGB +5.3bp to 4.956%.
South Africa’s producer price index for final manufactured goods increased by 2.3% y/y in March, up from 1.8% in February, while rising by 1.1% m/m. This signals a pickup in producer price inflation. The y/y increase was driven mainly by food, beverages and tobacco along with strong gains in furniture and other manufacturing, while m/m momentum was supported by petroleum and chemical products. Upstream pressures were more pronounced, with intermediate goods inflation accelerating to 9.1% and mining prices surging by 33.0% y/y, reflecting strong increases in metal ores. Electricity and water prices also rose sharply, while agricultural prices remained in decline, highlighting divergent price dynamics across sectors. JSE TOP 40 +0.86% to 106908, USDZAR -0.06% to 16.8206, 10y SAGB +5.4bp to 9.05%.
Japanese industrial production declined by 0.5% m/m but rose 2.3% y/y in March (previous month: +3.3% m/m forecast) vs. -2.0% m/m, 0.4% y/y in February. Shipments fell by 1.1% m/m (+2.0% y/y) and inventories by 1.5% m/m (-4.9% y/y). Key sectors that saw lower production included inorganic and organic chemicals, general-purpose machinery and petroleum products, while transport equipment and electronic parts contributed to increases. The inventory ratio decreased by 0.4% m/m (-5.3% y/y). Production is expected to rise by 2.1% m/m in April and 2.2% in May, driven by machinery, electronic parts and transport equipment. Elsewhere, Japanese retail sales rose 1.3% m/m, 1.7% y/y in March vs. -2.0% m/m, -0.2% y/y in February. Wholesale sales fell 0.6% m/m, 3.7% y/y in March vs. -0.9% m/m, 1.6% y/y in February. The breakdown shows the biggest rise in fuel, at 8.2% m/m, followed by motor vehicles (+3% m/m) and machinery (+1.3% m/m). Nikkei -1.06% to 59285, USDJPY -0.455% to 160.49, 10y JGB +4.6bp to 2.523%.
Japan’s consumer confidence index fell to 32.2 points in April, down 1.1 points from the previous month, indicating a deterioration in household sentiment. This was driven by weaker perceptions of overall livelihood and a sharp drop in willingness to purchase durable goods, while employment expectations edged slightly lower and income growth remained unchanged. Overall, the data suggest continued caution among consumers, particularly regarding discretionary spending. At the same time, inflation expectations strengthened, with 93.6% of respondents anticipating higher prices over the next year, which reinforces concerns about rising living costs. This combination of weakening confidence and elevated price expectations points to a challenging environment for household consumption going forward.
Japanese new housing starts for March totaled 63,495 units, down 29.3% y/y in a fifth consecutive m/m fall. Seasonally adjusted annualized starts fell 1.9% m/m, continuing a three-month downward trend. By type, owner-occupied homes decreased by 27.4% y/y, rental housing by 35.2% y/y and condominiums by 21.7% y/y. By region, all areas saw significant declines, with the largest in “other regions” (-39.3% y/y) and the smallest in the Tokyo metropolitan area (-19.1% y/y). Prefabricated and two-by-four construction methods also decreased by 4.7% and 28.4% y/y, respectively.
Australia’s export price index for Q1 rose 0.5% q/q but fell 1.9% y/y, while the import price index increased by 0.1% q/q and fell by 0.3% y/y. Export price gains were driven by strong increases in gold, coal and fertilizers, reflecting safe haven demand and supply disruptions, although falls in iron ore and gas prices offset these gains. Import prices were supported by higher petroleum and precious metal costs amid geopolitical tensions, but declines in machinery and vehicles limited overall growth. On a y/y basis, falling commodity prices, particularly metals and gas, weighed on export prices, while lower telecommunications equipment prices drove the downward trend in import prices. ASX +0.43% to 5501, AUDUSD +0.169% to 0.7128, 10y ACGB +7bp to 5.064%
The Reserve Bank of New Zealand (RBNZ) has announced enhanced transparency changes to the Monetary Policy Committee (MPC) Charter. The updated charter allows individual MPC members to publicly communicate their views and attributes votes and material differences of opinion in the Record of Meeting, even when consensus is reached. RBNZ Governor Anna Breman emphasized that these changes align the RBNZ with the most transparent central banks globally, improving accountability and public understanding of monetary policy decisions. The new charter will take effect from the May 2026 Monetary Policy Statement, with a 12-month review planned to assess its impact. NZX 50 +1.04% to 12903, NZDUSD -0.41% to 0.5837, 10y NZGB +3.4bp to 4.736%.
New Zealand’s ANZ Business Outlook for April 2026 showed a sharp deterioration in sentiment, with business confidence falling to -10.6 from 32.5 in March, while expected own activity also declined significantly to 19.6. The weakening was broad-based across sectors, with export, investment, employment and profit expectations all deteriorating and employment intentions turning negative for the first time since mid-2024. At the same time, inflation pressures intensified, with cost expectations and one-year-ahead inflation expectations rising substantially, although pricing intentions eased slightly. Overall, the survey points to a more pessimistic business outlook amid rising cost pressures and uncertainty, with firms facing potential margin compression and delaying hiring and investment decisions.
China’s manufacturing PMI for April came in at 50.3 points vs 50.4 in March. The three key subcomponents were all in the expansion zone, with new orders easing to 50.6 (March: 51.6) but higher new export orders at 50.3 (March: 49.1) and imports at 50.1 (March: 49.8) Production and new orders remained above 50, driven by sectors such as railway, aerospace and electronics, while energy and chemical industries lagged. High-tech and equipment manufacturing PMIs rose slightly, while high-energy-consuming industries declined. Input (63.7) and output (55.1) prices remained elevated due to commodity price volatility. PMI non-manufacturing activity fell to contraction at 49.4 from 50.1 in March, with services business activities back into contraction at 49.6 after a brief month expansion in March (50.2); construction business activities set a fresh low of 48. CSI 300 -0.04% to 4808, USDCNY +0.069% to 6.8357, 10y CGB +0.3bp to 1.75%.
RatingDog China’s private sector manufacturing PMI rose to 52.2 in April from 50.8, marking the strongest expansion in operating conditions since December 2020 and signaling a sustained recovery in the sector. Output growth accelerated to its fastest pace in nearly two years, supported by robust domestic demand, rising new orders and modest gains in export orders. Business sentiment improved, with firms expecting further growth driven by demand, innovation and supportive policies. However, employment remained broadly flat, indicating a lag in labor market recovery. At the same time, inflationary pressures intensified, with input costs rising sharply due to higher raw material and energy prices, prompting firms to increase output prices and raising concerns about cost-driven pressures despite strengthening activity.
South Korea’s March 2026 all-industry production was up 0.3% m/m and 3.5% y/y vs 2.1% m/m, 0.1% y/y in February 2026. Industrial production up 0.3% m/m, 3.6% y/y (February: 5.3% m/m, -2.3% y/y), within which manufacturing production rose 0.3% m/m and 4.0% y/y (February: 6.0% m/m, -2% y/y). Manufacturing shipments increased by 1.0% m/m and 3.2% y/y, while manufacturing inventory shrank by 4.3% m/m and 1.3% y/y. The capacity utilization rate improved by 0.5% m/m and 3.0% y/y, reaching 74.8%. The services index rose 1.4% m/m and 5.1% y/y. Retail sales climbed 1.8% m/m and 5.0% y/y. Equipment investment increased by 1.5% m/m and 9.2% y/y. Construction completed fell 7.3% m/m and 5.4% y/y, while construction orders surged 30.3% y/y. South Korea’s growth momentum remains intact, with the cyclical leading index rising 0.7% m/m, in the biggest monthly gain since June 2009. The cyclical leading index is up 4.02% y/y, pointing to further upside GDP growth momentum from Q1’s 3.63%. KOSPI -1.38% to 6599, USDKRW +0.358% to 1483.4, 10y KTB -2.3bp to 3.842%
Singapore’s labor market remained resilient in Q1, with total employment increasing by 5,000 in an 18th consecutive quarter of expansion, although growth slowed from the previous quarter’s pace. Employment gains were driven by resident hiring in transportation and administrative services and by continued non-resident growth in construction, albeit at a more moderate rate. Unemployment edged slightly higher to 2.1% overall but remained broadly stable, while retrenchments stayed low and unchanged, indicating limited labor market stress. Despite this resilience, forward-looking indicators point to increasing caution, with fewer firms expecting to hire or raise wages amid geopolitical uncertainty, suggesting a more measured pace of labor demand and potential softening ahead if external conditions deteriorate. STI +0.84% to 4902, USDSGD -0.18% to 1.279, 10y SGB -2.9bp to 2.114%.
Taiwan’s real GDP was up 13.69% y/y in Q1 vs. 12.65% y/y in Q4 2025, beating the February forecast of 11.46%. On a q/q seasonally adjusted annualized basis, GDP rose 11.86% q/q vs. 23.55% in Q4 2025. Strong export growth, driven by AI, high-performance computing and cloud infrastructure, boosted goods and services exports by 35.25% y/y. Imports increased by 27.07% y/y, supported by robust demand for raw materials and capital equipment. Domestic demand grew 4.83%, led by private consumption (+4.89%) and capital formation (+5.20%). Net external demand contributed 9.62 percentage points to GDP growth. TAIEX -0.96% to 38927, USDTWD -0.389% to 31.68, 10y TGB +0.8bp to 1.51%.
Thailand’s manufacturing production index rose by 0.75% y/y in March, exceeding expectations of a 1.0% contraction and improving from a revised 0.09% increase in February. The expansion was supported by stronger output in the petroleum and automotive sectors alongside resilient export performance. The authorities also highlighted stable domestic political conditions, which helped sustain policy continuity and ongoing projects. However, the outlook remains constrained by external and cost pressures, including persistent geopolitical tensions, trade protectionist measures and weakening confidence among trading partners. Rising energy and freight costs, linked to developments in the Middle East, have pushed up production expenses, while heightened competition from imported goods continues to weigh on domestic manufacturers. SET -0.49% to 1484, USDTHB -0.062% to 32.71, 10y TGN 0bp to 2.143%.
Thai merchandise exports rose 19.3% y/y to $34.7bn in March, up 18.4% m/m (February: +10.6% y/y, -5.5% m/m). This trend was driven by electronics (notably to the U.S. and Malaysia), petroleum products (to ASEAN), iron and steel (to the U.S., Europe and ASEAN) and gems and jewelry (to India). Automotive exports shrank, especially passenger cars bound for the Middle East. Imports increased by 37.2% y/y and 21.3% m/m, led by raw materials and electronic parts from Taiwan and fuel imports from the UAE, Malaysia and the U.S. The trade deficit was $146.2mn (February: $584mn surplus).
The Philippines’ total external trade reached $20.85bn in March, climbing 15.3% y/y to its highest figure since 1991 (March 2025: $18.07bn). The trade deficit increased slightly to $4.51bn. Exports rose 20.4% y/y to $8.17bn, led by electronic products ($4.82bn), machinery and gold. The U.S. was the top export destination ($1.40bn, 24.2% y/y), followed by Hong Kong ($1.3bn, +28.7% y/y) and Japan ($962mn, -0.6% y/y). Imports grew 12.3% y/y to $12.68bn, mainly attributable to electronic products and mineral fuels. Mineral fuels imports rose by 35.1% y/y and raw materials by 11.7% y/y. China was the largest country of origin of imports ($3.50bn). Both exports and imports recorded their highest values since 1991. PSEi -1.26% to 5834, USDPHP +0.134% to 61.49, 10y PHGB +7.3bp to 6.839%.
The Philippines’ Producer Price Index (PPI) for manufacturing rose by 2.5% y/y in March, accelerating from 1.4% in February and 0.8% in March 2025. The main driver was the manufacture of coke and refined petroleum products, which increased by 8.7% y/y (from 3.6% in February), contributing 49.4% of overall growth. Other key contributors included computer, electronic and optical products (+5.3% y/y) and basic metals (+4.3% y/y). On a m/m basis, PPI for manufacturing increased by 0.9% in March 2026, reversing a 0.1% decline in February, led by a 4.7% m/m rise in coke and refined petroleum products. The food manufacturing PPI grew 0.7% y/y in March 2026, slowing from 0.9% in February, mainly due to a fall in the vegetable and animal oils and fats category.
Brazil’s Copom has reduced its Selic rate to 14.50% p.a., as global uncertainty from Middle East conflicts affects financial conditions and commodity prices. Domestic indicators show softer economic growth with resilient labor market signals. Inflation and underlying measures have risen, moving further from the target. Inflation expectations for 2026 and 2027 remain above-target at 4.9% and 4.0%, respectively, with Copom projecting 3.5% for late 2027. The BCB sees 2026 CPI at 4.6% (vs. 3.9% in March). The risks to inflation are high, given the geopolitical uncertainty, potential supply constraints and currency depreciation, balanced by downside risks from an economic slowdown and lower commodity prices. The committee said it “reaffirms serenity and cautiousness in the conduction of monetary policy, so that future steps of interest rate calibration can incorporate new information about the depth and duration of the conflicts in the Middle East, as well as their direct and indirect effects over time on the price level.” IBOVESPA -2.05% to 184750, USDBRL -0.455% to 4.9967, 10y BGB +21.3bp to 14.018%.