Uneven recovery across conflict-risk assets
iFlow > Investor Trends
Investor Trends provides a deep dive into patterns and behaviors in equity, bond and currency markets around the globe, underpinned with deeper macro insights.
iFlow > Investor Trends
Investor Trends provides a deep dive into patterns and behaviors in equity, bond and currency markets around the globe, underpinned with deeper macro insights.

Geoff Yu
Time to Read: 5 minutes
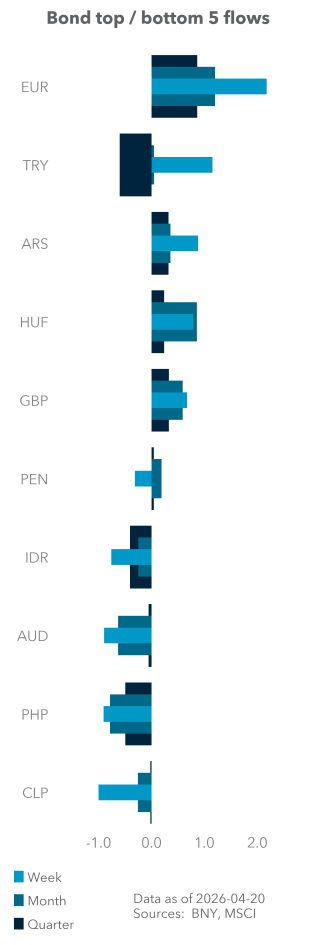
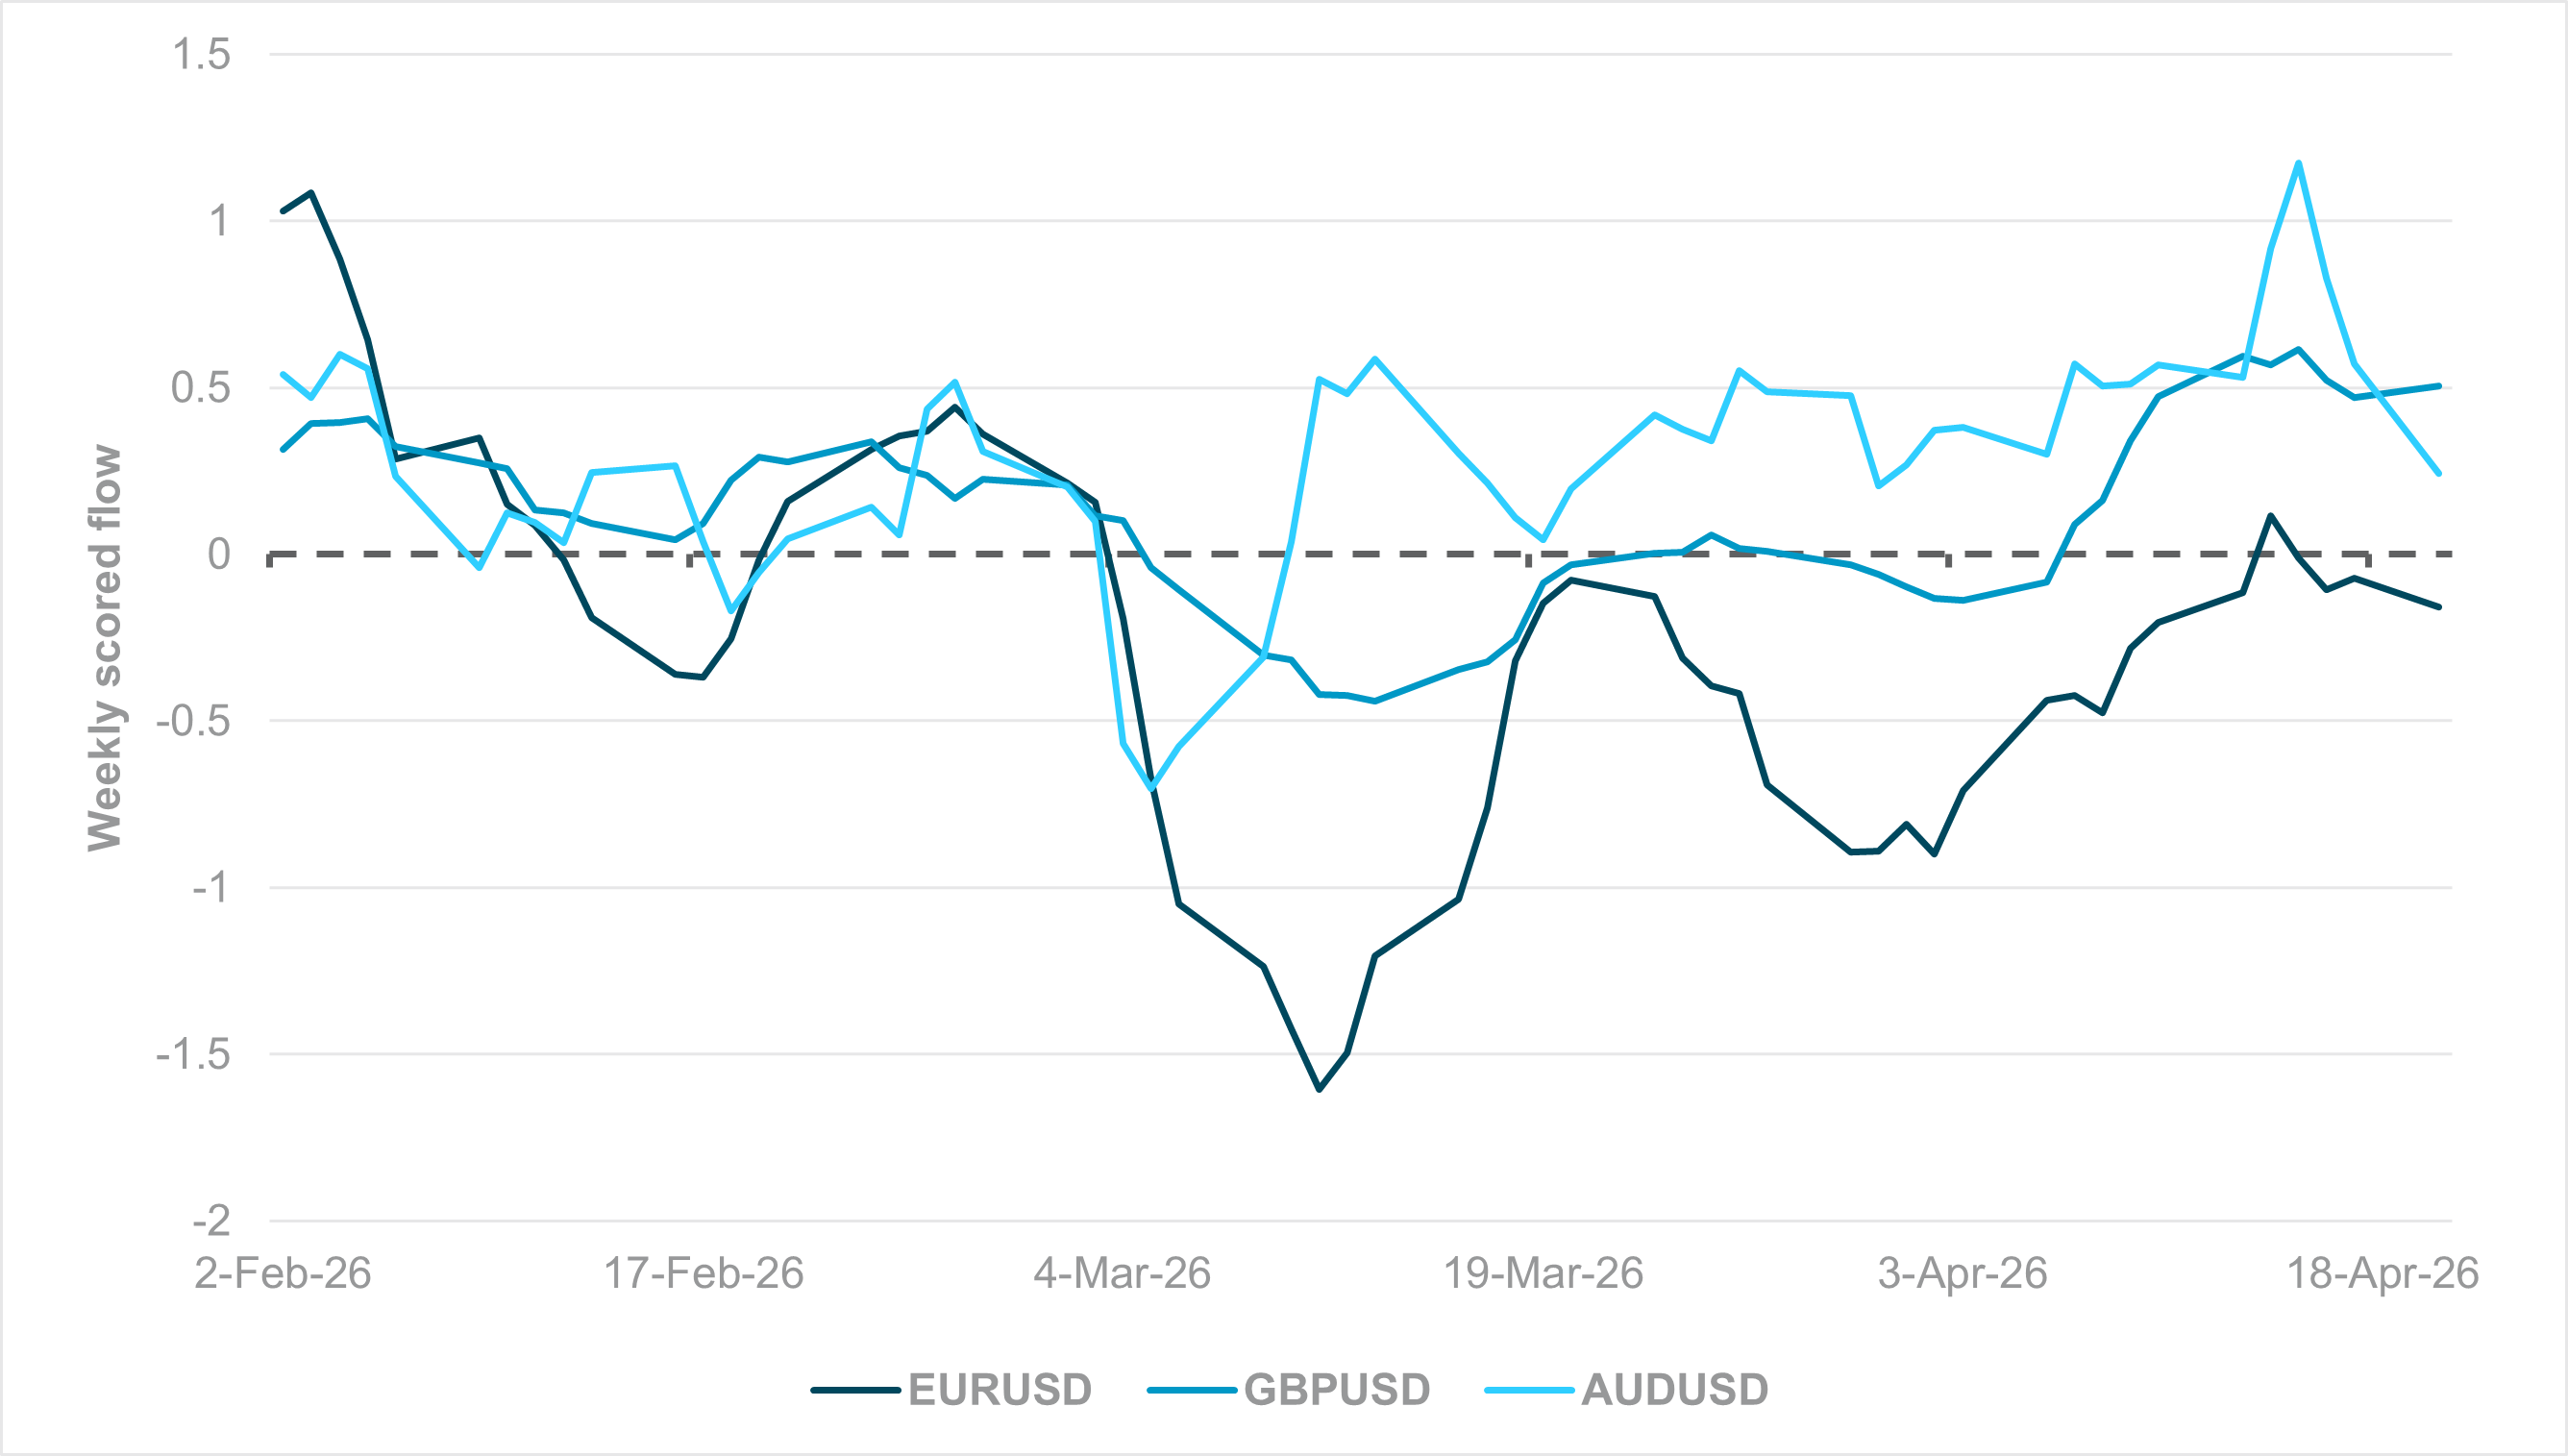
EXHIBIT #1: WEEKLY SCORED FLOWS IN EURUSD, GBPUSD AND AUDUSD
Source: BNY, Bloomberg
Our take
As risk sentiment slowly recovers, clearer signs of dollar selling are emerging, though it is still too early to state that the “hedge the U.S.” trade – which prevailed before the conflict – is resuming. The development of rate expectations is likely limiting further USD purchases, but caution is needed, especially as real rates elsewhere hold firm. Furthermore, we are observing clear differences in the dollar’s performance against various potential reserve names. The turnaround in EURUSD, GBPUSD and AUDUSD has been uneven after the initial purchase wave of the dollar through the first week of March, and does not match potential rate paths. EURUSD has faced the biggest struggle, even though the ECB is the most likely to hike among the majors. GBP and AUD are performing well, even though fundamentals between the U.K. and Australia differ markedly.
Forward look
AUDUSD’s strong performance is understandable. Of all the pairs we track, it has performed best by some distance (0.4x average vs. 0.25x for GBPUSD, the next best-bought pair), reflecting the Reserve Bank of Australia’s (RBA) stance and AUD’s terms-of-trade gains, given Australia’s significant energy exports. The RBA’s hawkishness is a factor, and we continue to see the AUD as attractively valued.
GBPUSD’s strong performance relative to EURUSD may not conform to fundamentals, as the U.K. economy is similarly prone to stagflation. However, we continue to see the significant gap between the Bank of England (BoE) and the European Central Bank’s (ECB) current policy stance as a rare case of policy optimality in limiting tightening. Even the BoE’s relatively hawkish members have highlighted the U.K. economy’s weak position as having a dampening impact on second-round effects, though as recently as Tuesday, outgoing ECB Vice President Luis de Guindos – who is not considered strongly hawkish – stated that monetary policy “can prevent second-round effects.”
We remain of the view that any Western European central bank that tightens early could do more harm than good to its own economy. Fiscal support is currently extremely targeted and private sector sentiment is weak, so there is no prospect of a strong demand push that could exacerbate both primary and second-round inflation risk. We continue to see Eurozone assets underperforming until the ECB corrects its course.
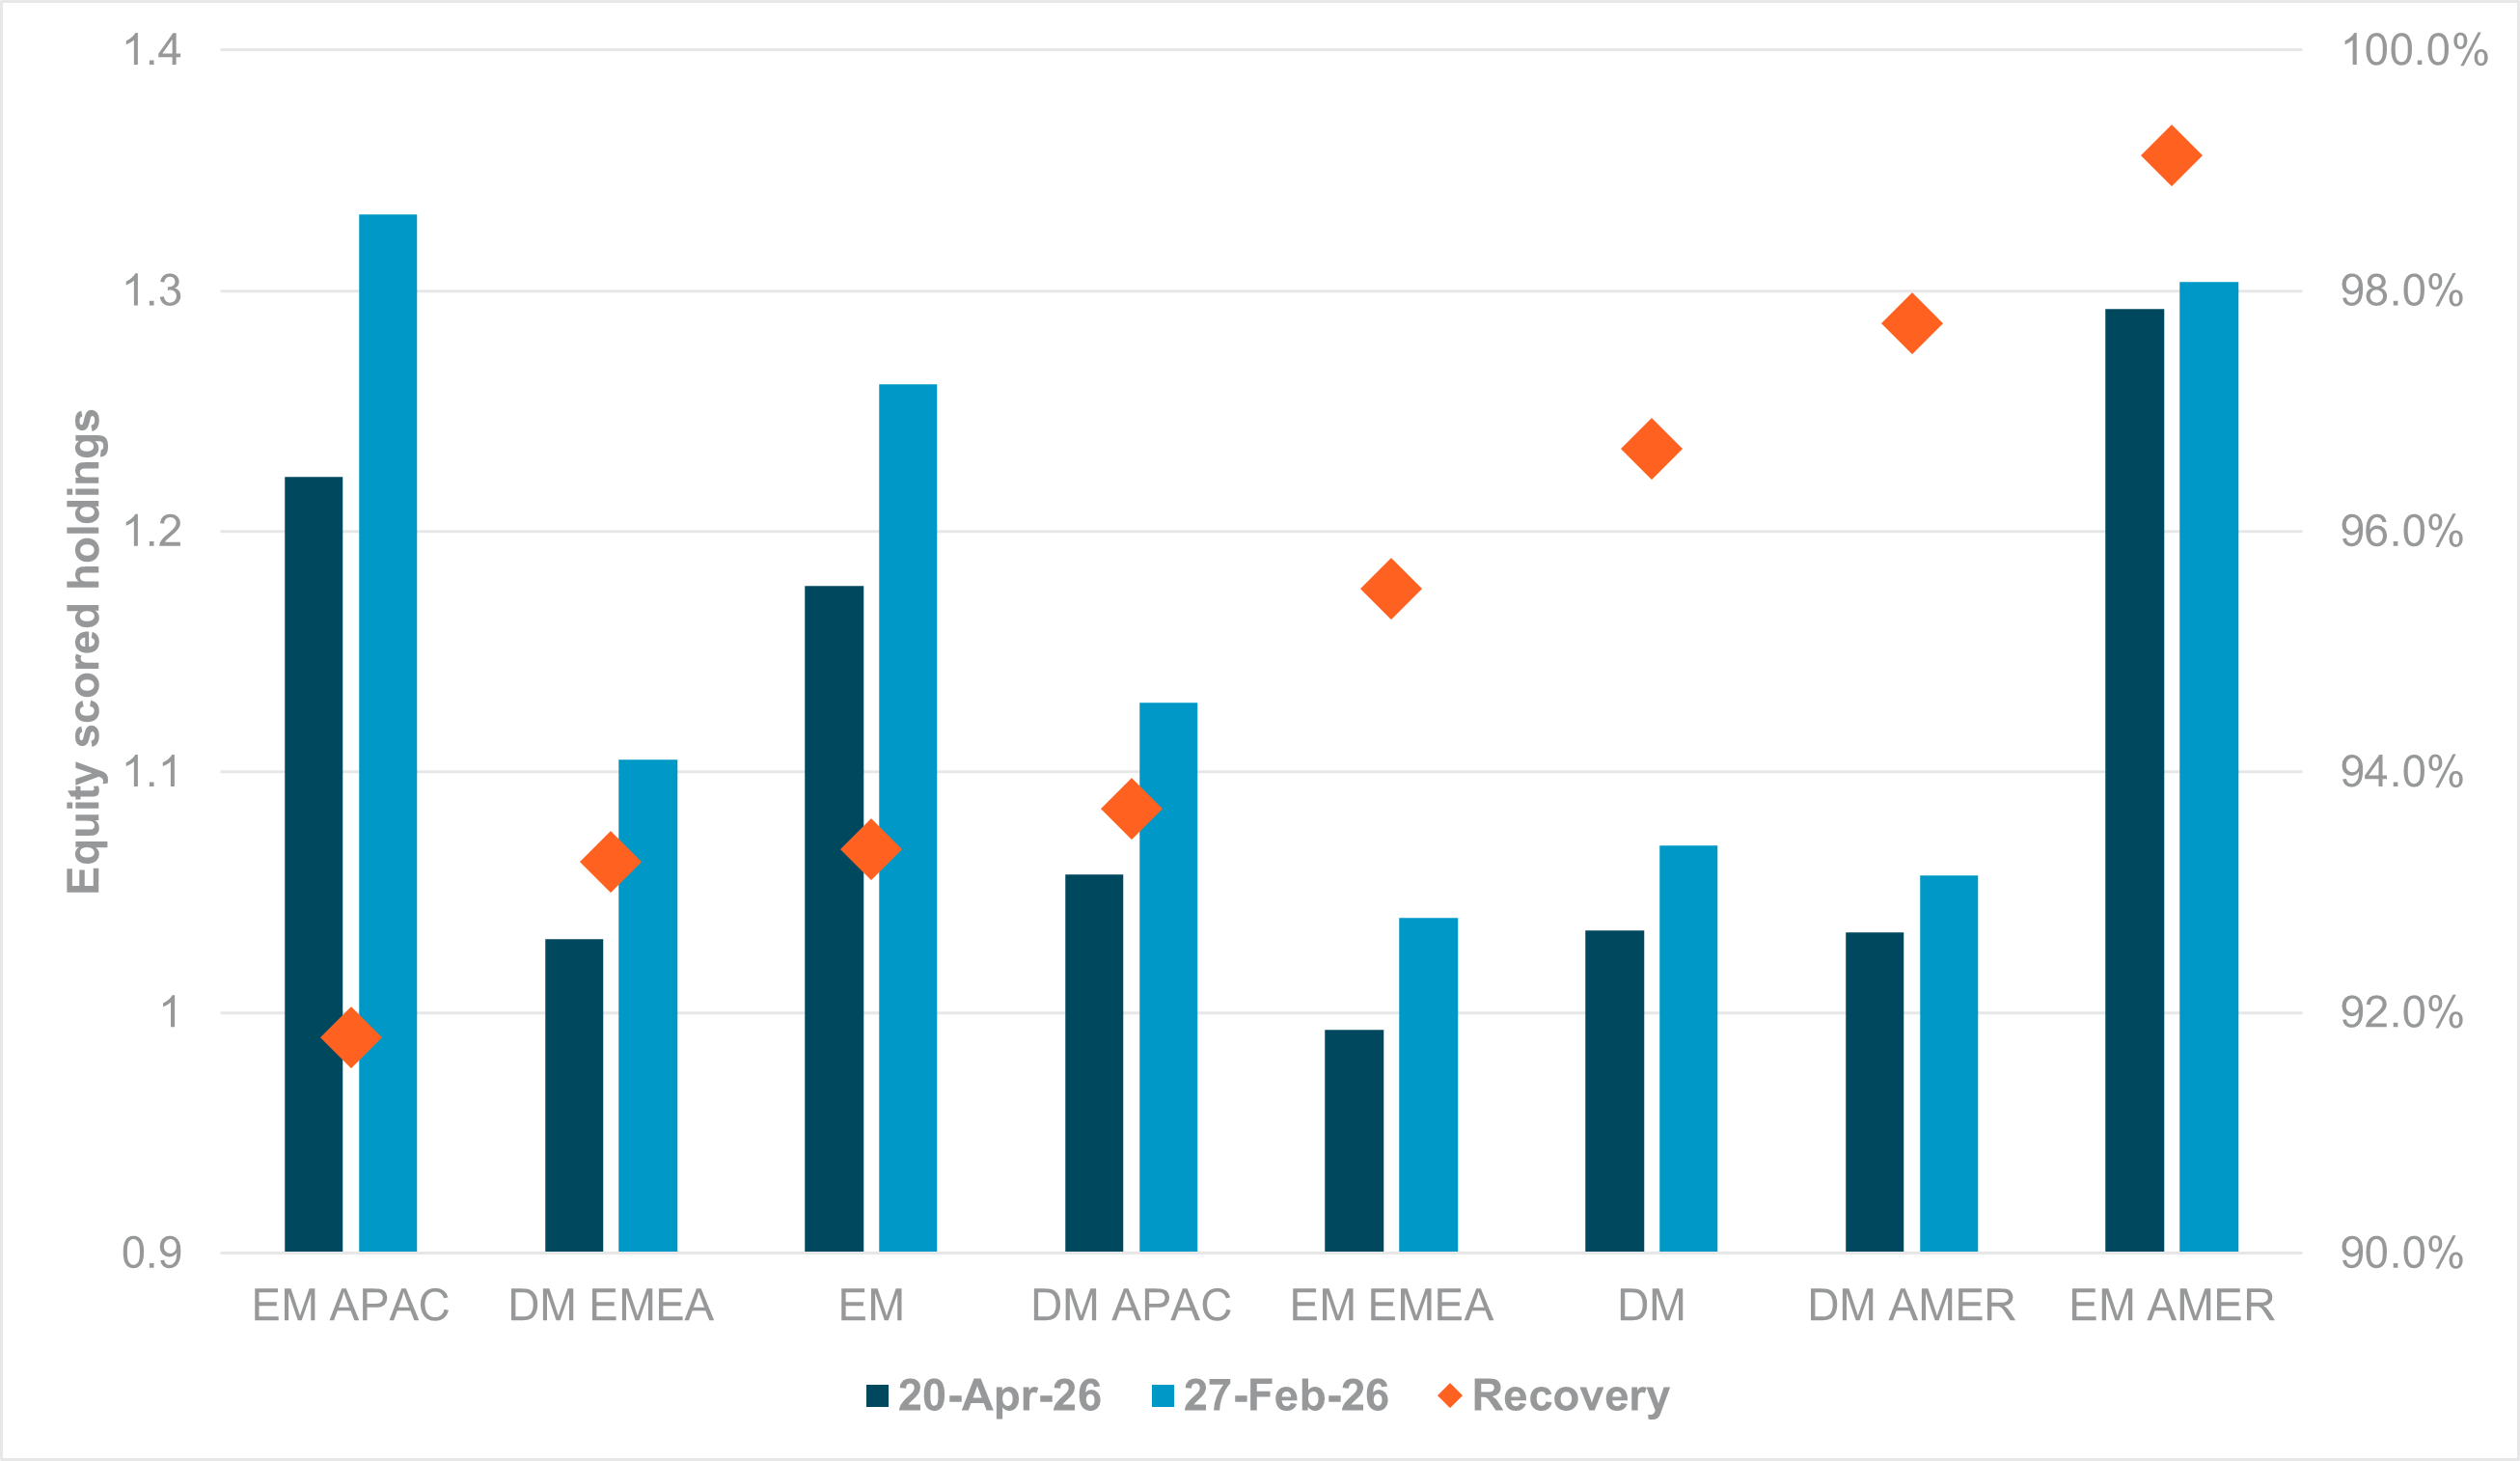
EXHIBIT #2: REGIONAL EQUITY HOLDINGS IN ABSOLUTE TERMS AND % OF PRE-CONFLICT HOLDINGS
Source: BNY
Our take
Equity market levels may have rebounded strongly globally, but there is a major difference between the price gains and the level of cash holdings by institutional investors. Based on the latter criterion, all regions have yet to recover their holdings from pre-conflict levels. This supports the view, given our custody client bias, that retail investors continue to drive flow interest, whereas institutional investors will require far greater certainty regarding a durable ceasefire.
Measured by the “recovery rate,” EM Americas are closest to hitting pre-conflict highs, but there wasn’t much movement in the first place. The performance is similar to what we have observed in the region’s FX and fixed income markets (see next section). High absolute holdings and limited drawdowns underscore the region’s relative insulation from the conflict, and some commodity producers may even benefit significantly from a terms-of-trade shock. Developed markets (DM) have recovered well, led by strong performance in the U.S. market.
EM APAC, led by Korean and Taiwanese equities, is the outlier among all regions. As these markets were the extreme outliers in performance before the conflict, the risk of a large correction was always high, along with the amount of price and flow improvement to recover to pre-conflict levels. At 92%, the region has the worst recovery rate. Despite this, absolute performance remains strong at over 20% above the rolling 12-month average. We suspect institutional investors will not be in a rush to add to what has always been a crowded position.
Forward look
Institutional investors may be on the sidelines due to geopolitical views rather than earnings outcomes, but there is a real risk that these managers fall meaningfully below benchmark and are “stopped in.” This means that there is significant cash on the sidelines that can fuel another risk rally, but the bar for more “good news” on the conflict is high. Much will depend on how quickly oil and refined products’ prices normalize. This would limit disruption and help margin expectations recover to pre-crisis levels.
Meanwhile, there is significant concentration risk in EM Americas and EM APAC, so performance surprises could arise from DM, especially EMEA, where fears over a repeat of 2022 continue to impact asset allocation in the region.
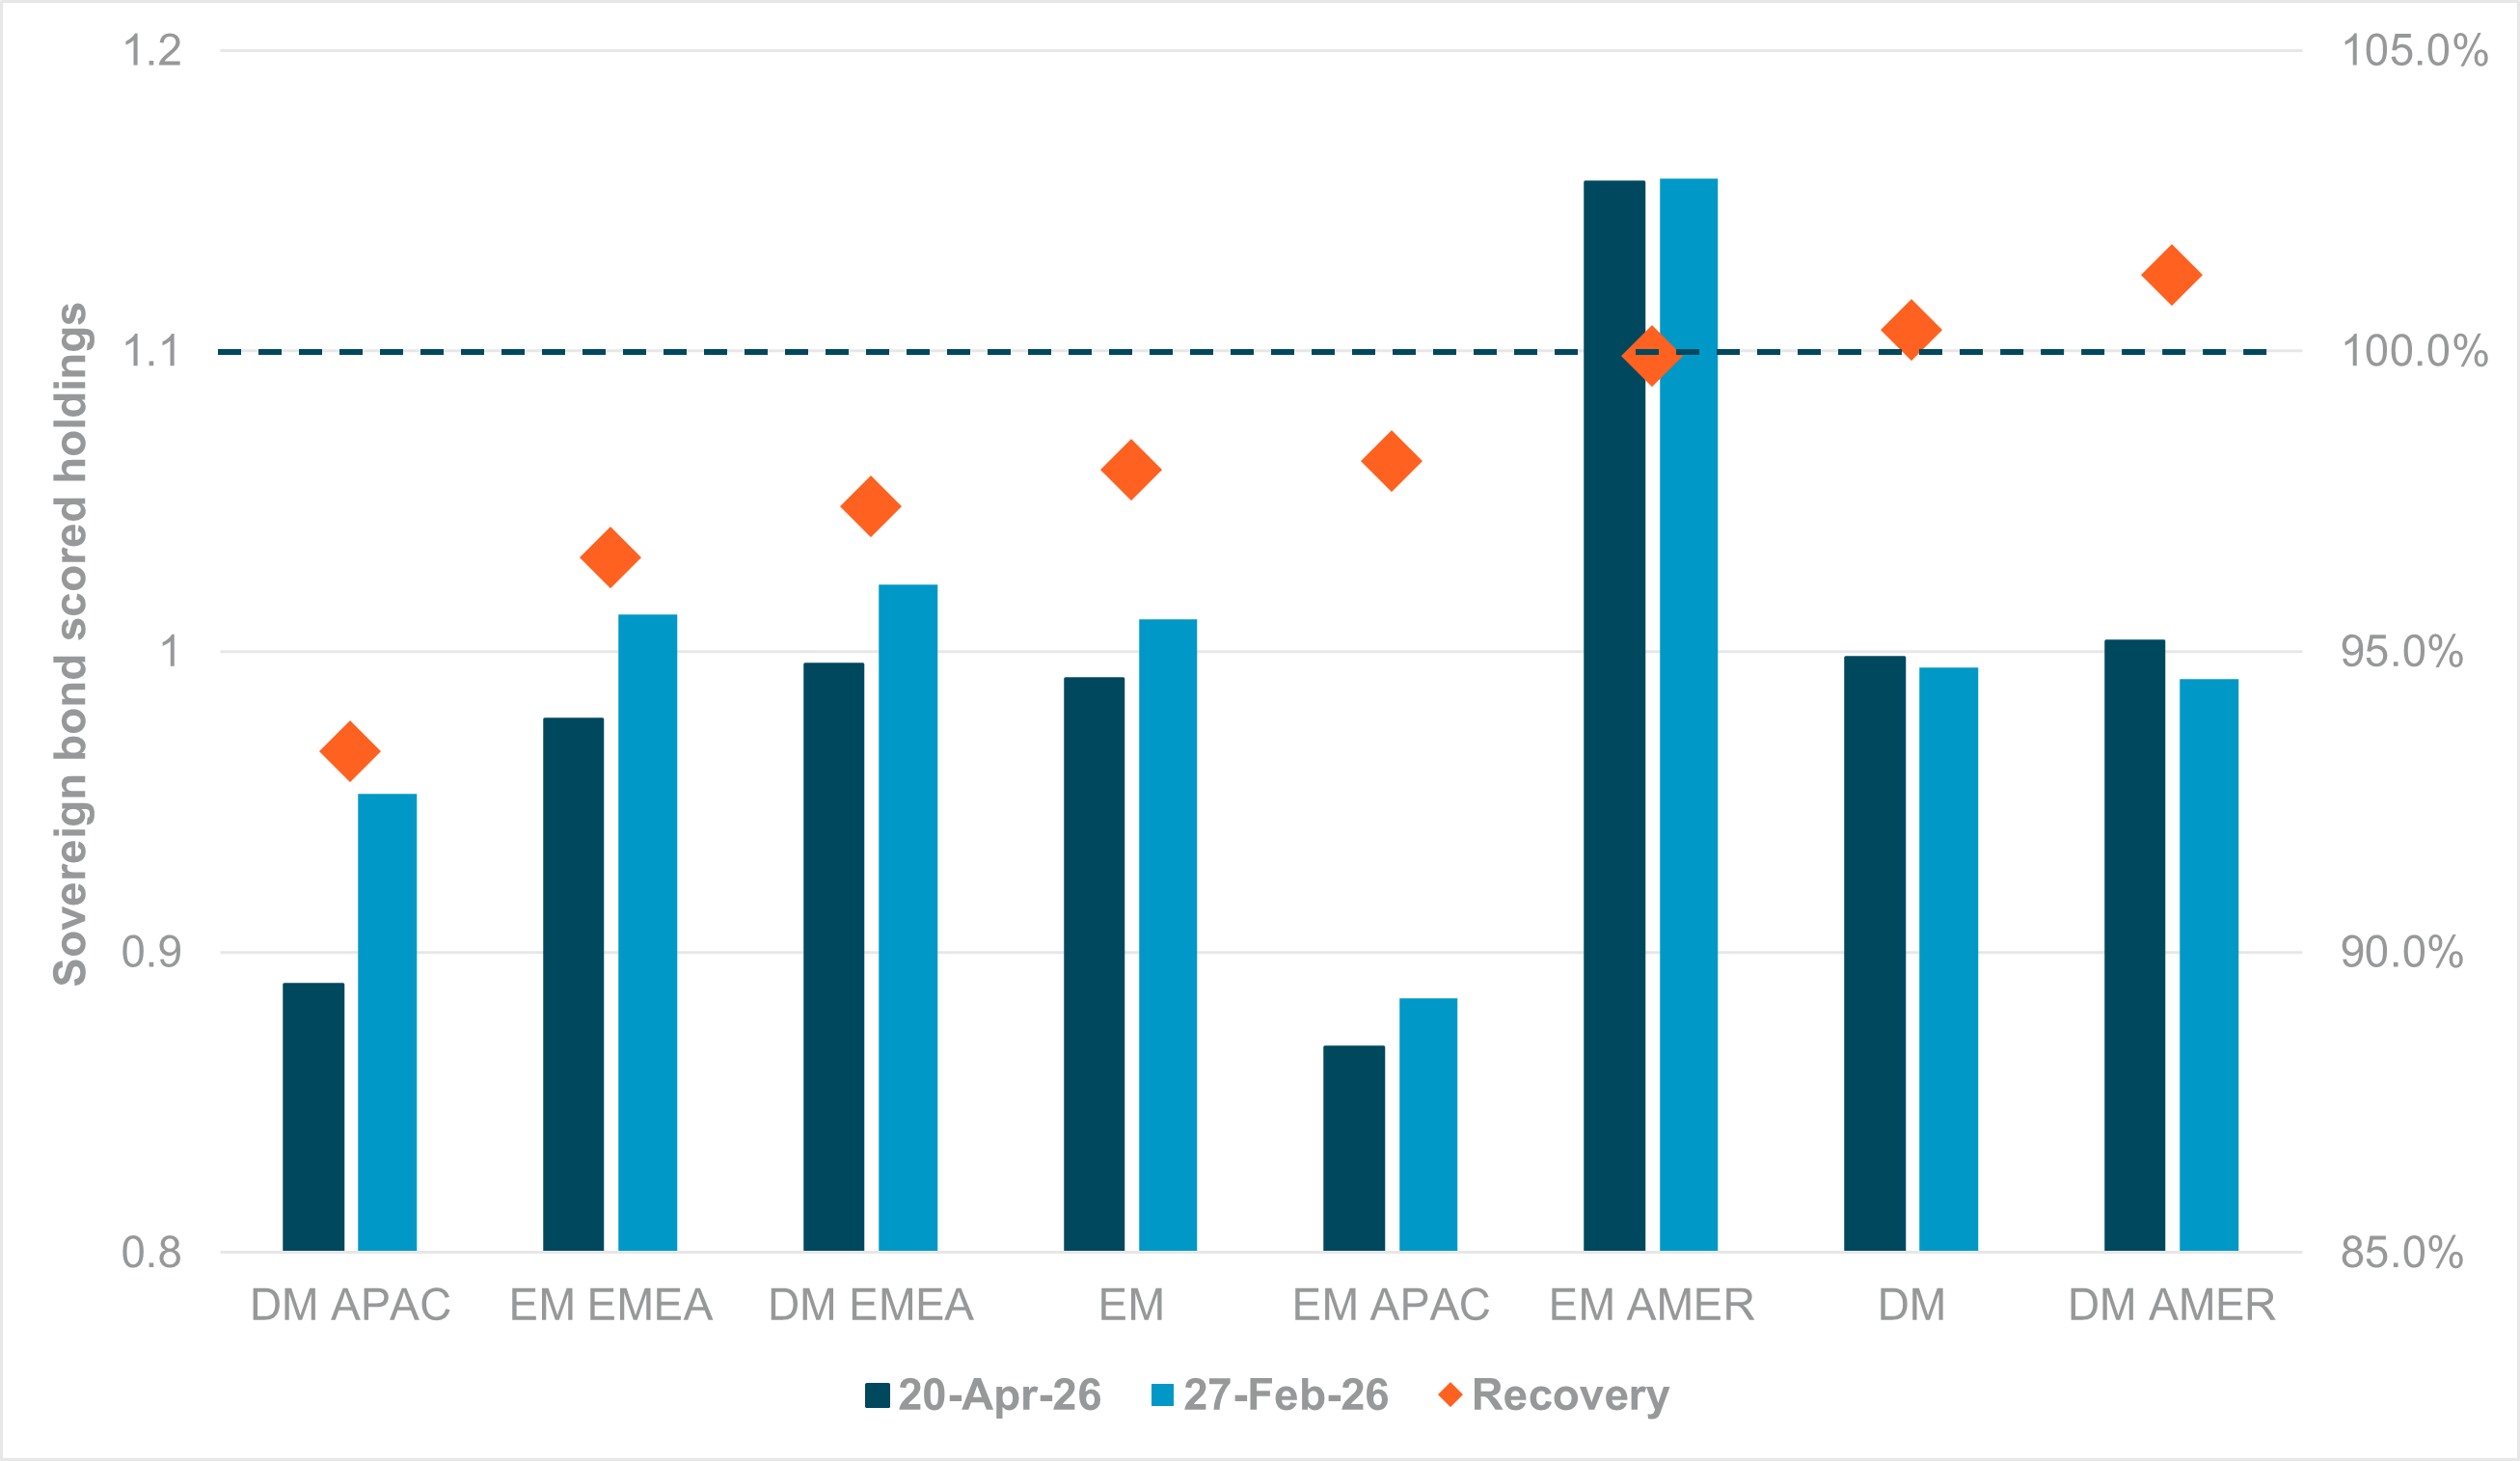
EXHIBIT #3: CURRENT REGIONAL SOVEREIGN BOND HOLDINGS, IN ABSOLUTE TERMS AND % OF PRE-CONFLICT HOLDINGS
Source: BNY
Our take
Fixed income dynamics are very different compared to equities. Despite the scale of steepening seen across DM curves, the holdings declines have been generally manageable. Thanks to a strong performance in the U.S. Treasury (UST) market, DM in aggregate are now better-held compared to pre-conflict levels, driven by anchoring flows from U.S.-based investors. Meanwhile, EM Americas have also emulated performance in the region’s currencies by maintaining the strongest level of holdings in absolute terms and largely avoiding any major rounds of liquidation. Every Latin American currency we track remains comfortably overheld.
While UST has clearly shown its worth as the world’s primary reserve asset, EM Americas is also the strongest manifestation of high nominal rates, providing a buffer to offset gains in inflation expectations. The region has also benefited from a potential terms-of-trade shock, which tends to be supportive of duration.
In contrast, DM and EM APAC are the clear outliers. DM has suffered most – led by the JGB market – in facing inflation-driven steepening. For EM APAC bonds, the challenges are similar, but the region was already very poorly held heading into the conflict, so there wasn’t much scope for additional positioning reduction. The high “recovery rate” masks a lack of asset allocation interest in the first place.
Forward look
In the near term, we expect Americas’ outperformance to continue. Even if there is a more durable resolution to the conflict, USTs may surge further as the current account surplus flows for GCC petro-exporters and North Asian goods exporters (via lower import costs) would flow back into Treasurys, complementing strong domestic interest. For Europe and non-commodity EM, the supply issues will take longer to soften the impact on real rates, and full recovery remains some way off.