Second-order risks: the Q2 question for equities
iFlow > Equities
An in-depth look each Friday at the factors shaping equities markets in developed and emerging economies around the world.
iFlow > Equities
An in-depth look each Friday at the factors shaping equities markets in developed and emerging economies around the world.

Bob Savage
Time to Read: 7 minutes
As investors set up for Q1 earnings and start Q2 trading, the focus on the war with Iran continues to dominate all discussions. Energy and other global supply chain shocks from the closure of the Strait of Hormuz set up a balancing act between growth and inflation risks for months ahead. While AI investment and reindustrialization in the U.S. and Europe are seen to offset much of the present hit to consumers and other businesses from a price shock, governments are stepping up by cutting excise taxes or increasing subsidies. The simple measurement of oil prices as a risk driver has reached its limit, forcing investors toward second-round effects, where supply chains and inventories hold the key to navigating coming equity market risks.
Sector rotation, equity-to-bond reductions and USD hedging have been notable in March. Where markets head next will be determined by earnings beats and CEO outlooks. Global shocks have historically led to recessions everywhere, though in the last 50 years there have been exceptions for the U.S. – in 1992, 1998 and from 2014 to 2015. The most recent bout of U.S. exceptionalism was post-COVID – where Germany shrank by -0.3% in 2023, and where from 2020 to 2024, Japan contracted 1.3% and China slowed sharply from 8% to 4.8%.
The Q2 question is whether the shock of the Iran war derails the nascent flip to the rest of the world that started in 2025. Growth doesn’t always translate into returns – witness China, with 16% of GDP but just 4% of global market cap, compared to the U.S. at 25% of GDP and 60%. Corporate profitability is the main guidance on stocks, not domestic growth. The macro backdrop will test the skill of companies as they navigate the global supply chain shock.
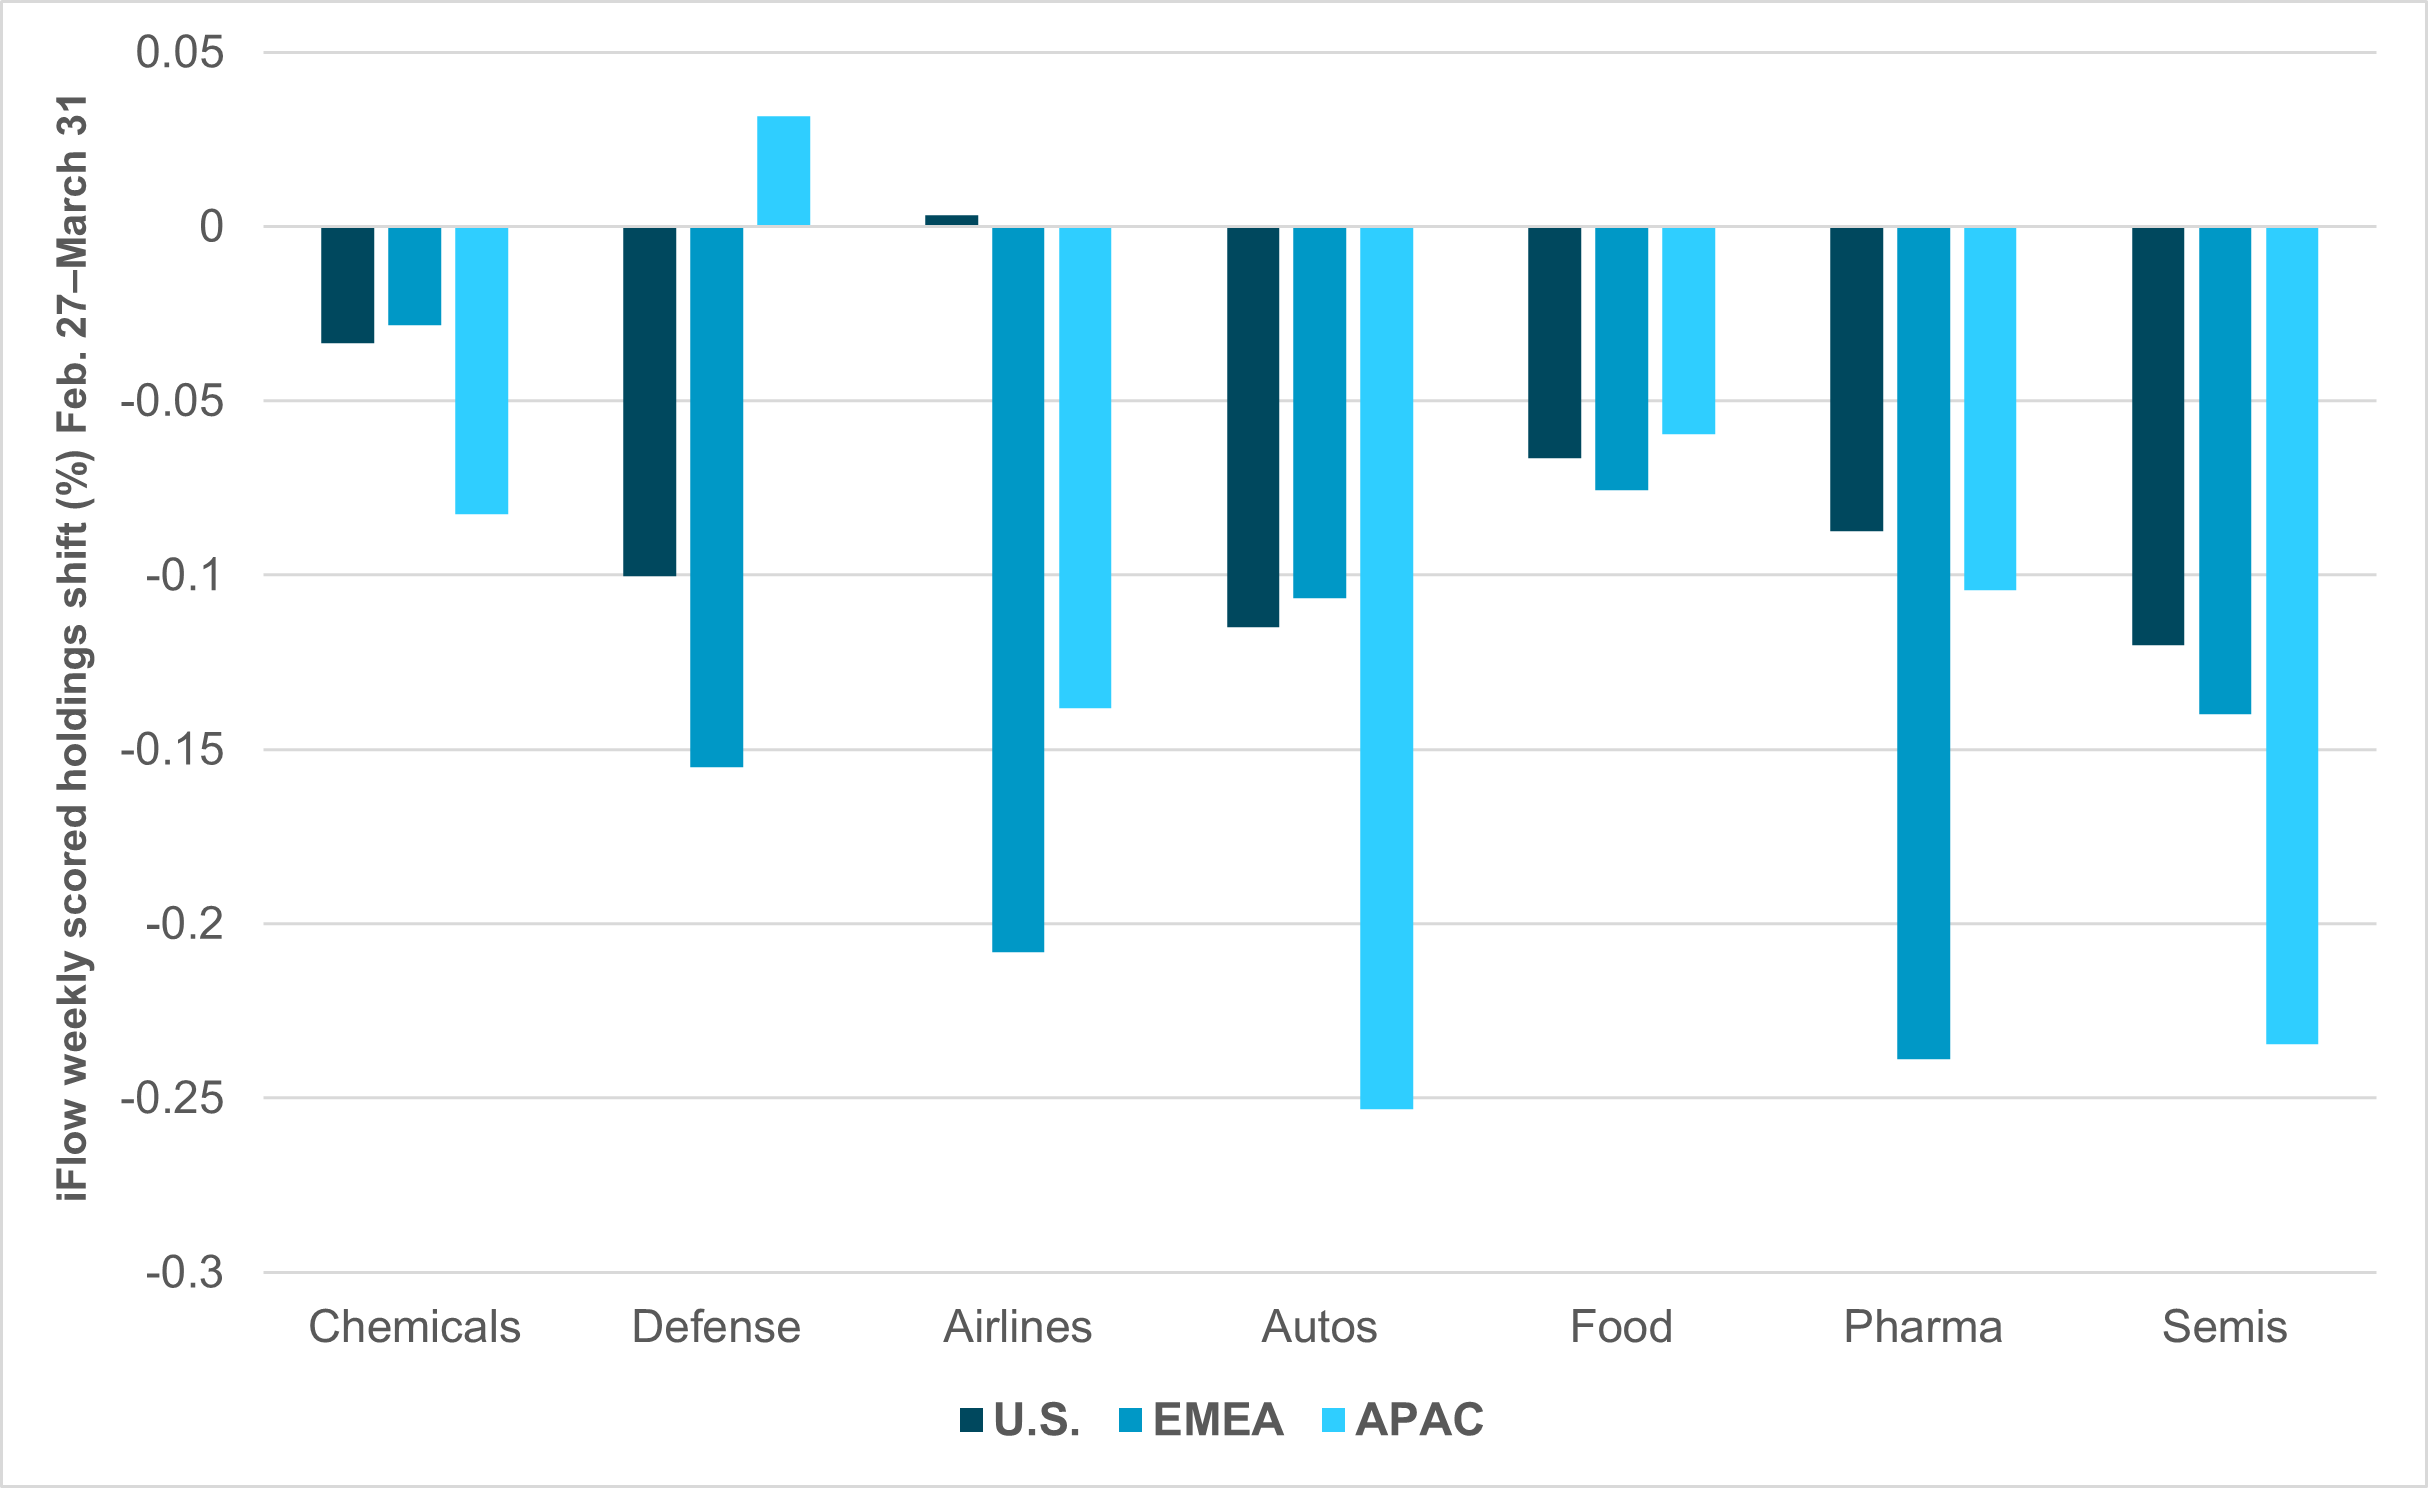
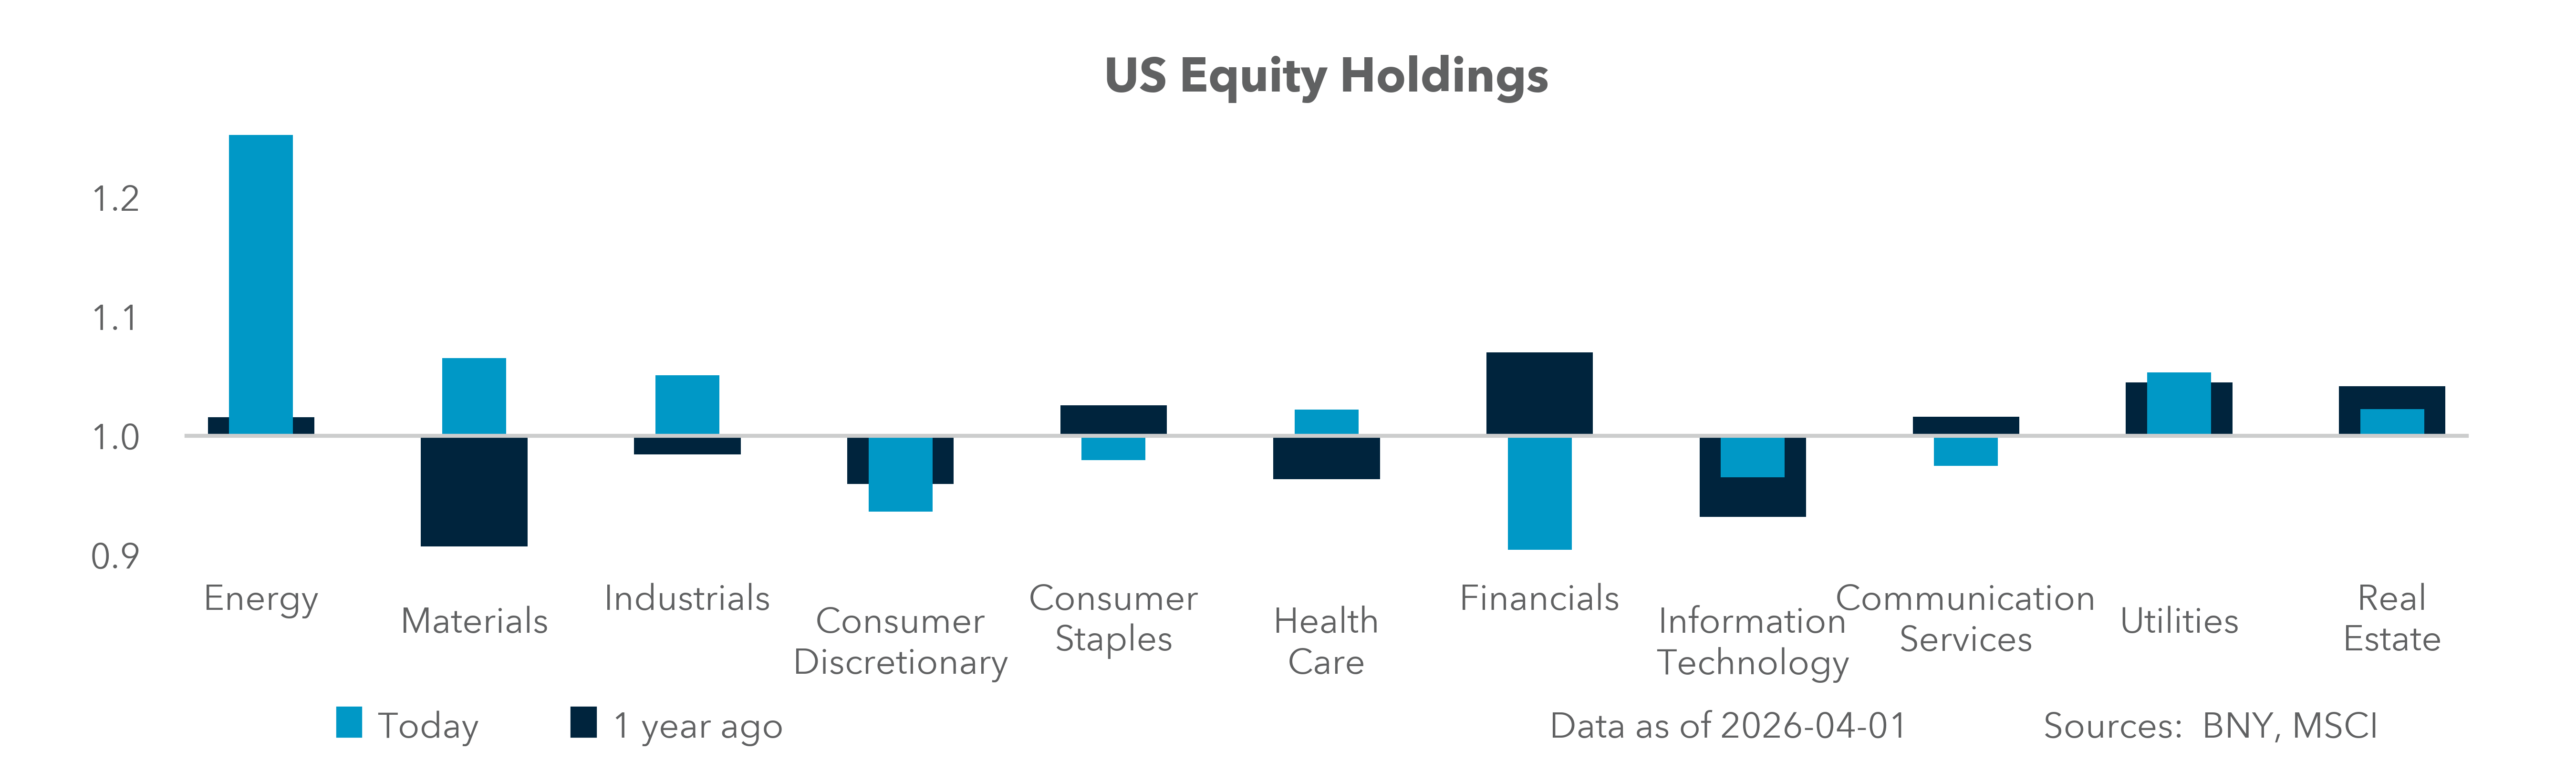
EXHIBIT #1: DM INDUSTRY HOLDINGS SHIFT SINCE CONFLICT ONSET
Source: BNY
Our take
The supply chain shocks add to other concerns for key equity themes. A number of businesses have been hurt globally by supply chain disruptions, including Autos, Pharmaceuticals, Aviation, Industrial Chemicals and Defense, Agriculture and Food, Plastics and Petrochemicals, and Semiconductors.
As we can see from Exhibit #1, markets are not fully pricing in a global risk from supply disruptions given the ability to replace supplies from other sources, but the lag effect from rising costs and output constraints could be significant. APAC has clearly seen the largest hit to growth and the U.S. the least across the key industries disrupted by the war.
Forward look
The extent of demand destruction from price hikes depends on how long the conflict lasts, and some industries are already closer to inventory breaking points than others. Even after the conflict resolves and the Strait reopens, a price lag will persist: input inflation doesn’t always pass through to output prices, but in some sectors it will.
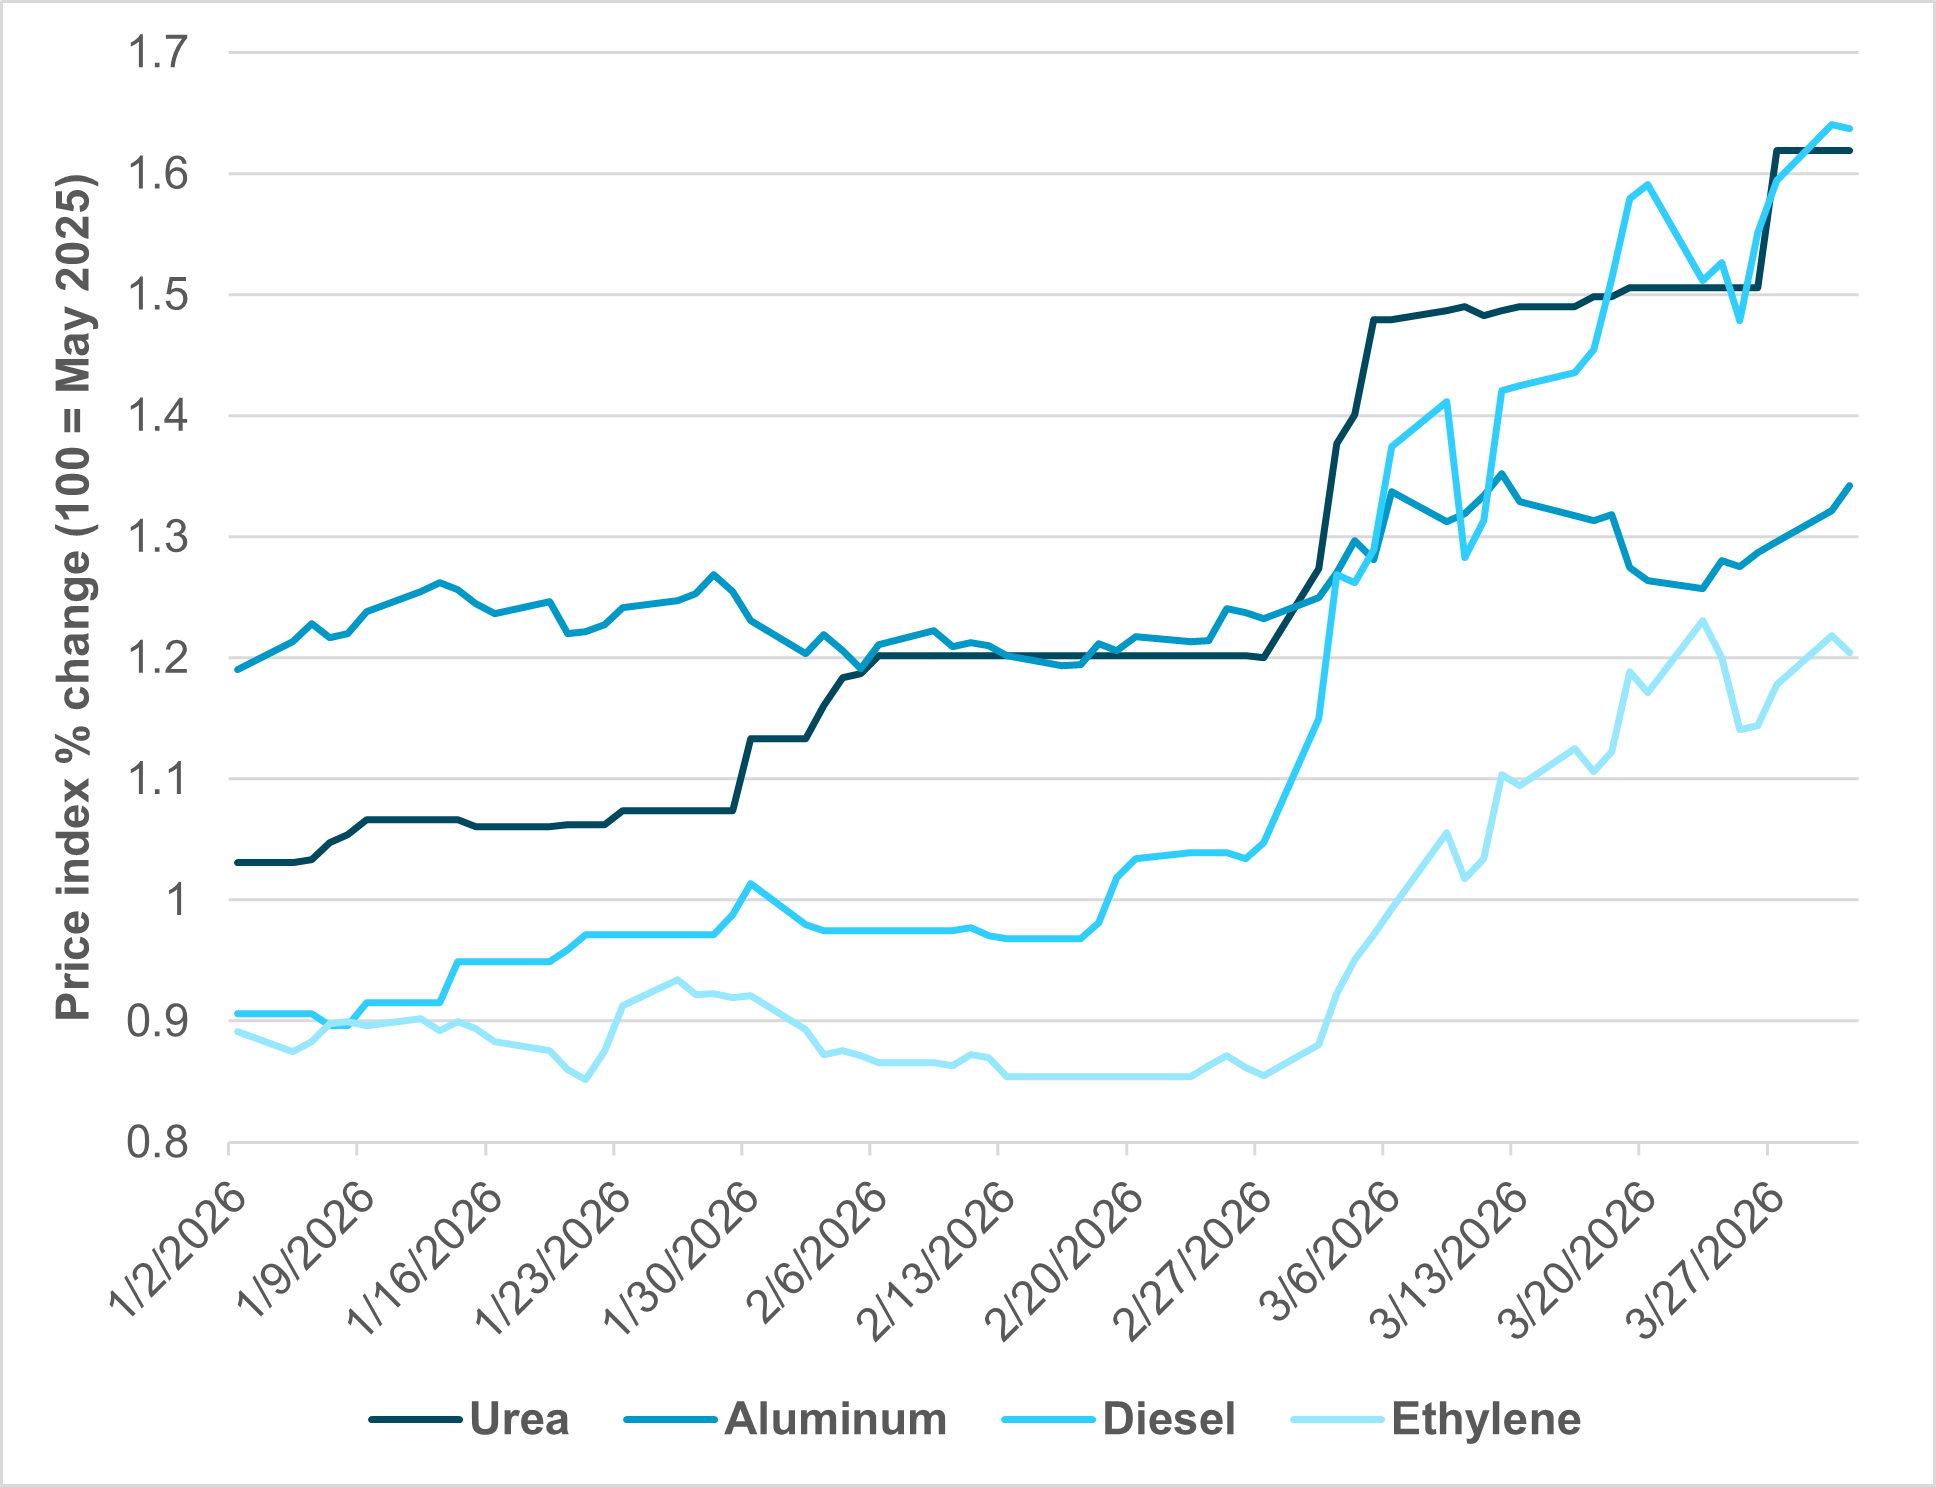
EXHIBIT #2: WAR SHIFTS KEY PRODUCT PRICES
Source: BNY, Bloomberg
Our take
The biggest shift in prices has been in fertilizer and diesel; markets are sanguine about aluminum and ethylene. The risks of larger movements link back to the duration of the conflict and the disruption to future supplies. The inflation impact already delivered to these key materials underlying the industries above makes clear that price pressures for the U.S., APAC and EMEA are not going to slow for months. Estimates for inflation rises from the war are 1–2% globally. If you take the average price shocks, it’s about 50% increase across a broad swath of the global economy, but that will level out and likely reverse in three to six months depending on the conflict. The 1–2% CPI impact is manageable, through timing and delivery will vary.
Forward look
The key question for equities is how much of these price pressures squeeze margins or get passed through to the end user. The $1 rise in gas in the U.S. is already draining $8bn from consumers, raising concerns about credit and discretionary spending, which explains the knee-jerk sell-off in consumer and financial sectors. Some countries are subsidizing the shock, shifting that pain to bond markets, which means higher sovereign borrowing costs globally remain a key variable for corporate earnings ahead.
Iran has targeted the region’s energy and transport infrastructure, the pillars of GCC global power; in doing so, it seeks to damage Gulf citizens’, residents’ and investors’ confidence in these states’ ability to provide security to its population and foreign workers. Despite repeated claims by Iranian officials that civilian areas are not being deliberately targeted, confirmed strikes on airports, ports, tankers, refineries, utilities, industrial facilities and residential areas – especially in Bahrain, Oman, Qatar and the UAE – have widened the consequences of the conflict far beyond the military domain. Key Saudi refineries in Ras Tanura and Yanbu have been hit, with the latter potentially jeopardizing all possible energy-supply routes out of the Gulf, given that its location on the Red Sea provides an alternative to the Strait of Hormuz. Iran has hit Oman’s transport and logistics infrastructure, including ports that function as partial bypass routes. Kuwaiti refineries have also been targeted: the Mina Al Ahmedi refinery came under two waves of attacks on March 19 alone. More than 25 companies operating in the GCC, including national and international energy firms, have applied force majeure.
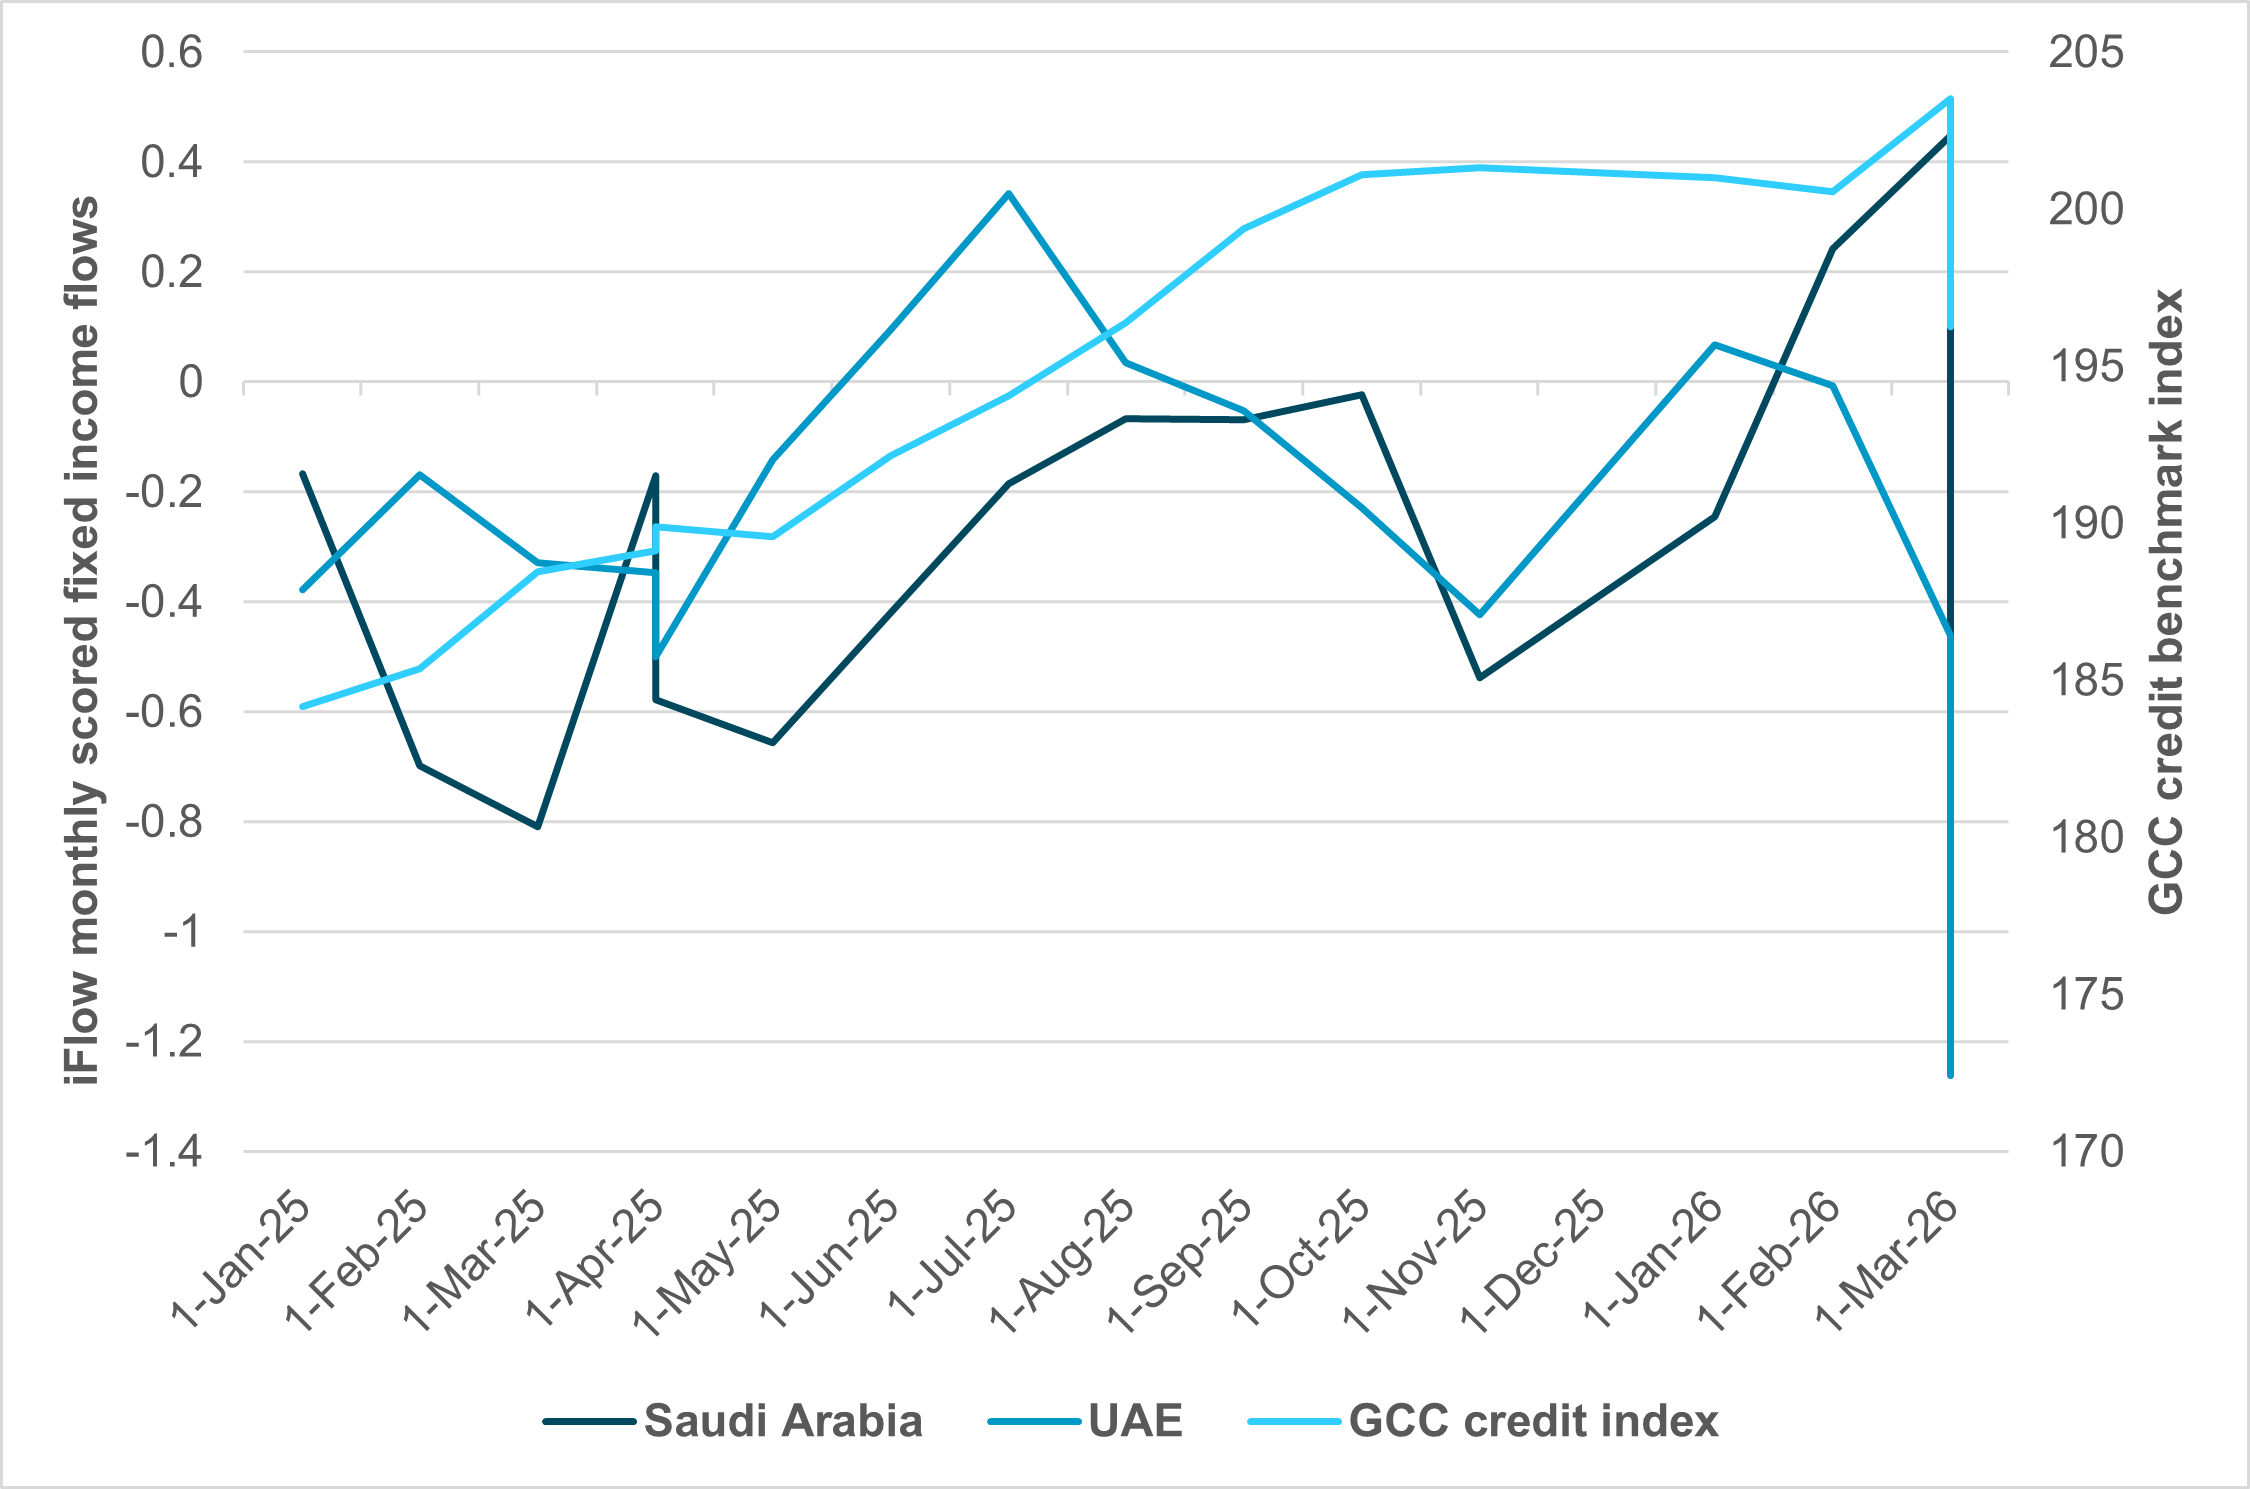
EXHIBIT #3: GCC CREDIT AND FIXED INCOME FLOWS
Source: BNY, Bloomberg
Our take
The UN estimates one month of war is costing the region nearly $200bn, with knock-on effects already hitting frontier nations – Sudan, Yemen and Lebanon are seeing significant increases in poverty. The disruption has constrained energy supplies in 20 countries, including India and China. Infrastructure damage, particularly to LNG and oil assets, means months of rebuilding at a cost of billions of dollars that markets haven’t yet priced in. Bond market flows in the UAE and Saudi Arabia reflect concern, though credit spreads have not moved in kind. The GCC’s resilience stands out in part because of their deep investment base and accumulated savings.
Forward look
The forward risk for equity markets, beyond the immediate price shock, lies in the post-war liquidity squeeze. Qatar’s LNG facility will require significant repair, halting 17% of exports for three to five years and costing Qatar Energy an estimated $20bn annually against a government revenue baseline of $54bn. The GCC invested over $3tn abroad and saved at a rate equivalent to 130% of GDP before the war. That position has clearly shifted, and with the Strait closure cutting exports sharply, investors will be watching for the redemption call. GCC credit dynamics are becoming an important barometer for global equity risks.
Looking ahead, equity markets will be driven less by the initial commodity shock and more by second-order effects on margins, liquidity and capital allocation. The key variable remains duration: a prolonged Strait disruption into mid-2026 would push multiple industries – particularly chemicals, semiconductors and autos – toward inventory depletion and production cuts, with APAC most at risk. While headline inflation may peak in the near term, the lagged impact on corporate costs and pricing power will define earnings revisions into the second half of 2026. Investors should focus on companies with supply chain flexibility, pricing power and balance sheet strength, as these will be best positioned to navigate input volatility. Additionally, rising sovereign borrowing to fund subsidies and reconstruction introduces a tightening liquidity backdrop, linking GCC credit dynamics more directly to global risk assets. Equity dispersion is likely to increase, favoring selective positioning over broad beta exposure.