Inflation, capex and AI
iFlow > Equities
An in-depth look each Friday at the factors shaping equities markets in developed and emerging economies around the world.
iFlow > Equities
An in-depth look each Friday at the factors shaping equities markets in developed and emerging economies around the world.

Bob Savage
Time to Read: 5 minutes
Concerns about inflation and growth continue to dominate all markets, and equities are not immune. Following this week’s FOMC and other central bank decisions and the core PCE inflation report, expectations have shifted from a modest easing to a potential tightening risk into 2027. This changes the cost of leverage and affects the models for returns in the quarters ahead. The link between lower rates and higher stocks has been notable in the U.S. year to date, but stagflation fears eased as earnings reports beat expectations and drove equity prices higher.
April was one of the best months for the S&P 500 in decades – up 9% – with only ten years in the index’s 100-year history seeing gains higher than 5%. More than 50% of the index has reported earnings, with average EPS up 15% on revenue growth of 10.3%. Magnificent Seven earnings remain vital despite the broadening growth that began in Q4 2025. The group’s earnings growth rate is 22.8% (much which depends on Nvidia), while the rest of the S&P 500 stands at 10.1%. AI-driven growth and rising semiconductor prices have complicated the analysis of technology earnings and debt. The relationship between capex intensity and market performance over the last five years has been unclear, with AI driving uneven return correlations.
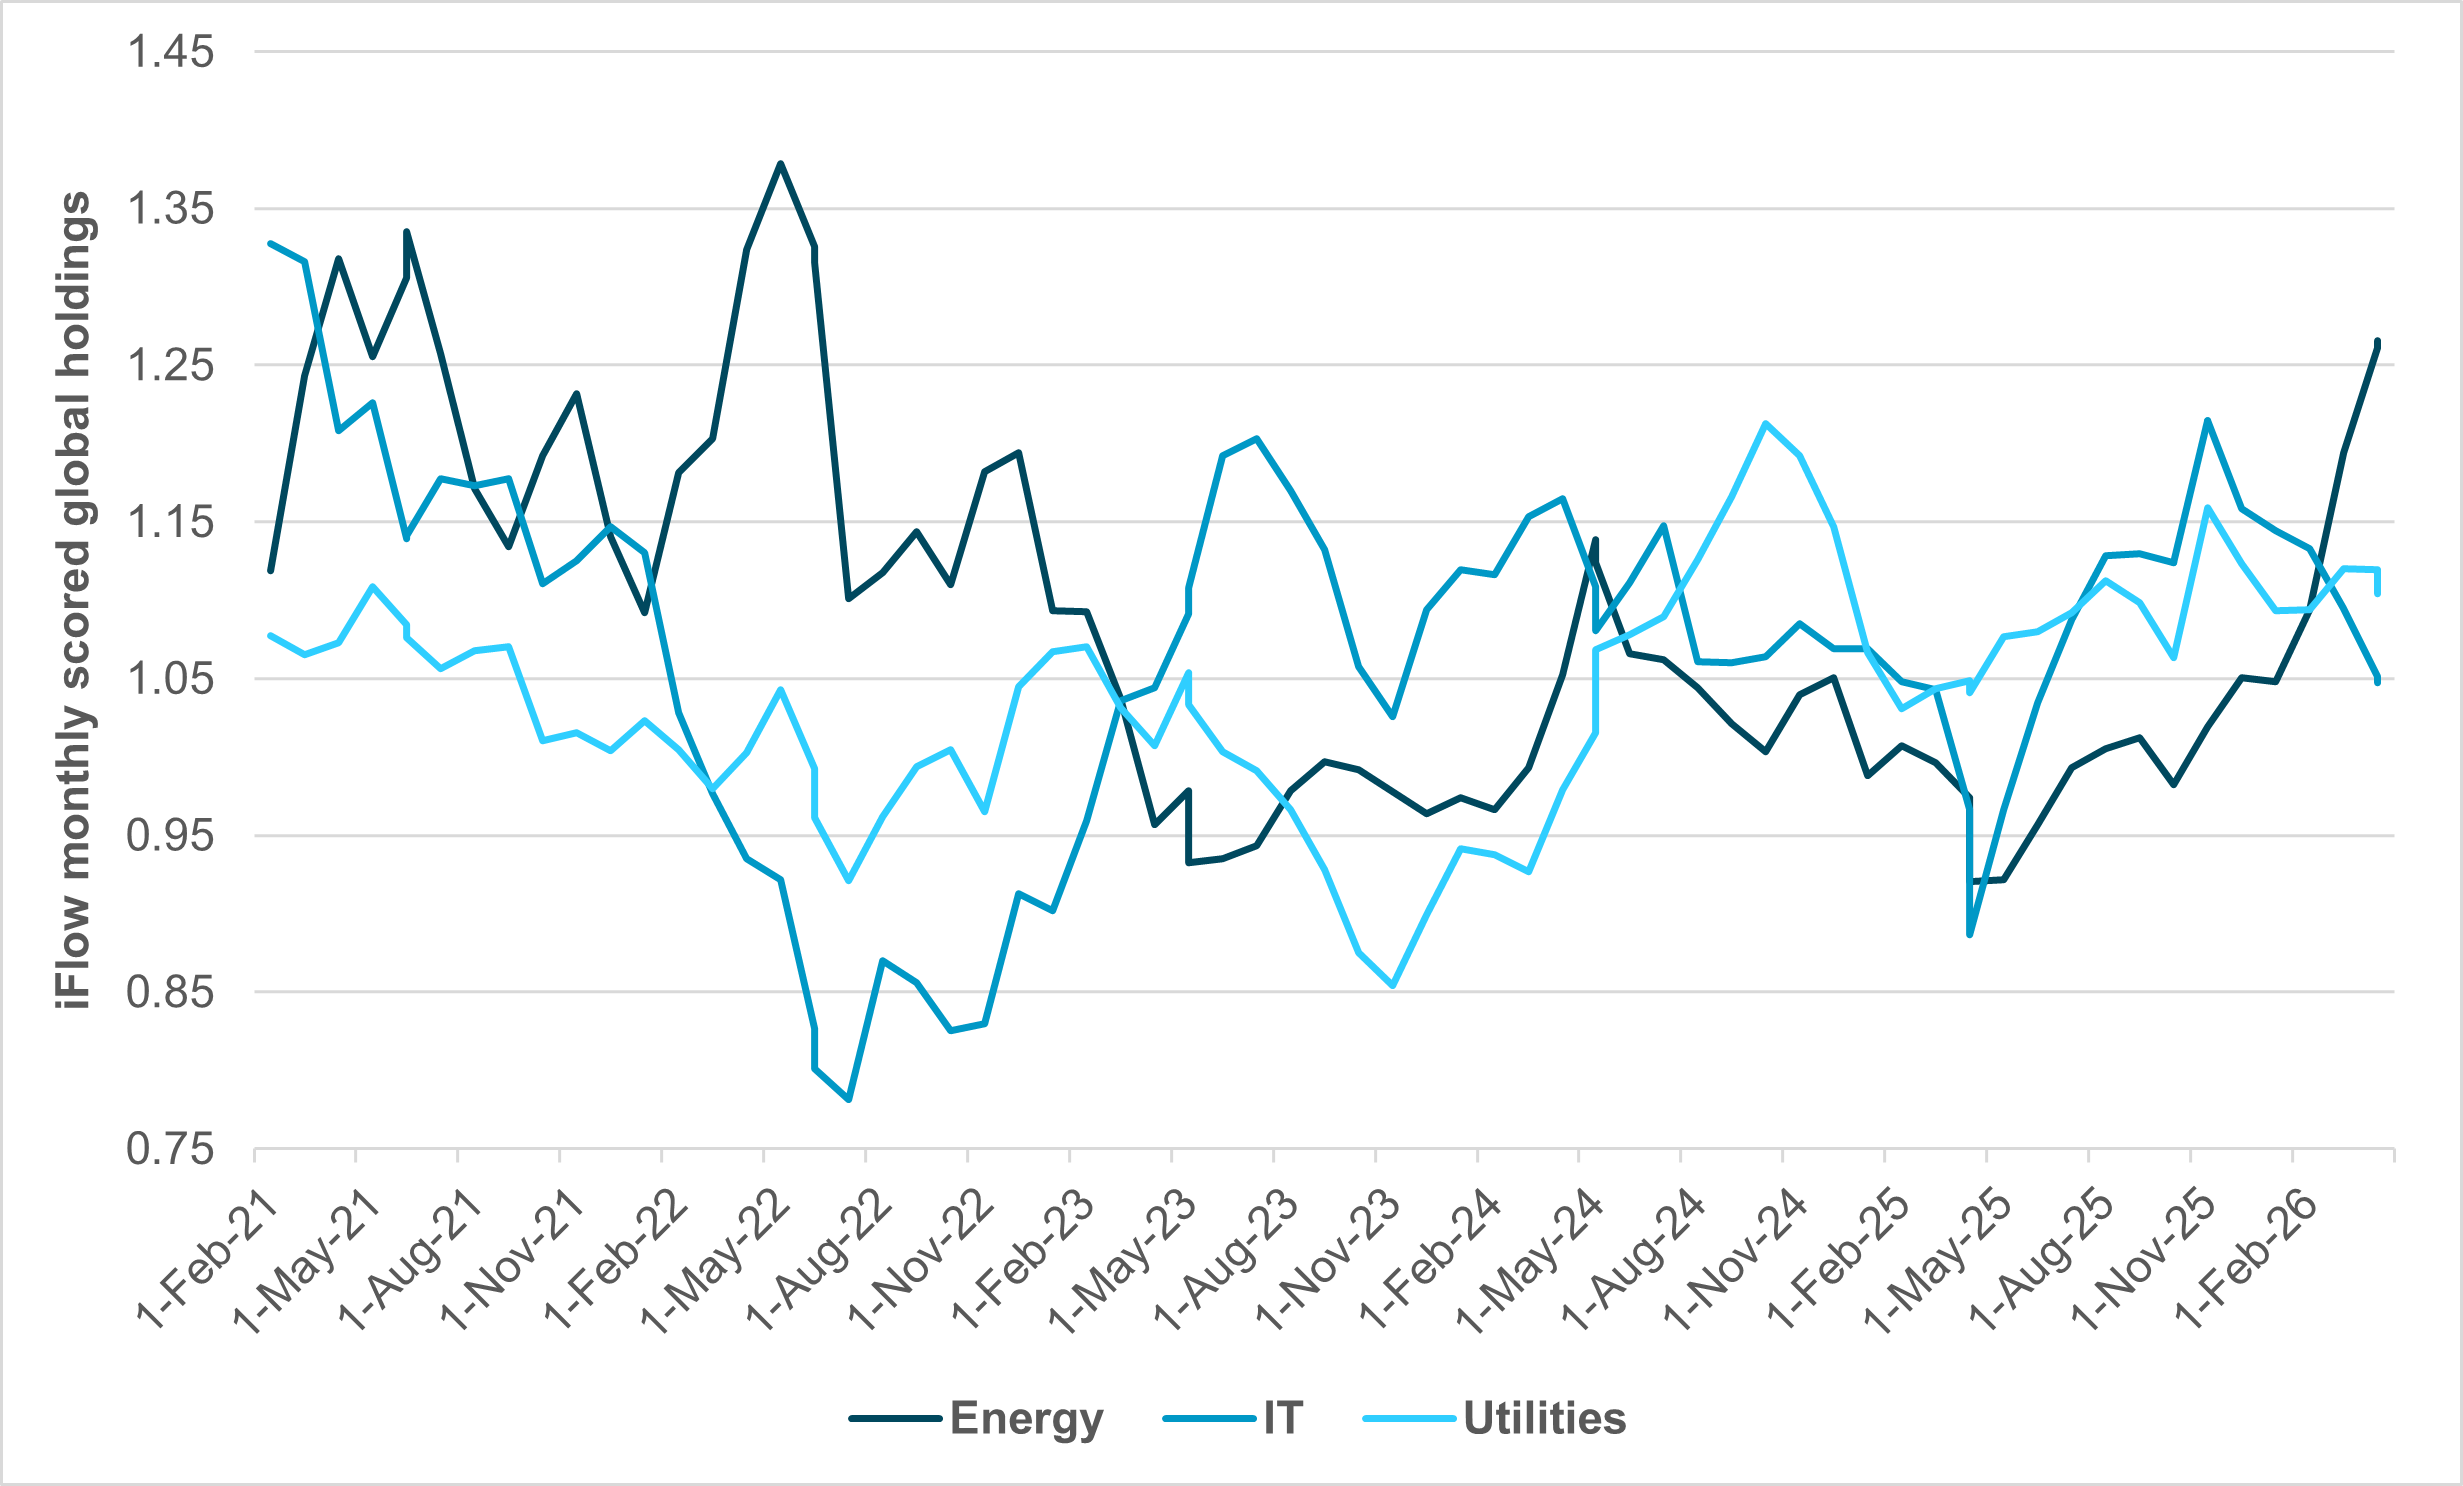
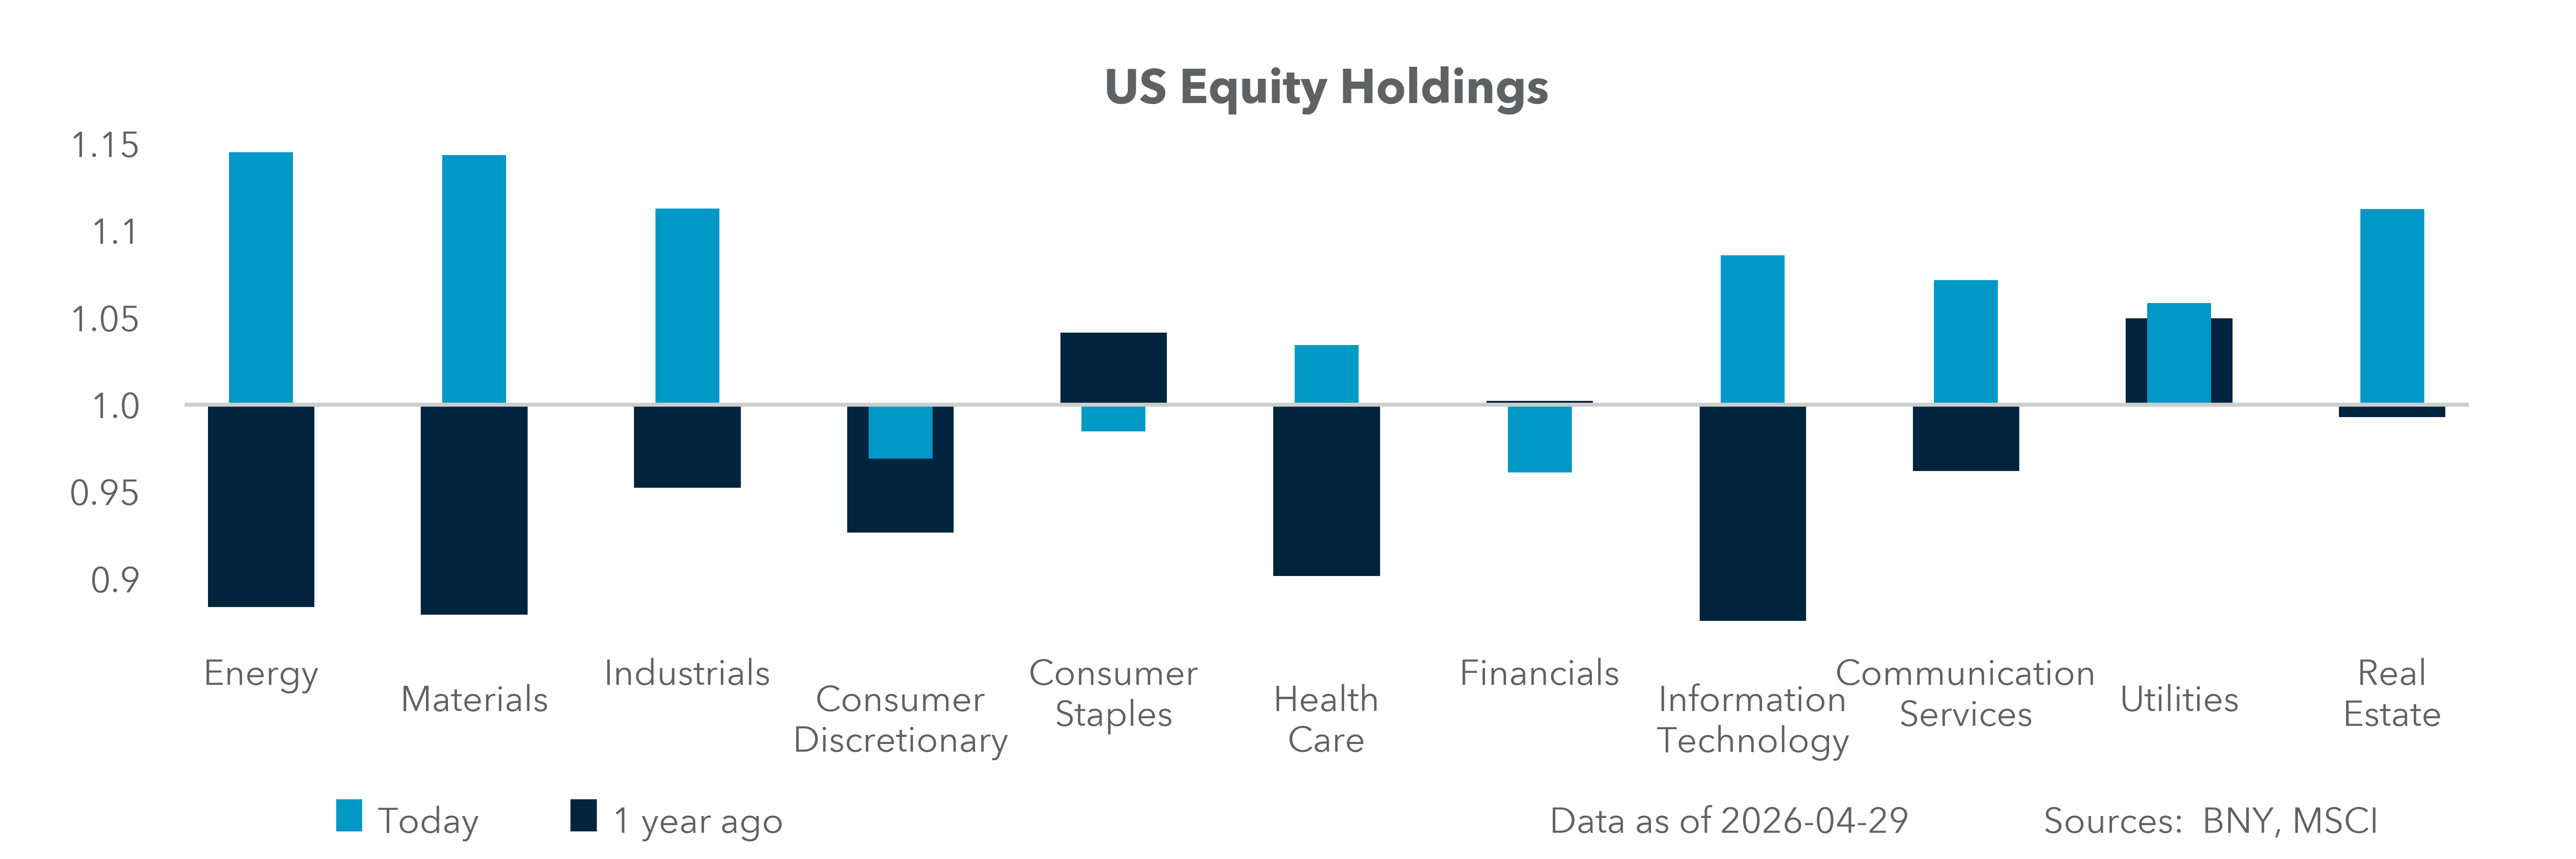
Volatility spikes from geopolitical risks have left portfolio managers looking for diversification and safety. Investors have favored Energy over Utilities or IT since October 2025. Since the start of the U.S.–Iran war, this rotation has proved more dramatic, suggesting a safe-haven shift from Utilities to Energy.
EXHIBIT #1: GLOBAL SECTOR HOLDINGS – ENERGY, IT, UTILITIES
Source: BNY
Our take
Energy holdings have moved from underweight to overweight in the last year. The April 2025 lows were 6% below average and the April 2026 holdings are 24% overweight. By comparison, IT holdings peaked at 33% during the pandemic; in 2025, allocations reached nearly near 17% in October. Utilities have been highly correlated to IT thanks to the demand for data center power and the growth of IT investments into them. Utilities and Energy have notably diverged in 2026 and that break suggests something has changed. Energy’s weight in the S&P 500 market cap peaked at 28% in 1980; by 2008, it stood at 14%.
Forward look
Energy’s role in driving costs for Utilities is reflected in the global pullback of holdings for the sector. Electricity generation costs are rising globally, yet the ability to pass these expenses to consumers – including IT companies – remains constrained. Politics are likely to play a significant role in how Utilities operate over the coming year following the energy shock.
Global electricity subsidies are notable, led by Germany at 7% of GDP during the 2022 Russia–Ukraine war peak. Other nations, such as Indonesia (4% of GDP) and the U.K. (2% of GDP), illustrate how politics influence profit margins and returns. The U.S. has seen rising pushback on data centers and electricity costs, making the midterm elections an important factor for the sector.
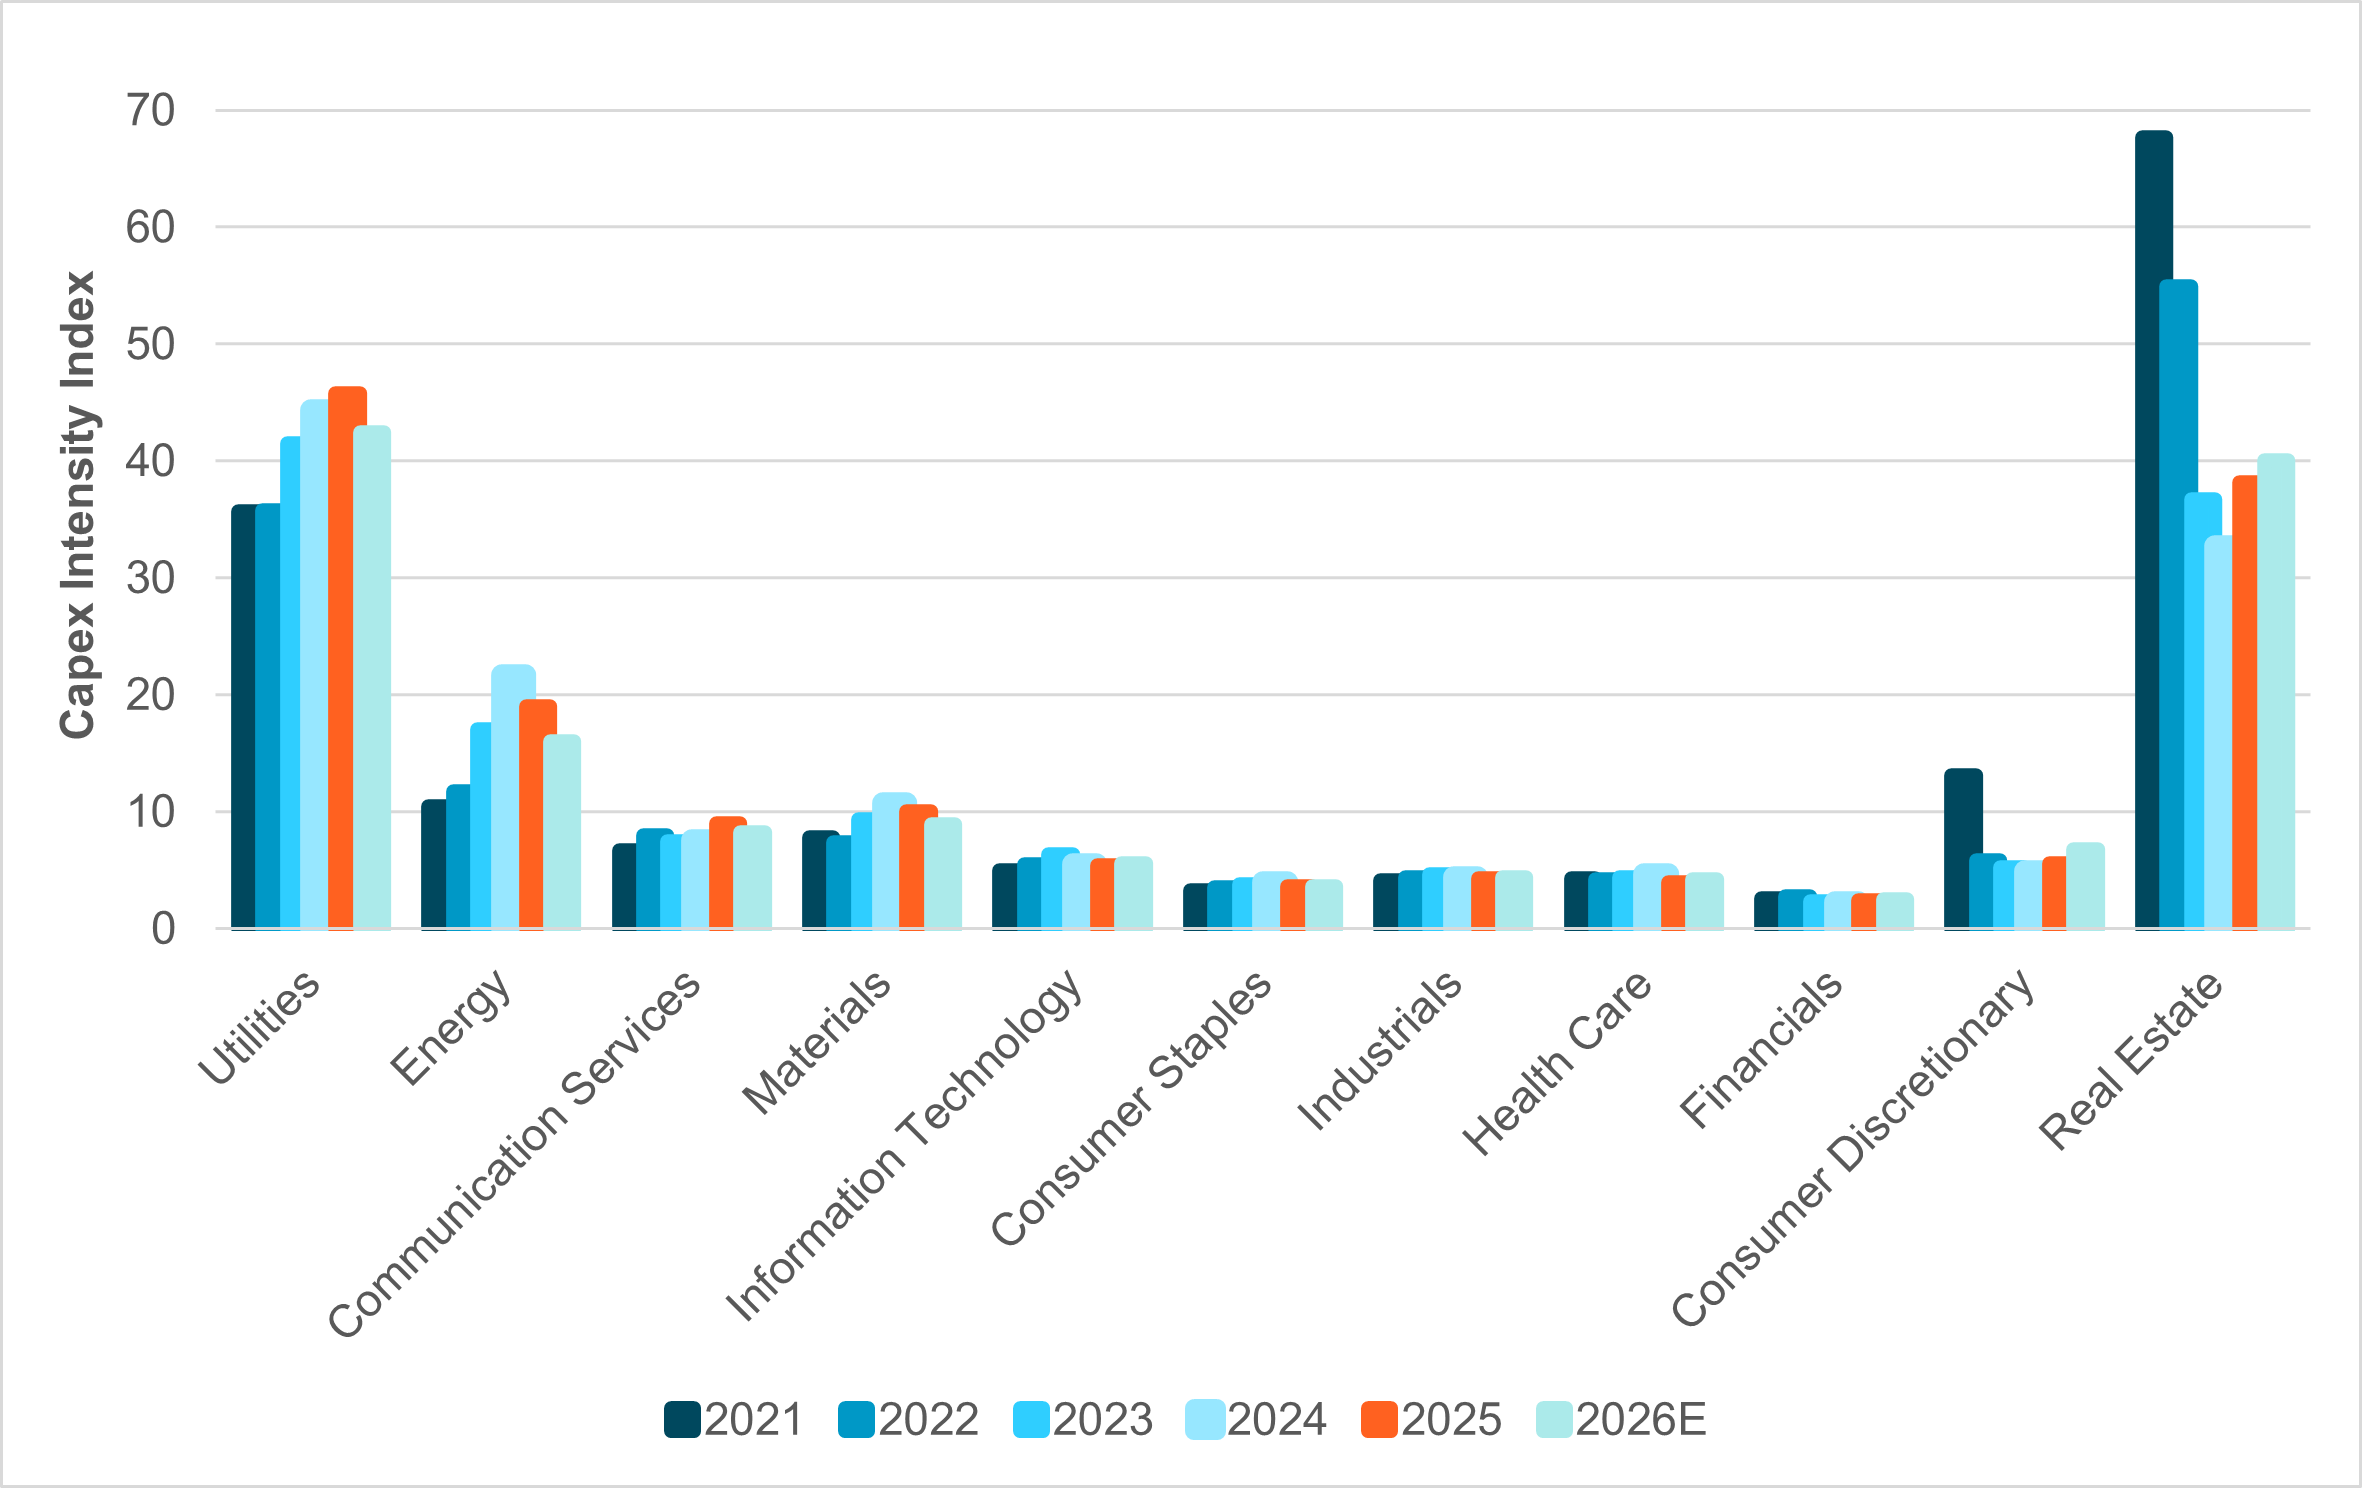
EXHIBIT #2: U.S. S&P 500 SECTOR CAPEX INTENSITY
Source: BNY, Bloomberg
Our take
Capital intensity measures the percent of capex to revenue for any stock. The current most capital-intensive sectors are Utilities at 42.5% and Real Estate at 40%. These sectors reflect the infrastructure-heavy nature of their businesses. Notably, the Energy sector shows significant capital requirements for exploration, production, and refining operations, currently at 16.6%. The problem for the current environment is that U.S. Energy capex is well off the 2024 highs. Technology at 5.5% is moderate in its capital intensity and yet the correlation of that to the market has risen considerably. Investors are balancing data center investments with asset-light software businesses.
Forward look
While capex has driven performance for some sectors, it has been uneven for the S&P 500 overall. The uptrend in Utilities has been notable and appears to be peaking. Utilities increased capex intensity by 6.8 percentage points (+19.0%), rising from 35.7% to 42.5%. The sector showed consistent growth through 2025 (45.8%) driven by grid modernization, renewable energy infrastructure, and transmission investments.
The role of rates on investments shows up most clearly in Real Estate, which experienced the most dramatic decrease, falling from 67.7% in 2021 to 40.1% in 2026E, a net 40.8% drop. Utilities and Real Estate are likely to be critical to how data center costs move into the rest of 2026 and 2027. Investors are focused on semiconductor costs, but other factors are critical given the Magnificent Seven’s plans for $725bn investment into AI.
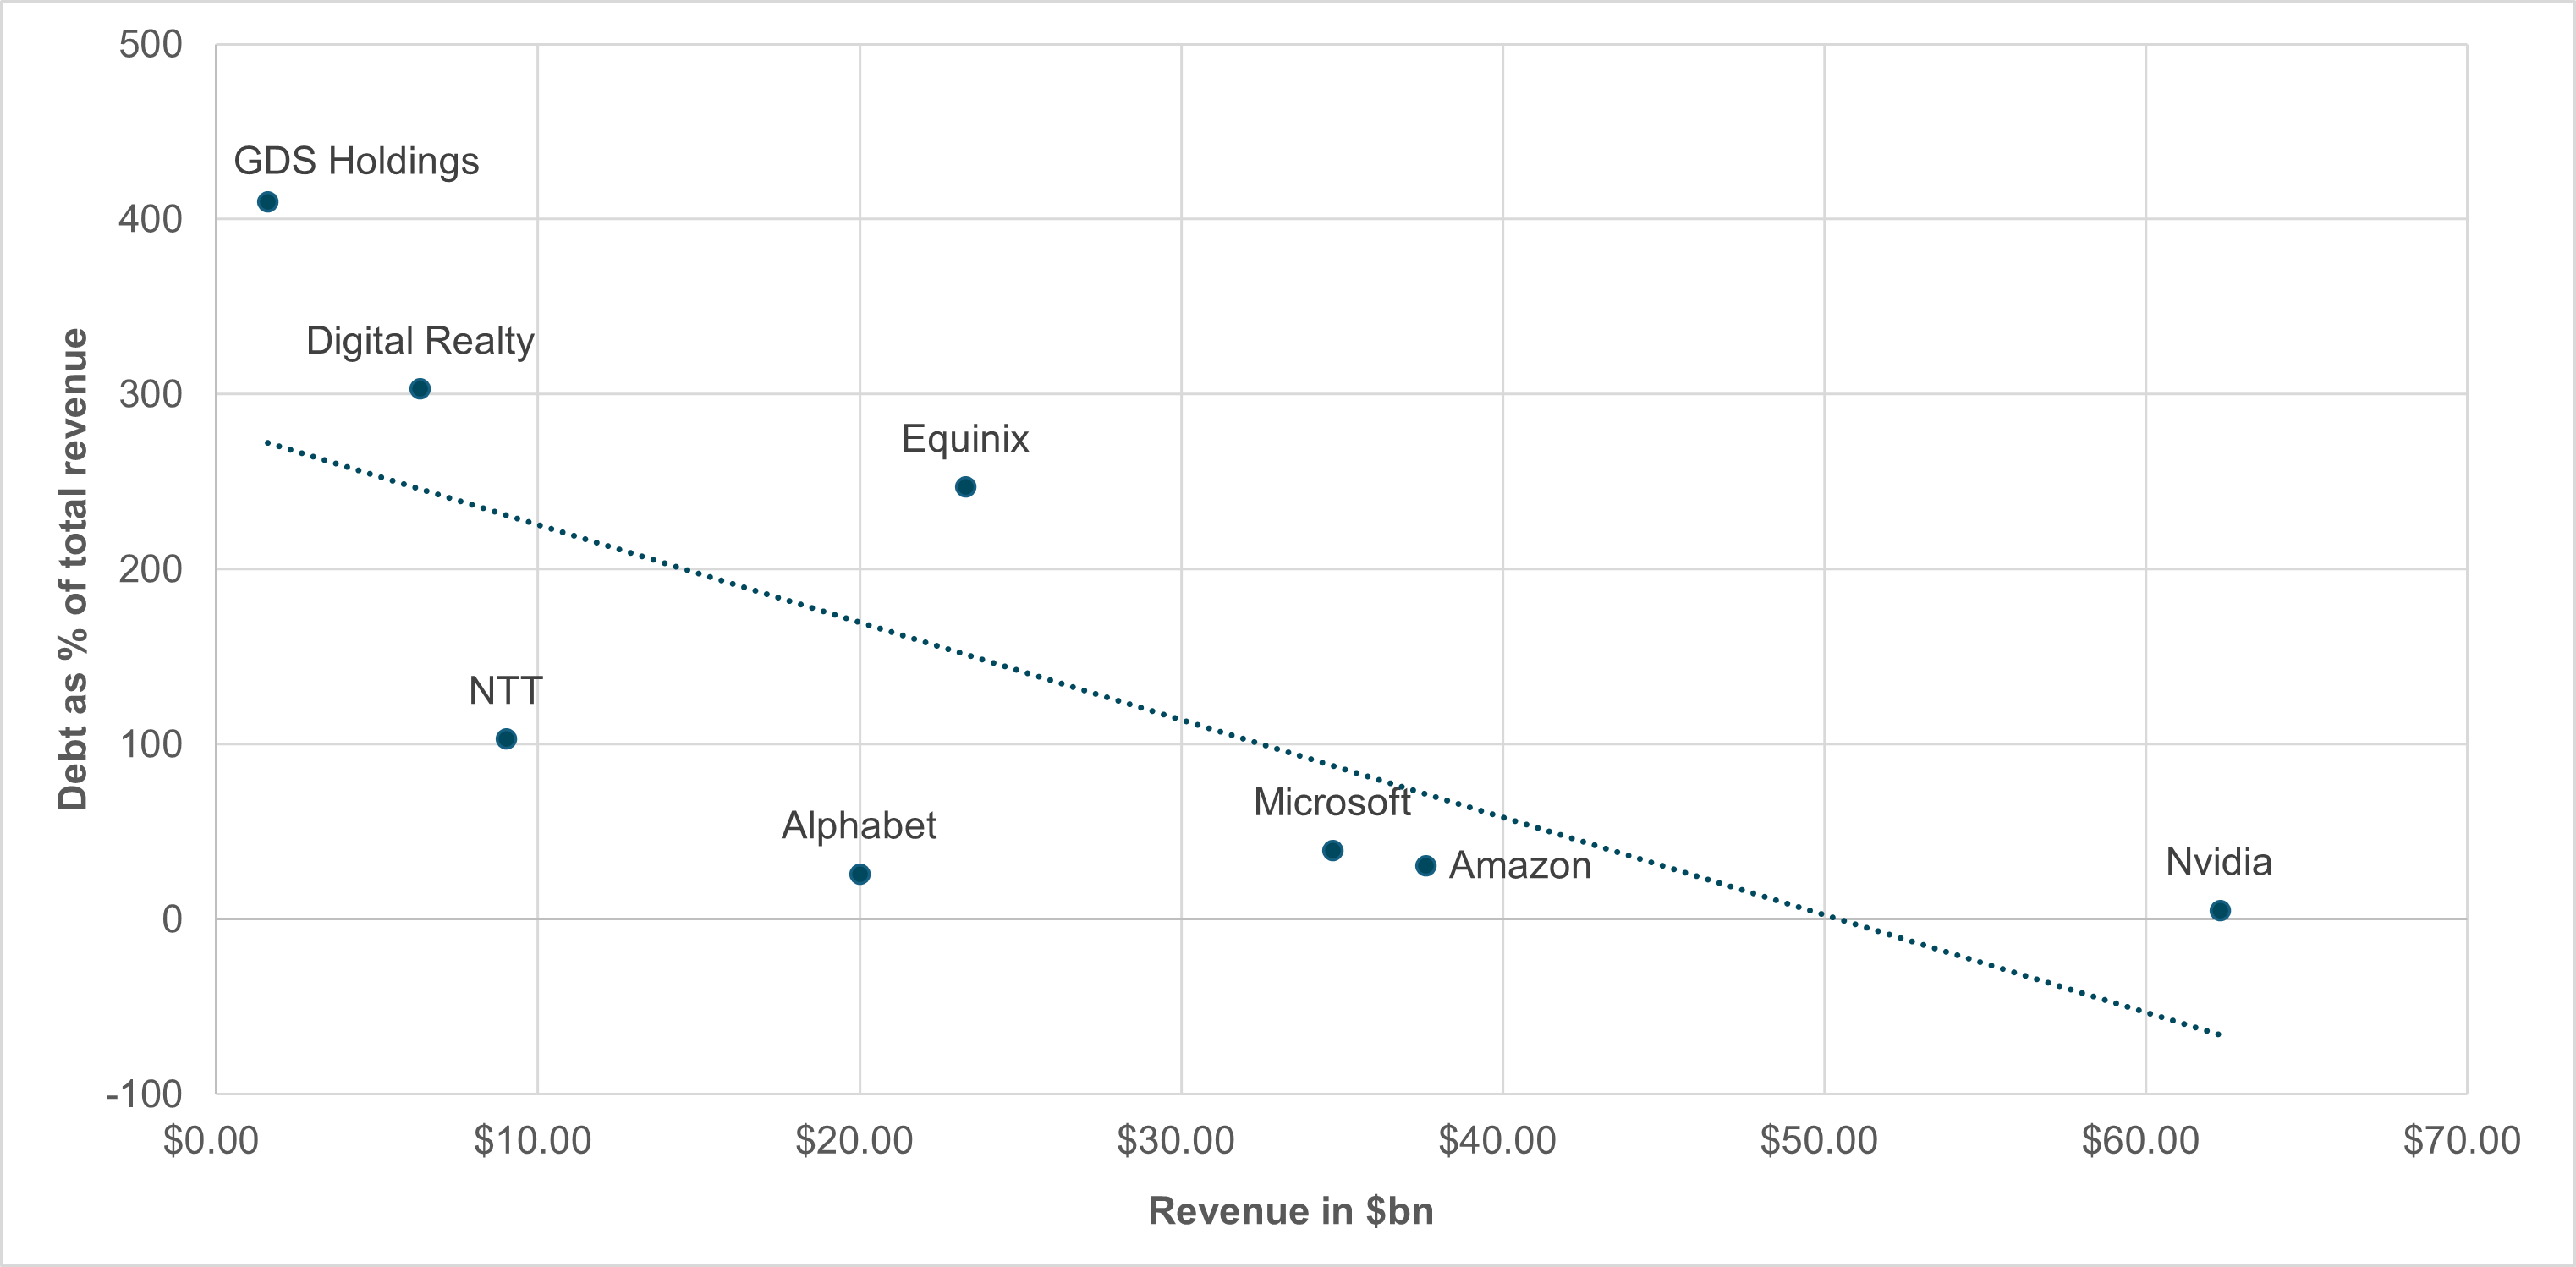
EXHIBIT #3: DATA CENTER REVENUE AGAINST DEBT TO REVENUE
Source: BNY, Bloomberg
Our take
Amazon, Microsoft and Alphabet account for 58% of all data center revenues. Firms such as Meta, Apple and Tesla use this infrastructure for their own services. Beyond the U.S., Japan’s NTT, and China’s GDS Holdings remain among the top ten providers. Infrastructure and co-location providers include Schneider Electric, Vertiv and Eaton. Cloud revenue growth accelerated following the 2022 introduction of large language models. Since then, AI has emerged as a primary thematic driver for investment and returns.
Forward look
Maintaining data center momentum depends on how component costs align with revenues and projected earnings. Capital structure among major cloud service providers remains modest relative to their competitors. Winner-take-all risks appear lower in this sector; consequently, the performance of secondary cloud providers may be essential to understanding potential growth.
Record-breaking data center revenues at Amazon, Microsoft and Alphabet suggest broadening AI adaption across a wider range of industries. The next logical step will be to see productivity improvements across a broader set of industries. The fear of a zero-sum game from AI investments looks overblown, but inflation risks – from chips to energy and infrastructure – are underappreciated. The risk of ROI models being too optimistic reflects back to underlying inflation rate expectations, along with the cost of leverage.
The forward path for equities hinges on the interaction between resilient earnings growth and increasingly uncertain macro conditions. While Q1 results confirm solid topline and bottom-line momentum, the durability of this trend will depend on whether inflation pressures – particularly from energy, semiconductors, and infrastructure – begin to erode margins or delay anticipated rate relief. The rotation into Energy and divergence from Utilities suggest investors are reassessing input cost and geopolitical risks, rather than simply chasing growth. At the same time, AI-driven capex remains a critical but uneven contributor, with returns likely to materialize over a longer horizon and with greater dispersion across sectors. For equity investors, this implies a more selective environment where factor exposures, pricing power, and capital efficiency matter more than broad multiple expansion. Positioning should increasingly balance cyclical opportunity with structural inflation risk and policy uncertainty into 2027.