Earnings beats clash with uneven signals ahead
iFlow > Equities
An in-depth look each Friday at the factors shaping equities markets in developed and emerging economies around the world.
iFlow > Equities
An in-depth look each Friday at the factors shaping equities markets in developed and emerging economies around the world.

Bob Savage
Time to Read: 4 minutes
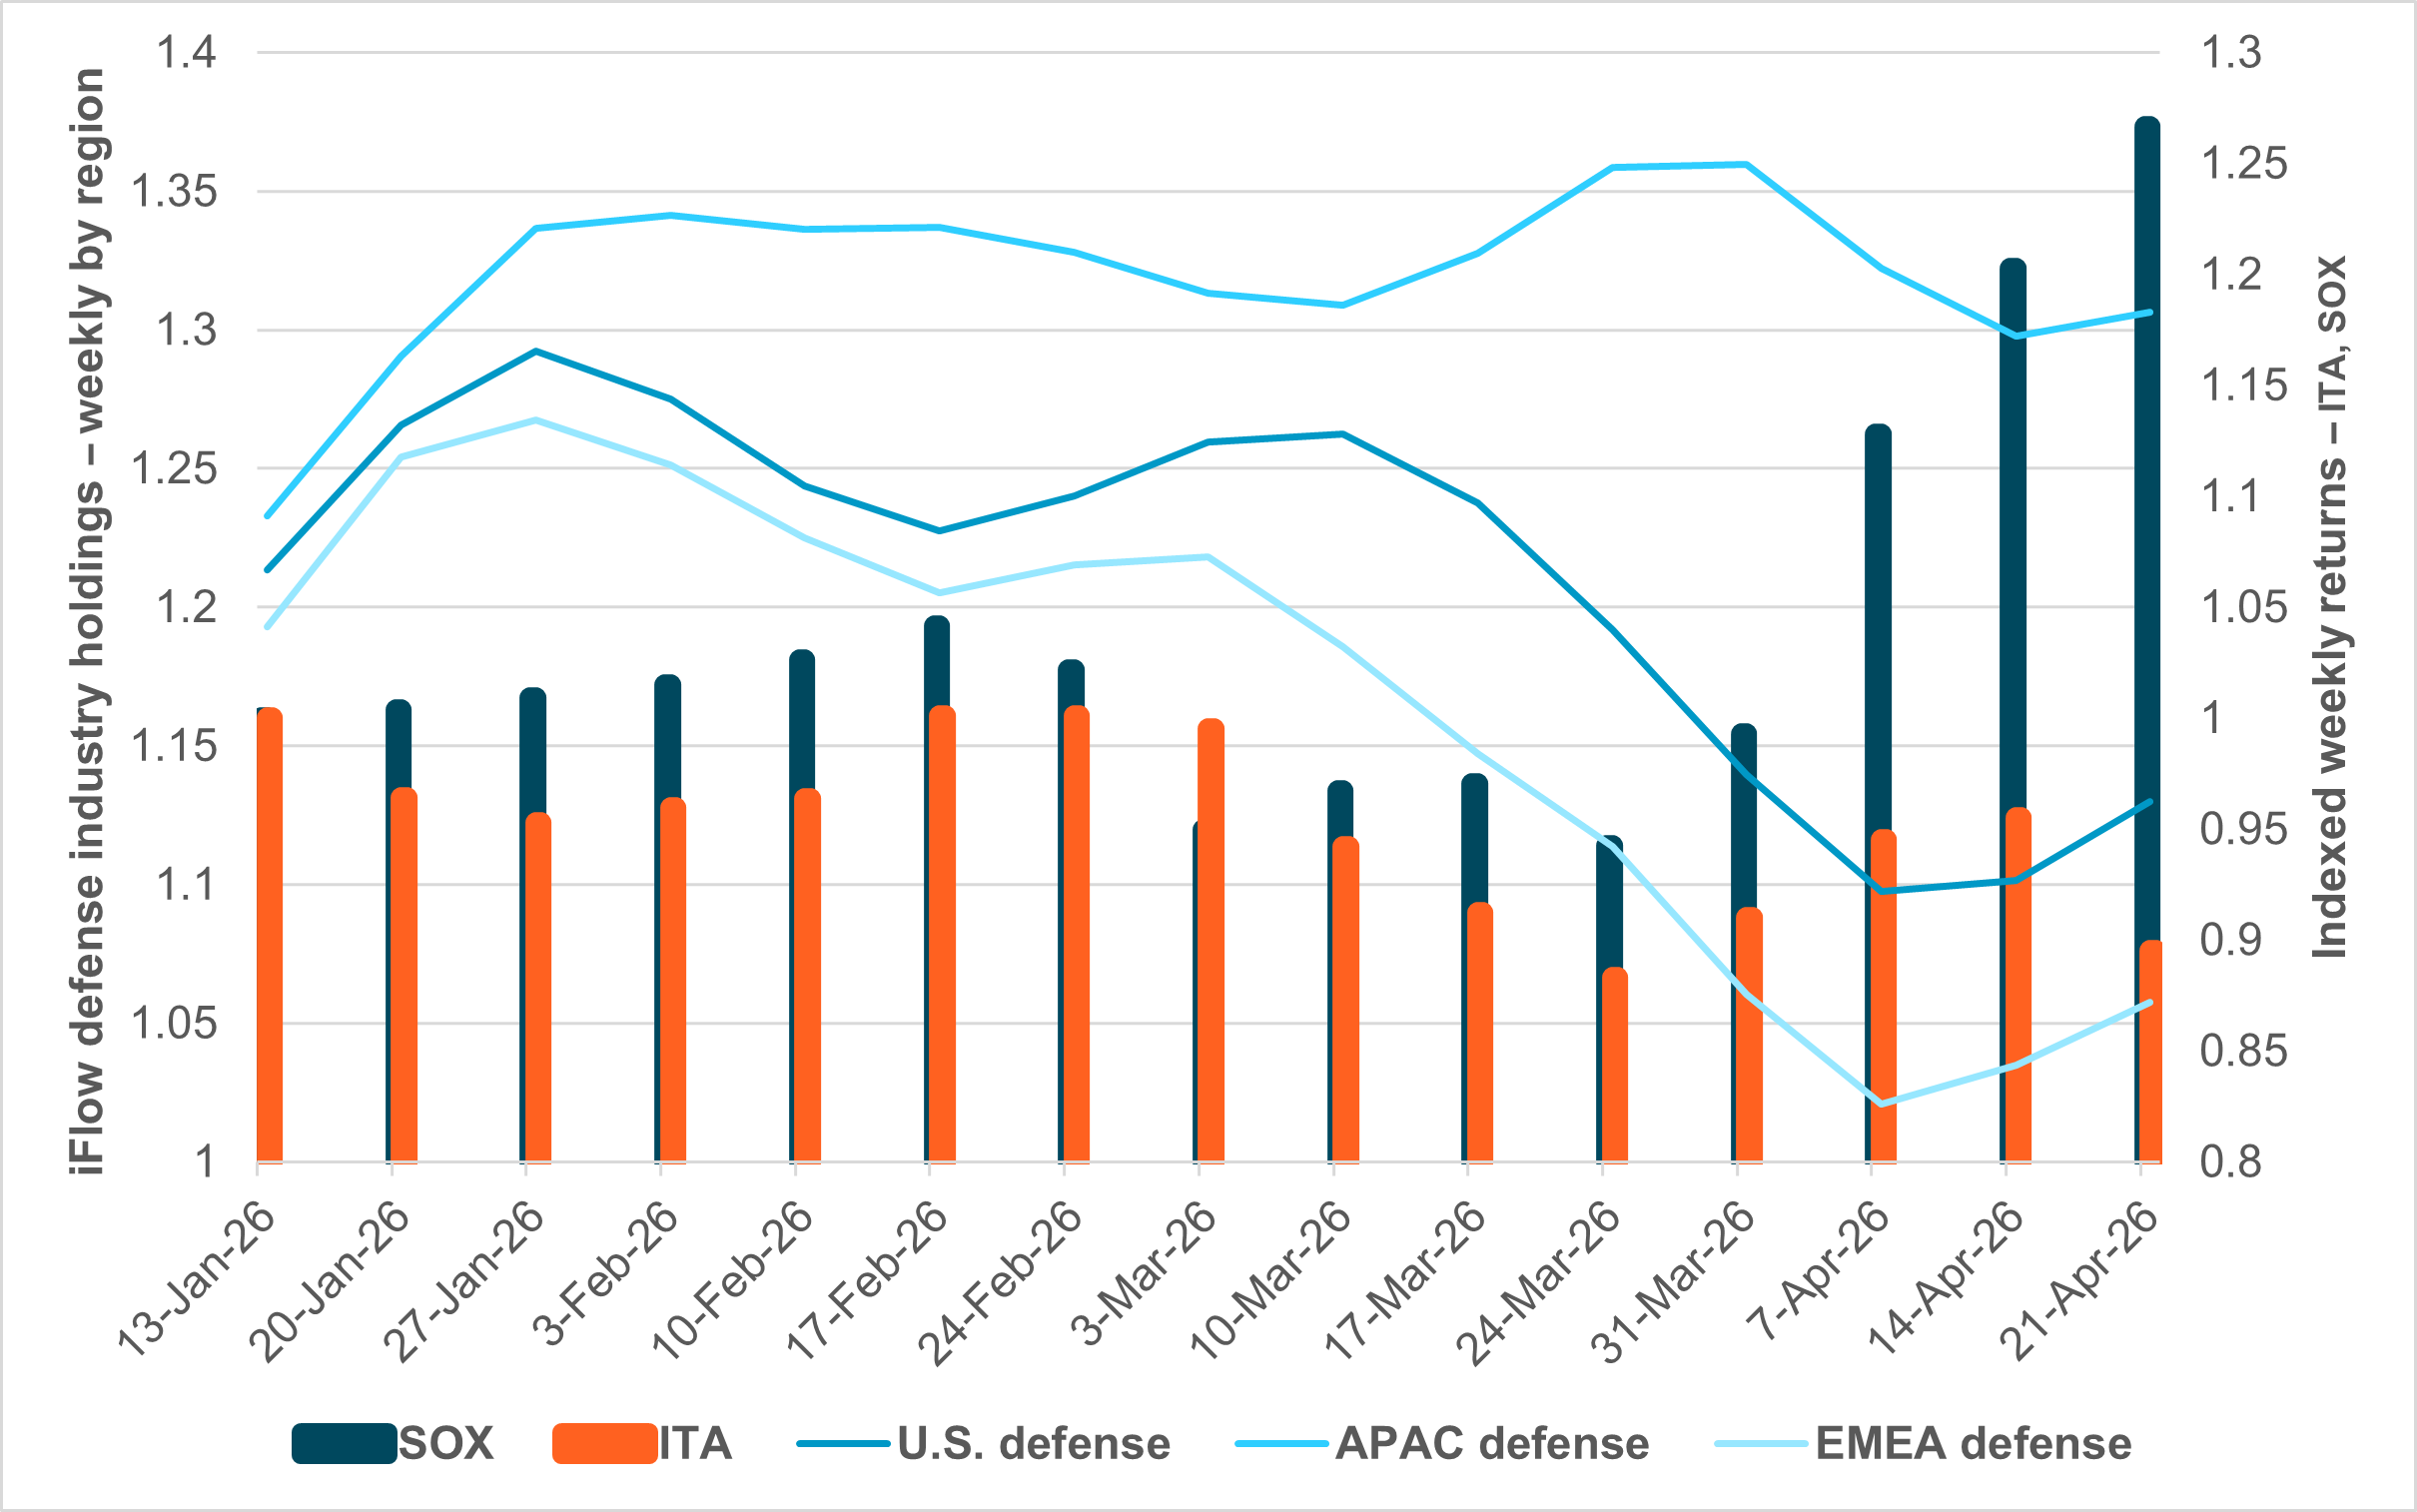
EXHIBIT #1: IFLOW DEFENSE HOLDINGS BY REGION VS. DEFENSE AND SEMICONDUCTOR ETFS
Source: BNY, Bloomberg
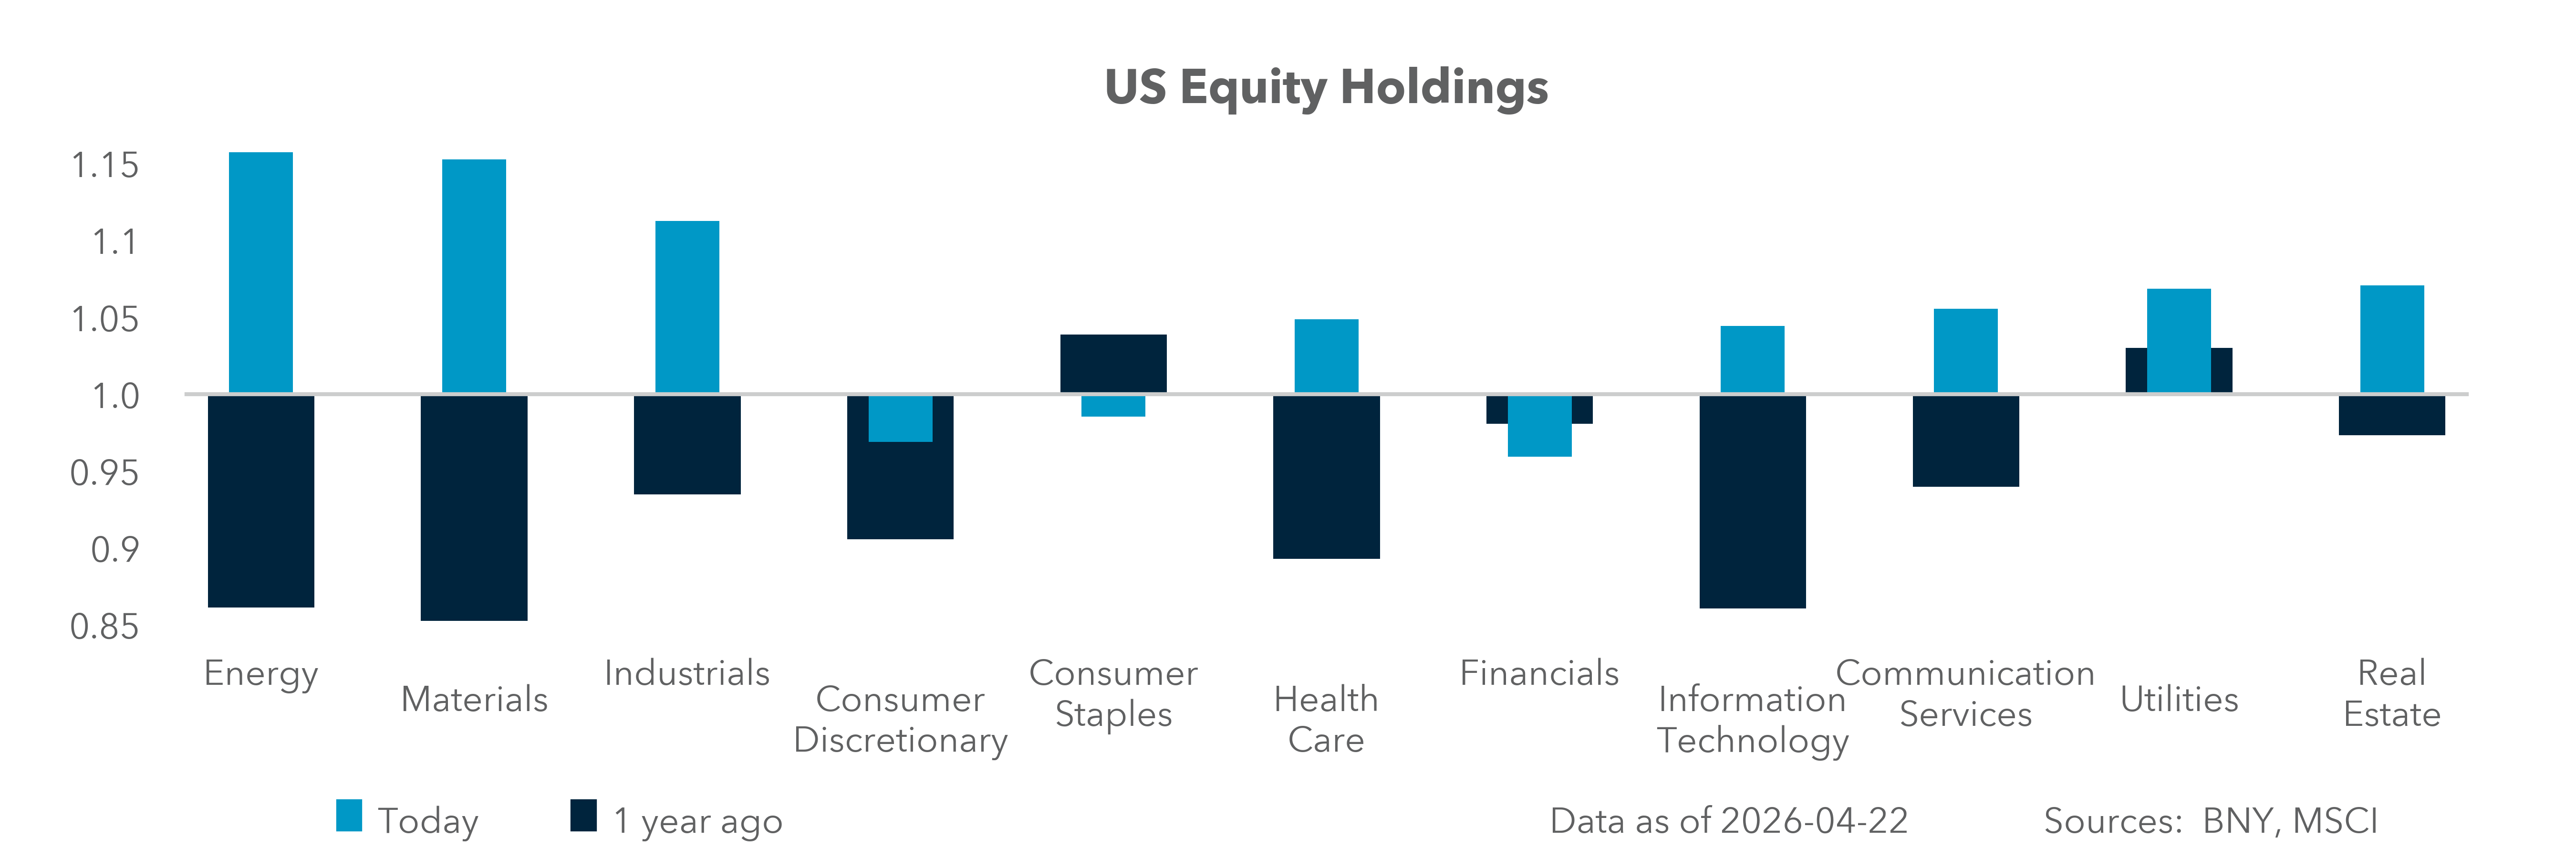
Equity earnings in Q1 to date are up 15% for the S&P 500. The two weeks of U.S. reporting show 84% EPS beats, but the earnings spread above expectations has been modest, below 2% and below long-term averages. Q2 and full-year outlooks are uneven. April’s rally has broadened equity gains in the U.S. and helped other regions, but the focus on energy sector shares, AI companies, and defense has been consistent. The energy sector saw the largest shift in earnings outlooks, from -12% to +1%, making the next two weeks of reports key for meeting expectations. The AI story has bifurcated between software and semiconductors, with the Philadelphia Semiconductor Index climbing to new historic highs.
Our take
The turning point for risk came with the U.S. ceasefire and expectations for the war’s resolution. The defense holdings across all regions gained at the start of the war and then reversed, bottoming out on the ceasefire. Counterintuitively, this reveals that defense industries are vulnerable to energy shocks despite the demand. The semiconductor rally bounced with the ceasefire regardless of energy costs and other supply chain worries. The U.S. defense ETF ITA has lost 10% on the year despite the demand for spending from the conflict, while the SOX index has jumped 25%.
Forward look
The sharp rebound in the April U.S. manufacturing PMI is at odds with the weakness in defense shares. Boeing’s earnings this week showed a steady recovery, with rebounding commercial deliveries and strong defense and services revenues. The defense and space order backlog increased to 15% of its total. Markets are chasing AI chip demand over the defense demand driven by the Iran war. The low holdings across all regions and the ongoing geopolitical uncertainty will support defense industries in the quarter ahead should oil prices normalize.
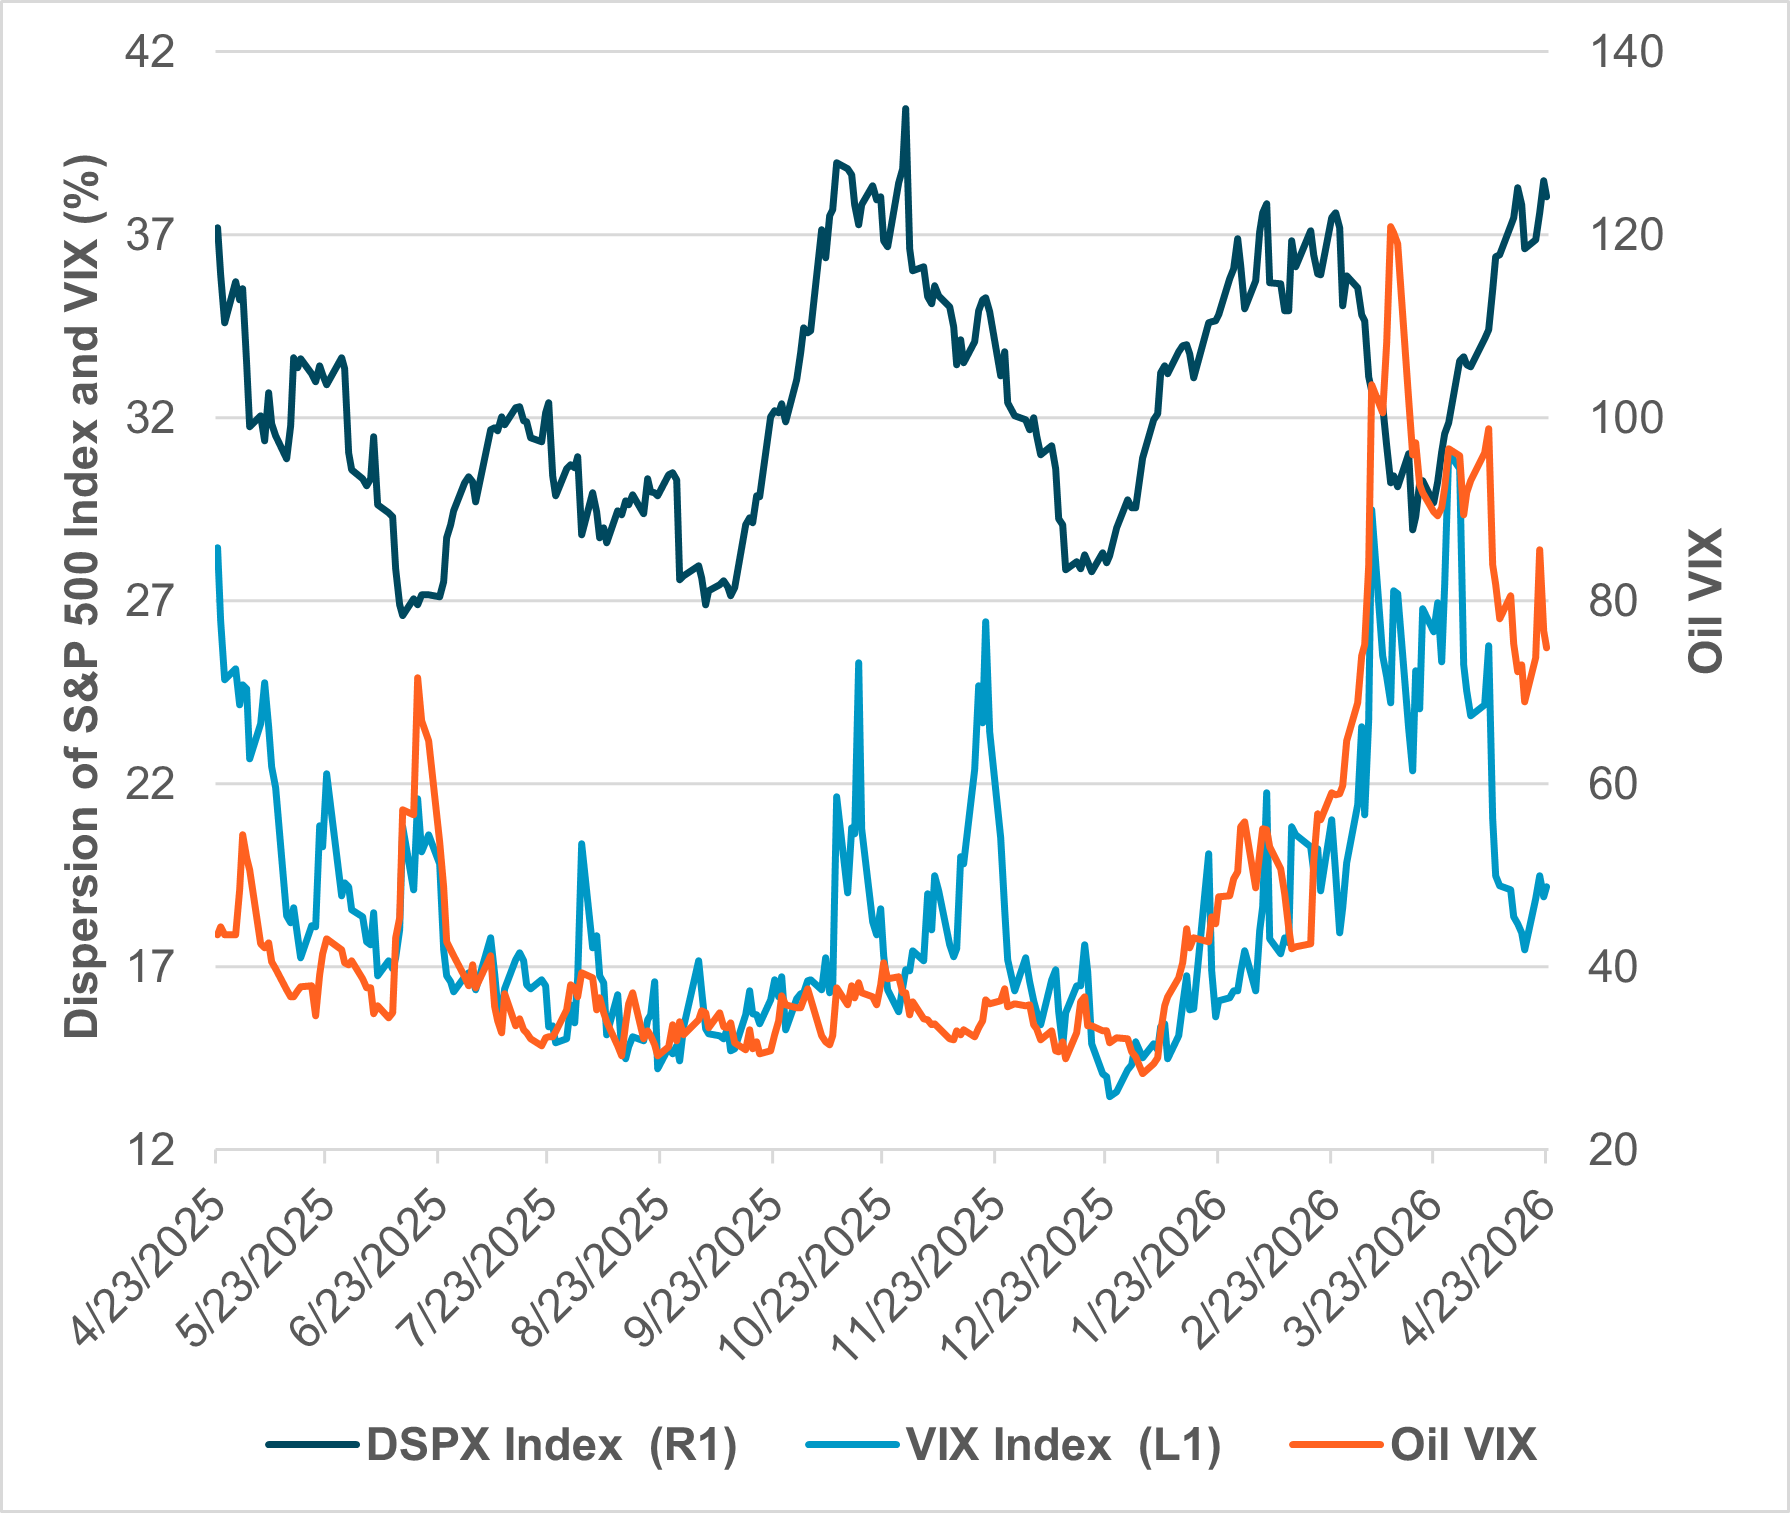
EXHIBIT #2: VIX, S&P 500 DISPERSION, AND OIL VOLATILITY
Source: BNY, Bloomberg
Our take
The correlation of oil to S&P 500 volatility is clear until March. The 2y rolling correlation of oil to the VIX has flipped from negative to positive this year – from -0.30 to +0.15 in April. The peak turning point came on March 6 when oil prices rose from $67 to $111 and the VIX moved from 19.8 to 31.0. This relationship held through the conflict but shifted again in April as the S&P 500 hit record highs and rose 9% for the month. There is a notable disconnect between the S&P 500 dispersion and the VIX. From March to April, the VIX fell from 29.50 to 19.25, while the dispersion index rose from 32.75 to 38.16. Some of this reflects the usual earnings seasonality, but structural factors are also at work. Market structure, including record index concentration, crowding in higher-volatility stocks, significant call option activity, and the growth of single-stock leveraged ETFs, all contribute to record dispersion and elevated single-stock volatility.
Forward look
Elevated dispersion relative to index volatility is a risk for investors through the remainder of earnings. The effects of the Iran conflict on earnings and outlooks have been uneven and will drive continued uncertainty. Oil’s correlation with stock volatility will not break unless there is a real truce and the Strait of Hormuz reopens. Oil supply concerns are rising and not falling. Markets are still watching oil prices as a guide to risk – effectively trading a 70% volatility commodity against a 20% stock market – leaving long-tailed risks should the conflict escalate.
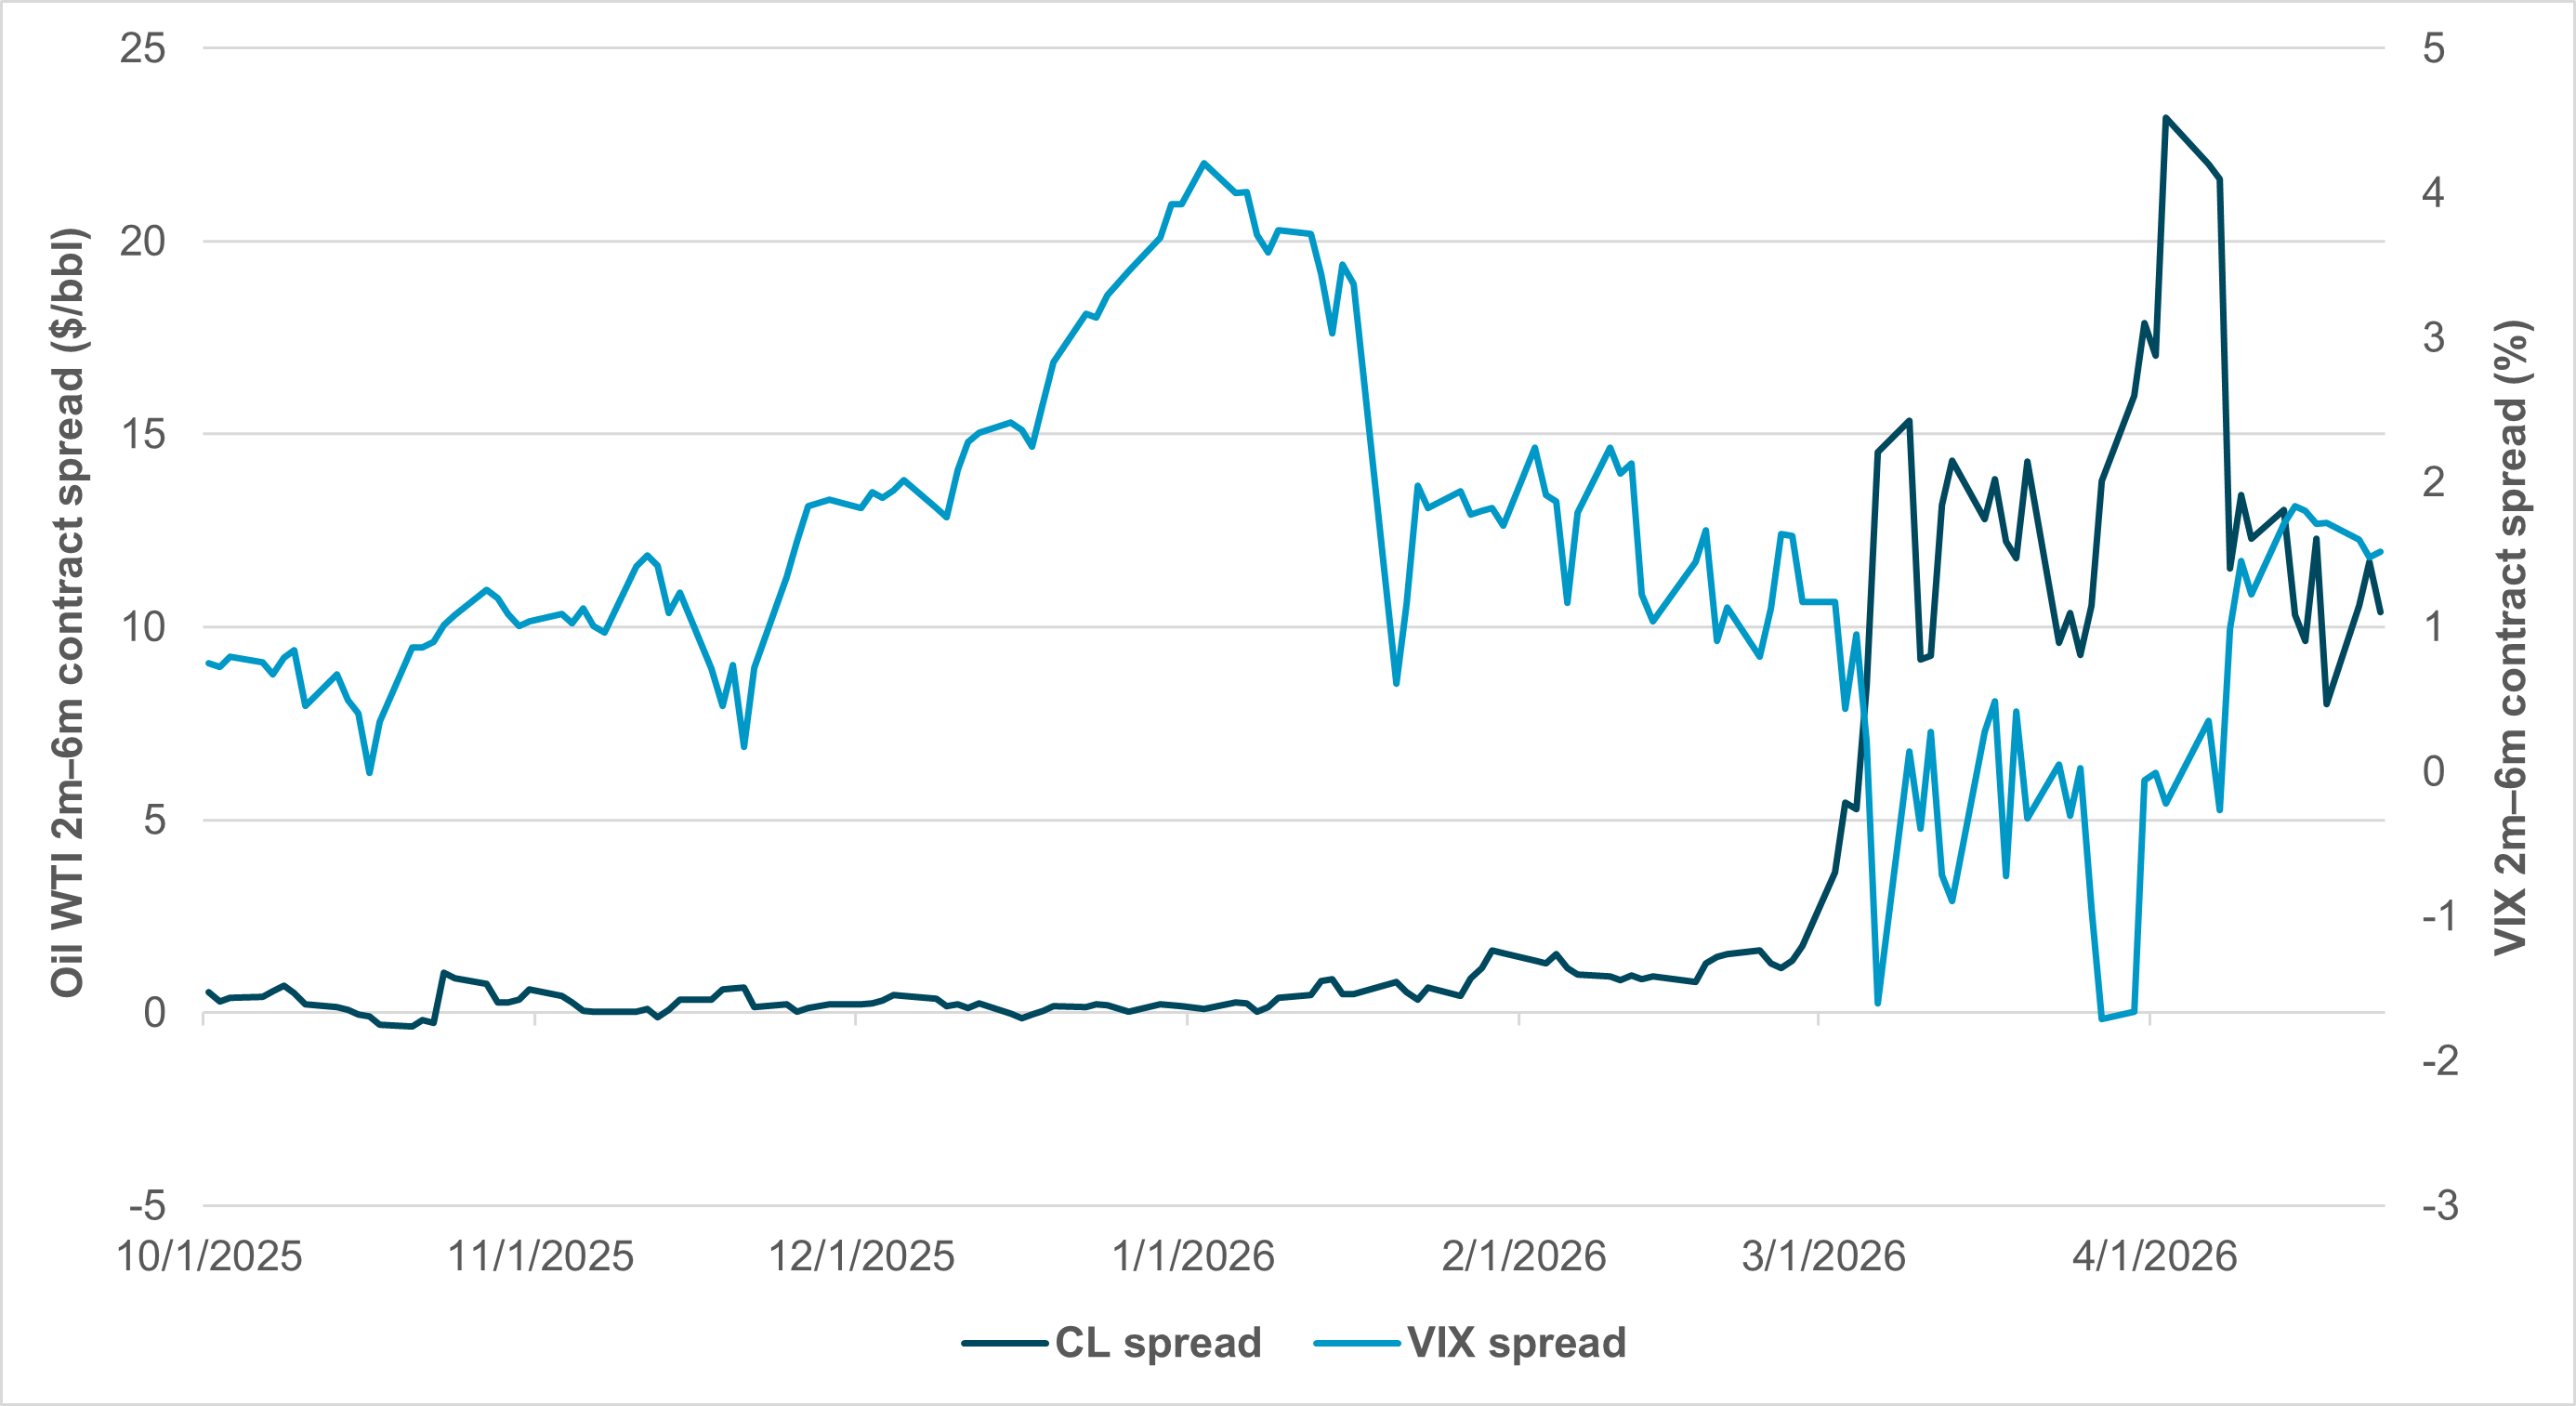
EXHIBIT #3: OIL CONTRACT SPREAD (2M VS. 6M) VS. VIX CURVE
Source: BNY, Bloomberg
Our take
The ceasefire holds for most of April, but oil markets are stalling – near-term demand remains sharply higher than six months out. The spread for 2m vs. 6m future oil prices was deadly dull for most of 2025. The ceasefire helped cap the worst backwardation in oil curves, but the current pricing remains extreme. The $10 May-over-July premium has been matched by options interests – selling July and August puts and buying back May–June contracts. The effect on the stock market has not been notable, but the steepening of the VIX curve has stopped and reversed, tracking the shift in oil sentiment. The correlation of oil to stocks is not just in cash but in the forwards.
Forward look
The market’s reaction to earnings could be changing as views on Iran conflict duration stall, leaving investors uncertain about positioning. Current oil prices matter, but longer-term oil costs also imply a prolonged period of uneven stock volatility, despite good earnings. The next test comes from big tech companies reporting earnings and outlooks. The rise in the SOX this week suggests investors have been looking through the conflict. Whether that holds will depend on how AI investment matches up against Q1 earnings and beyond.
First-quarter results, with about 25% reported, have been resilient, but the quality of the earnings season appears more mixed than headline beat rates suggest. The relatively narrow spread between reported earnings and expectations, combined with uneven second-quarter guidance, points to a market that is rewarding selective growth rather than broad-based cyclical strength. Sector leadership remains concentrated on semiconductors, AI-linked names, and parts of energy, while defense shares have yet to reflect the geopolitical demand backdrop. Looking ahead, the key variable for equity markets is whether oil volatility and geopolitical uncertainty begin to weigh more directly on forward estimates, valuation multiples, and risk appetite. Elevated dispersion suggests investors should expect a more selective and less forgiving market environment through the remainder of the quarter. If oil stabilizes and conflict risks ease, leadership could broaden further. If not, markets may continue to favor secular growth, pricing power, and balance-sheet resilience over pure macro or conflict-driven exposures.