AI earnings boom can outrun rates, oil and demand risk
iFlow > Equities
An in-depth look each Friday at the factors shaping equities markets in developed and emerging economies around the world.
iFlow > Equities
An in-depth look each Friday at the factors shaping equities markets in developed and emerging economies around the world.

Bob Savage
Time to Read: 5 minutes
First-quarter earnings were exceptionally strong, with S&P 500 profits rising 27.5% y/y and roughly 90% of companies beating expectations, an outcome typically seen only during post-recession rebounds. What makes this episode unusual is that it occurred outside a recovery cycle, with equity markets rising nearly 30% over the same period – an extreme move by historical standards.
While the rally appears fundamentally supported, it’s increasingly narrow. Profit growth has outpaced nominal GDP, and market gains have been heavily concentrated in a small group of AI-driven mega-cap companies. This suggests the current expansion is less a broad-based economic recovery than an AI-led operating leverage cycle.
The key question now is whether this dynamic is sustainable. With real policy rates still accommodative, the equity-bond balance remains sensitive to inflation, Federal Reserve policy, and demand destruction. At the same time, elevated energy prices, weak consumer sentiment, and rising producer prices point to growing margin pressures beneath the surface.
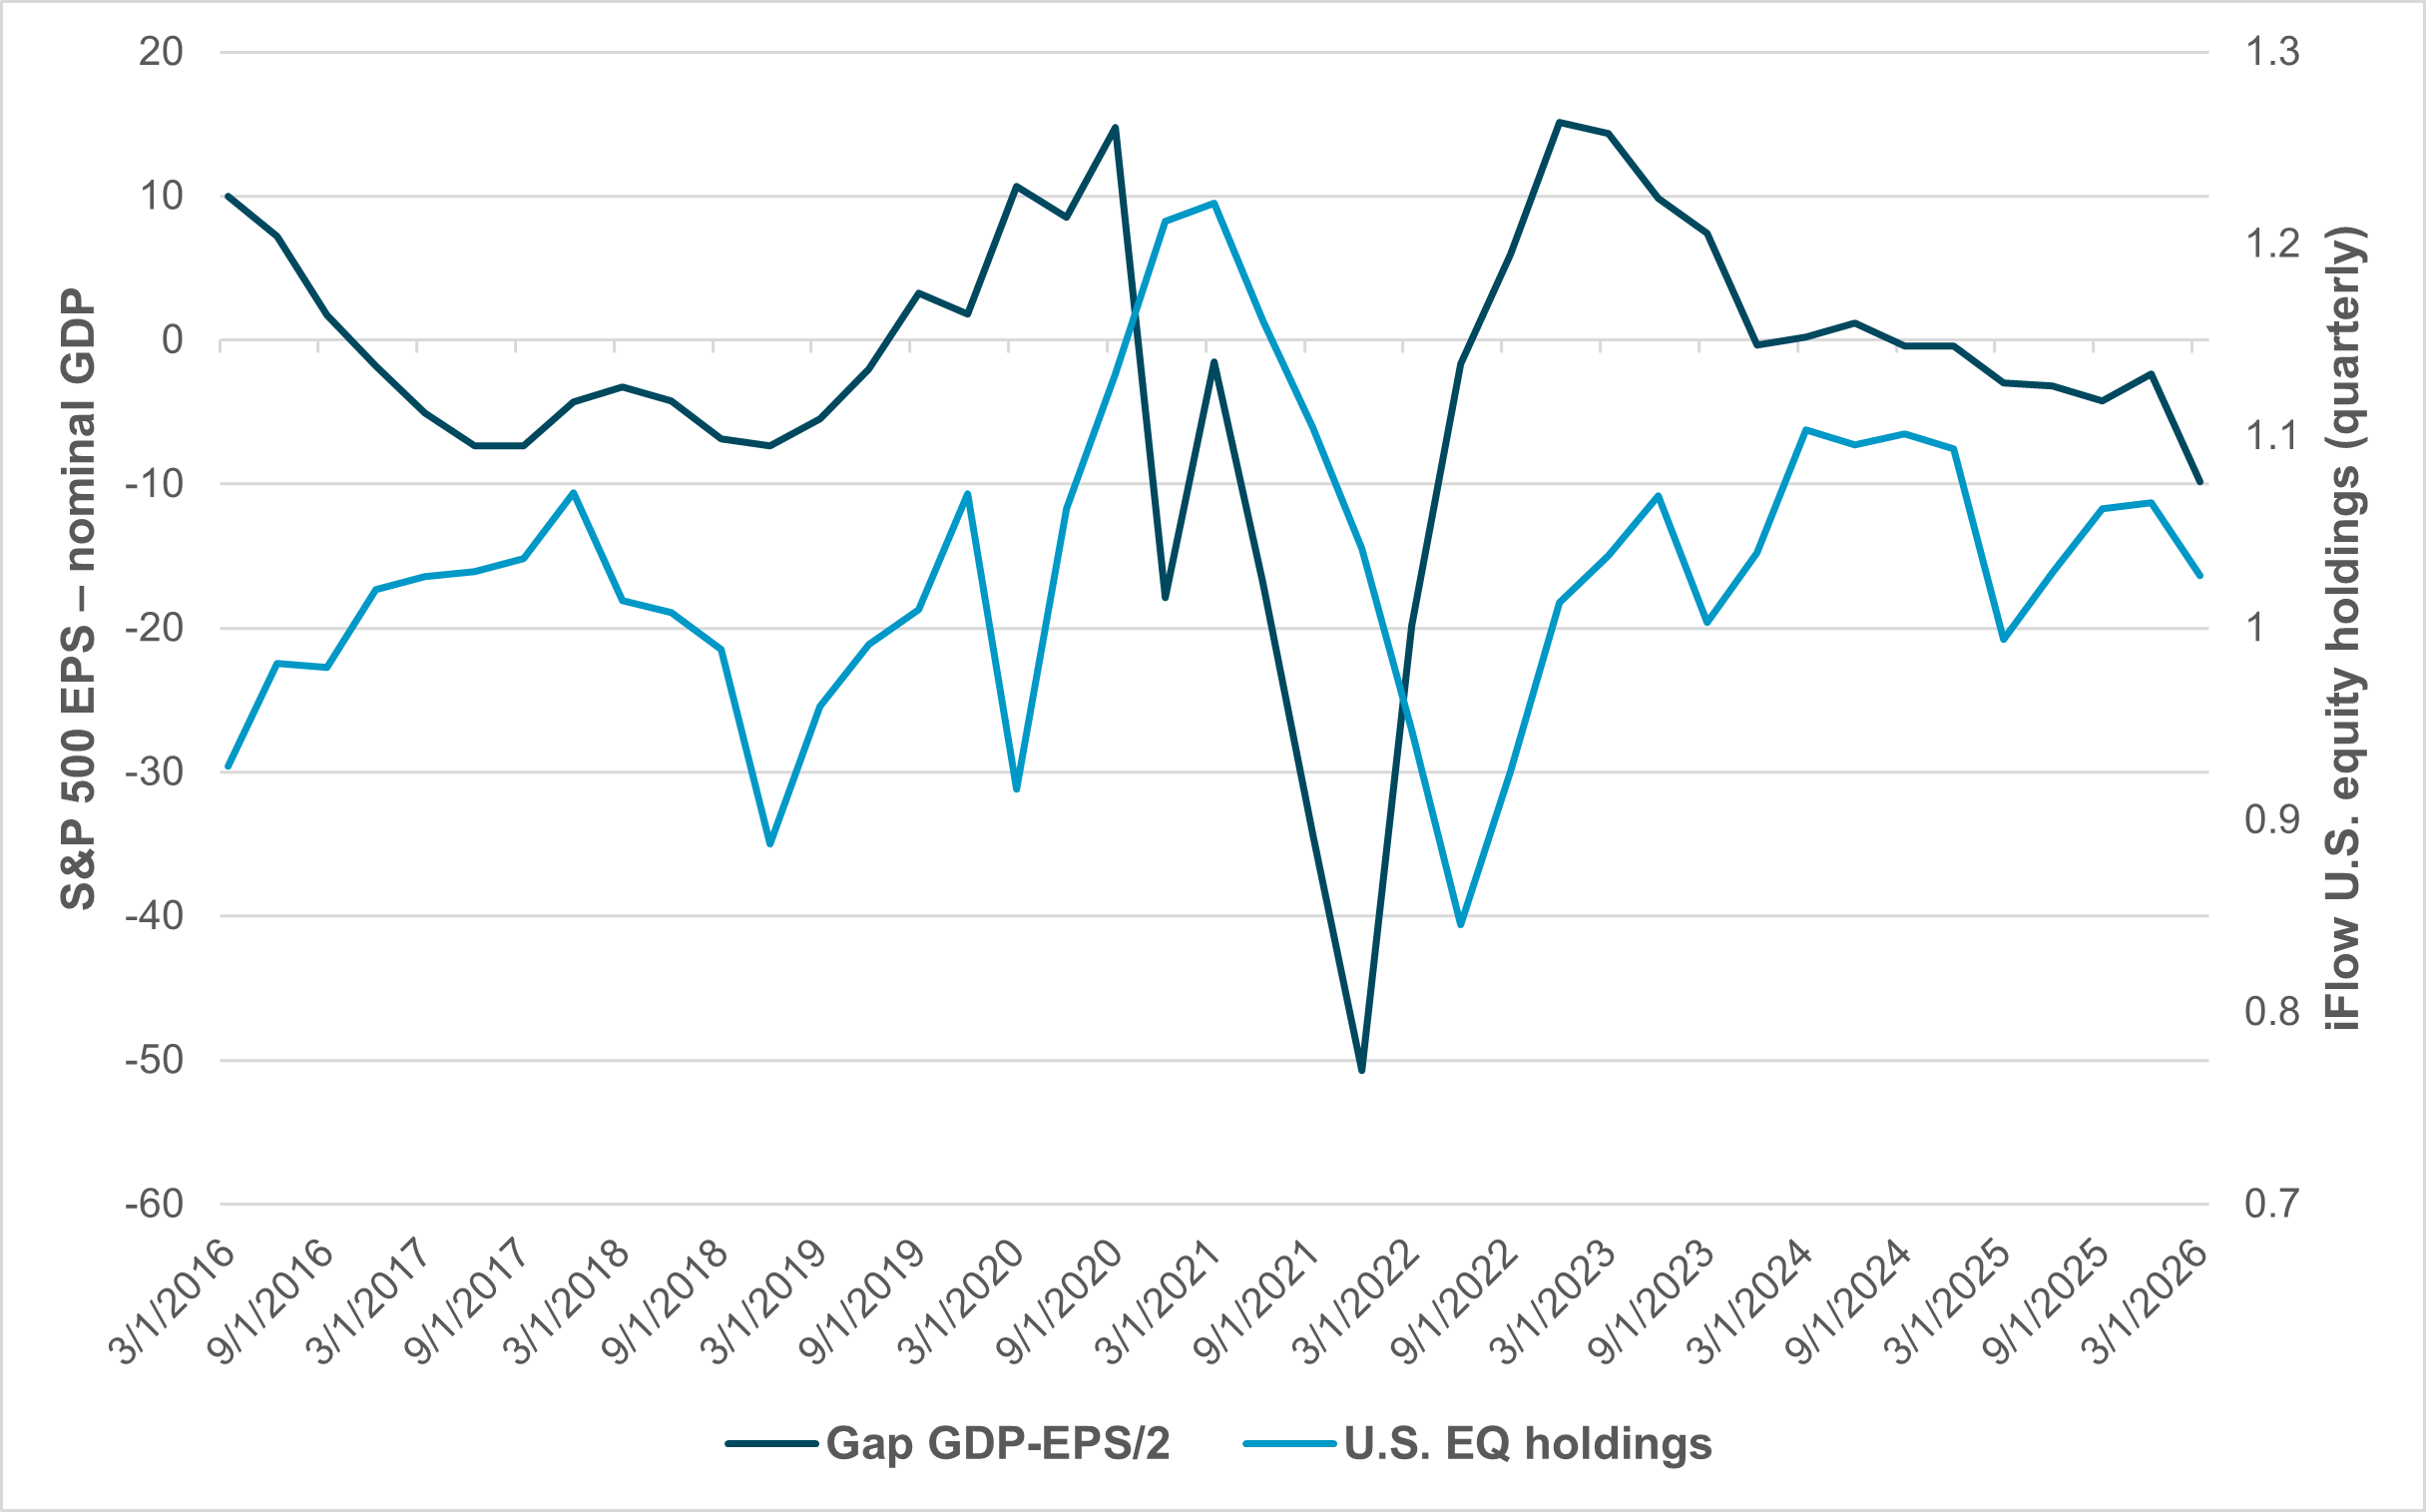
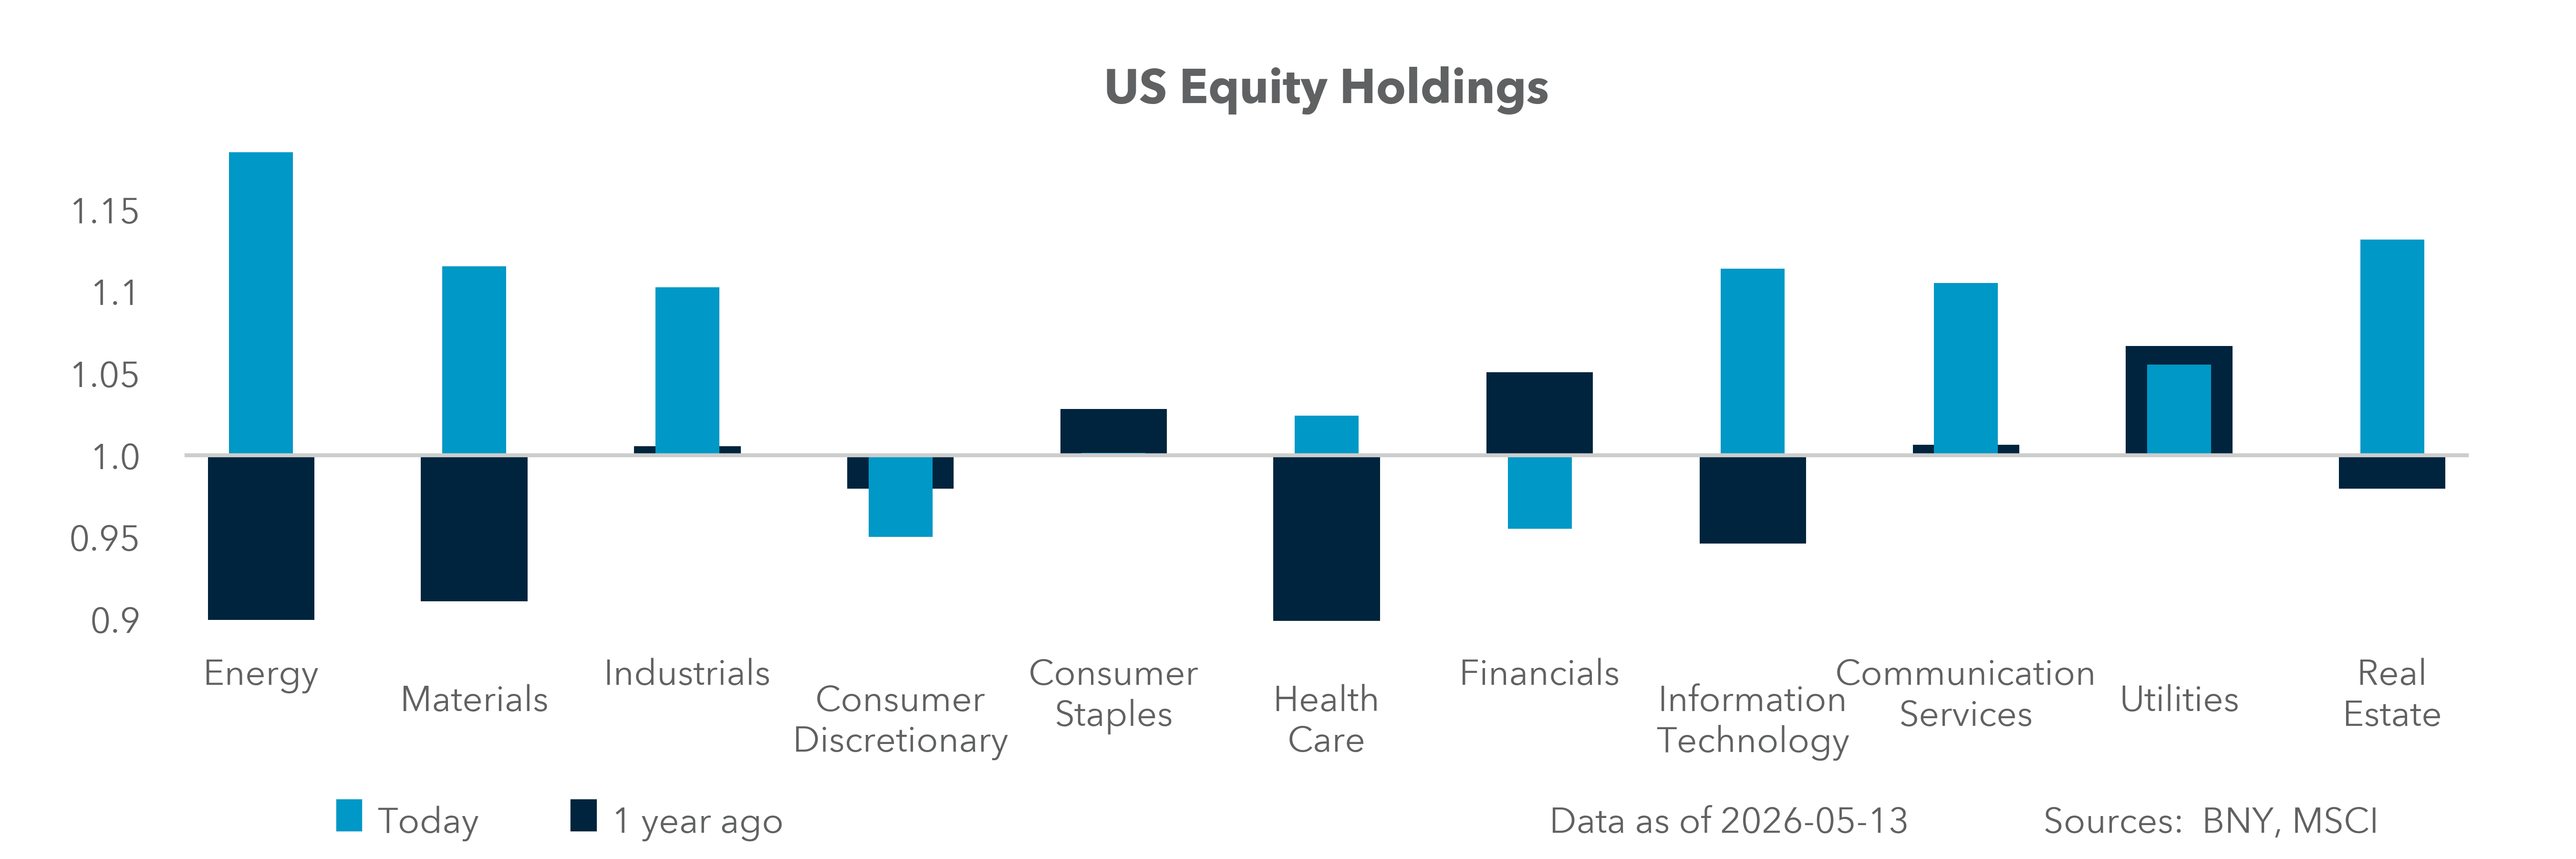
EXHIBIT #1: S&P 500 EPS vs. nominal GDP and U.S. equity holdings
Source: BNY, S&P, Bloomberg
Our take
Nominal GDP in Q1 is running at 6% y/y – a figure that compounds inflation and real growth over the last four quarters. The S&P 500 Q1 earnings came in at 27.7% y/y (using blended returns), putting the spread at 22%. The long-term debt/EBITDA average for the S&P 500 is 2.0, with leverage typically rising late cycle, spiking during earnings shocks – like Covid – and normalizing during recoveries. The last 10 years have seen a 1.6–2.8 range.
For the exhibit above, we divided earnings by 2 to better illustrate the gap between the economy and the stock market. We’re not at historical levels yet, but we are near levels that only occur after a crisis. The EPS of the S&P 500 in 2010 after the Great Financial Crisis jumped more than 700%; in 2021, after Covid, it touched 110%. Higher earnings correlate with future equity holdings, with a lag of about 1.5 quarters. We see our U.S. equity holdings declining even as the index reaches new highs.
Forward look
The Q1 2026 gap usually means earnings are outrunning the macro cycle, so the next phase is often earnings-growth normalization, not necessarily an immediate equity decline. The playbook of this pattern:
The key point for Q1 breadth is that earnings were widespread, but the market rally has been led by IT and Communications. This looks more like an AI-driven operating leverage boom than a broad GDP expansion. The current episode is notable because it’s happening outside a classic deep recession rebound.
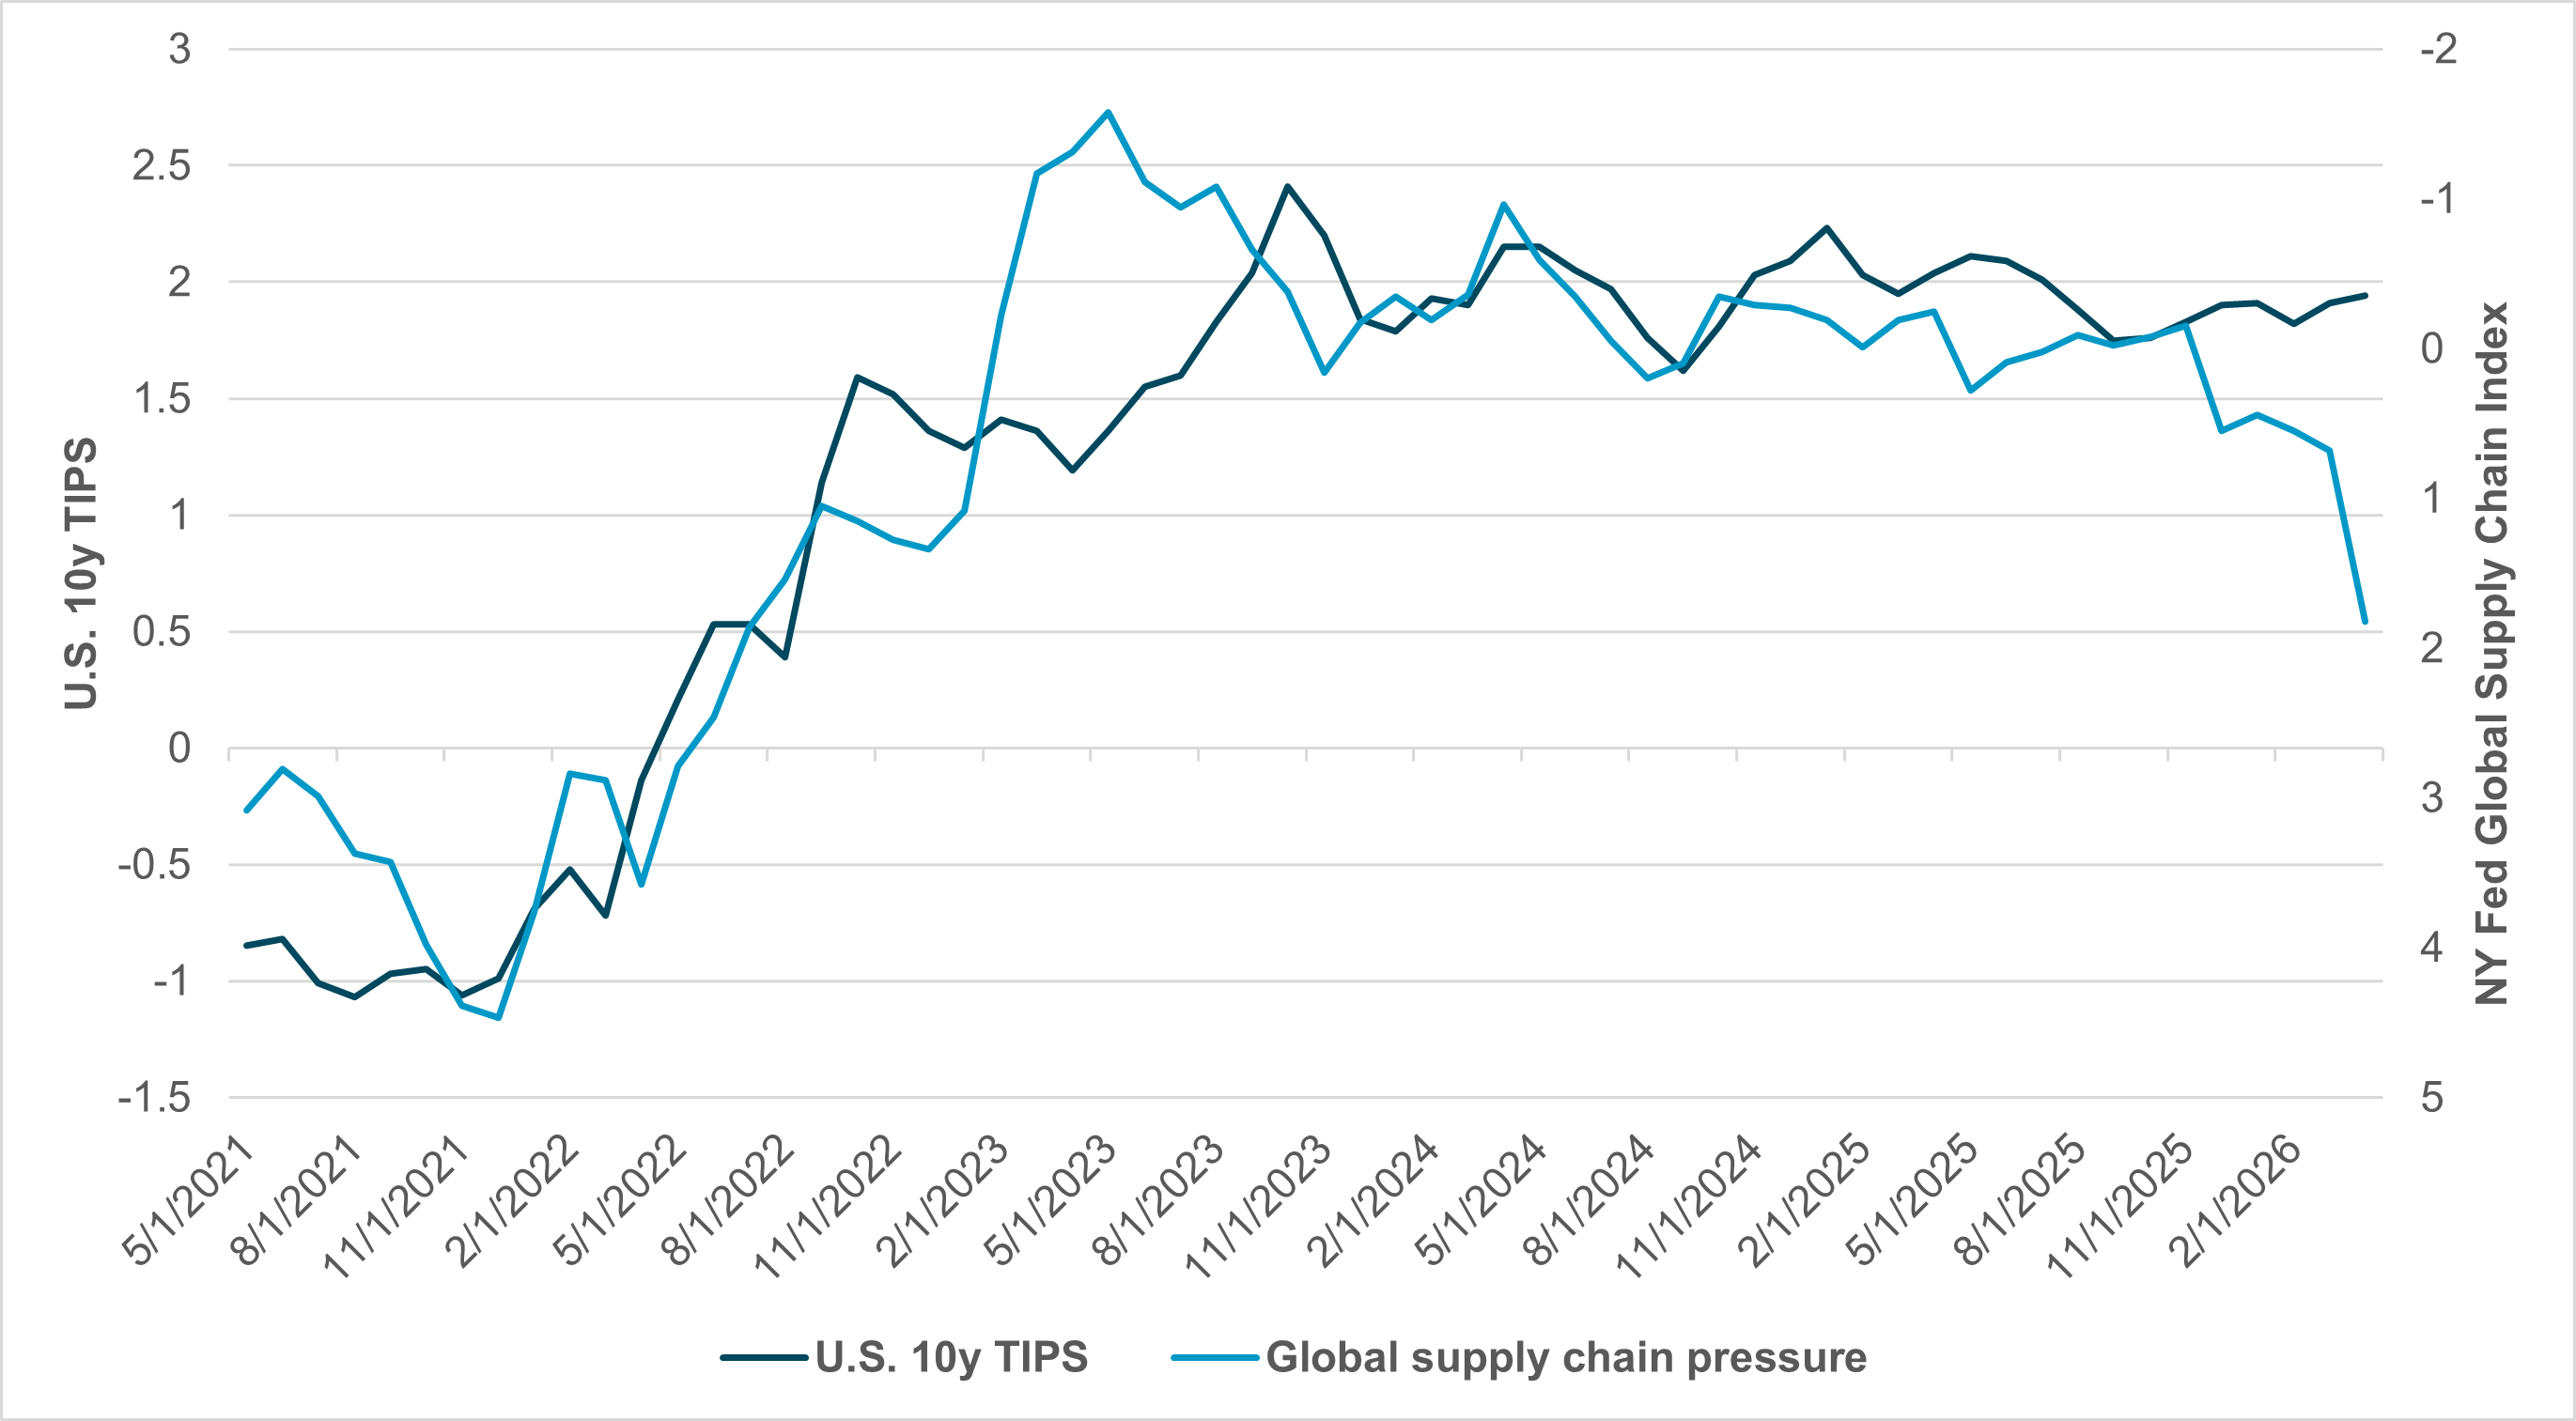
EXHIBIT #2: U.S. REAL RATES VS. GLOBAL SUPPLY CHAIN
Source: BNY
Our take
The NY Fed supply chain index measures global supply stress and its potential inflationary impact on a monthly basis, with zero as the normalized baseline. The U.S. 10y TIPS reflect long-term inflation expectations. Mapping the Covid supply shock against TIPS makes clear that the current oil shock is significant. The implication is that we may be nearing a point of demand destruction rather than sharply higher inflation.
Forward look
Markets often shift toward higher-for-longer if earnings strength suggests the corporate sector can absorb tighter financial conditions. Oil and supply chain fragility caused by the current Iran conflict are not yet of the same magnitude as Covid. We are about halfway to that level of disruption. The role of real rates in reflecting this stress is modest, and rate hikes priced in after the U.S. CPI and PPI data will likely not address the oil price shock.
The equation of consumer pain to oil sector gain is complex.
The interaction between Fed policy, financial conditions and above-target core PCE will be critical. Determining the rate level that will matter to financial conditions requires balancing equity price momentum against consumer malaise and corporate margins.
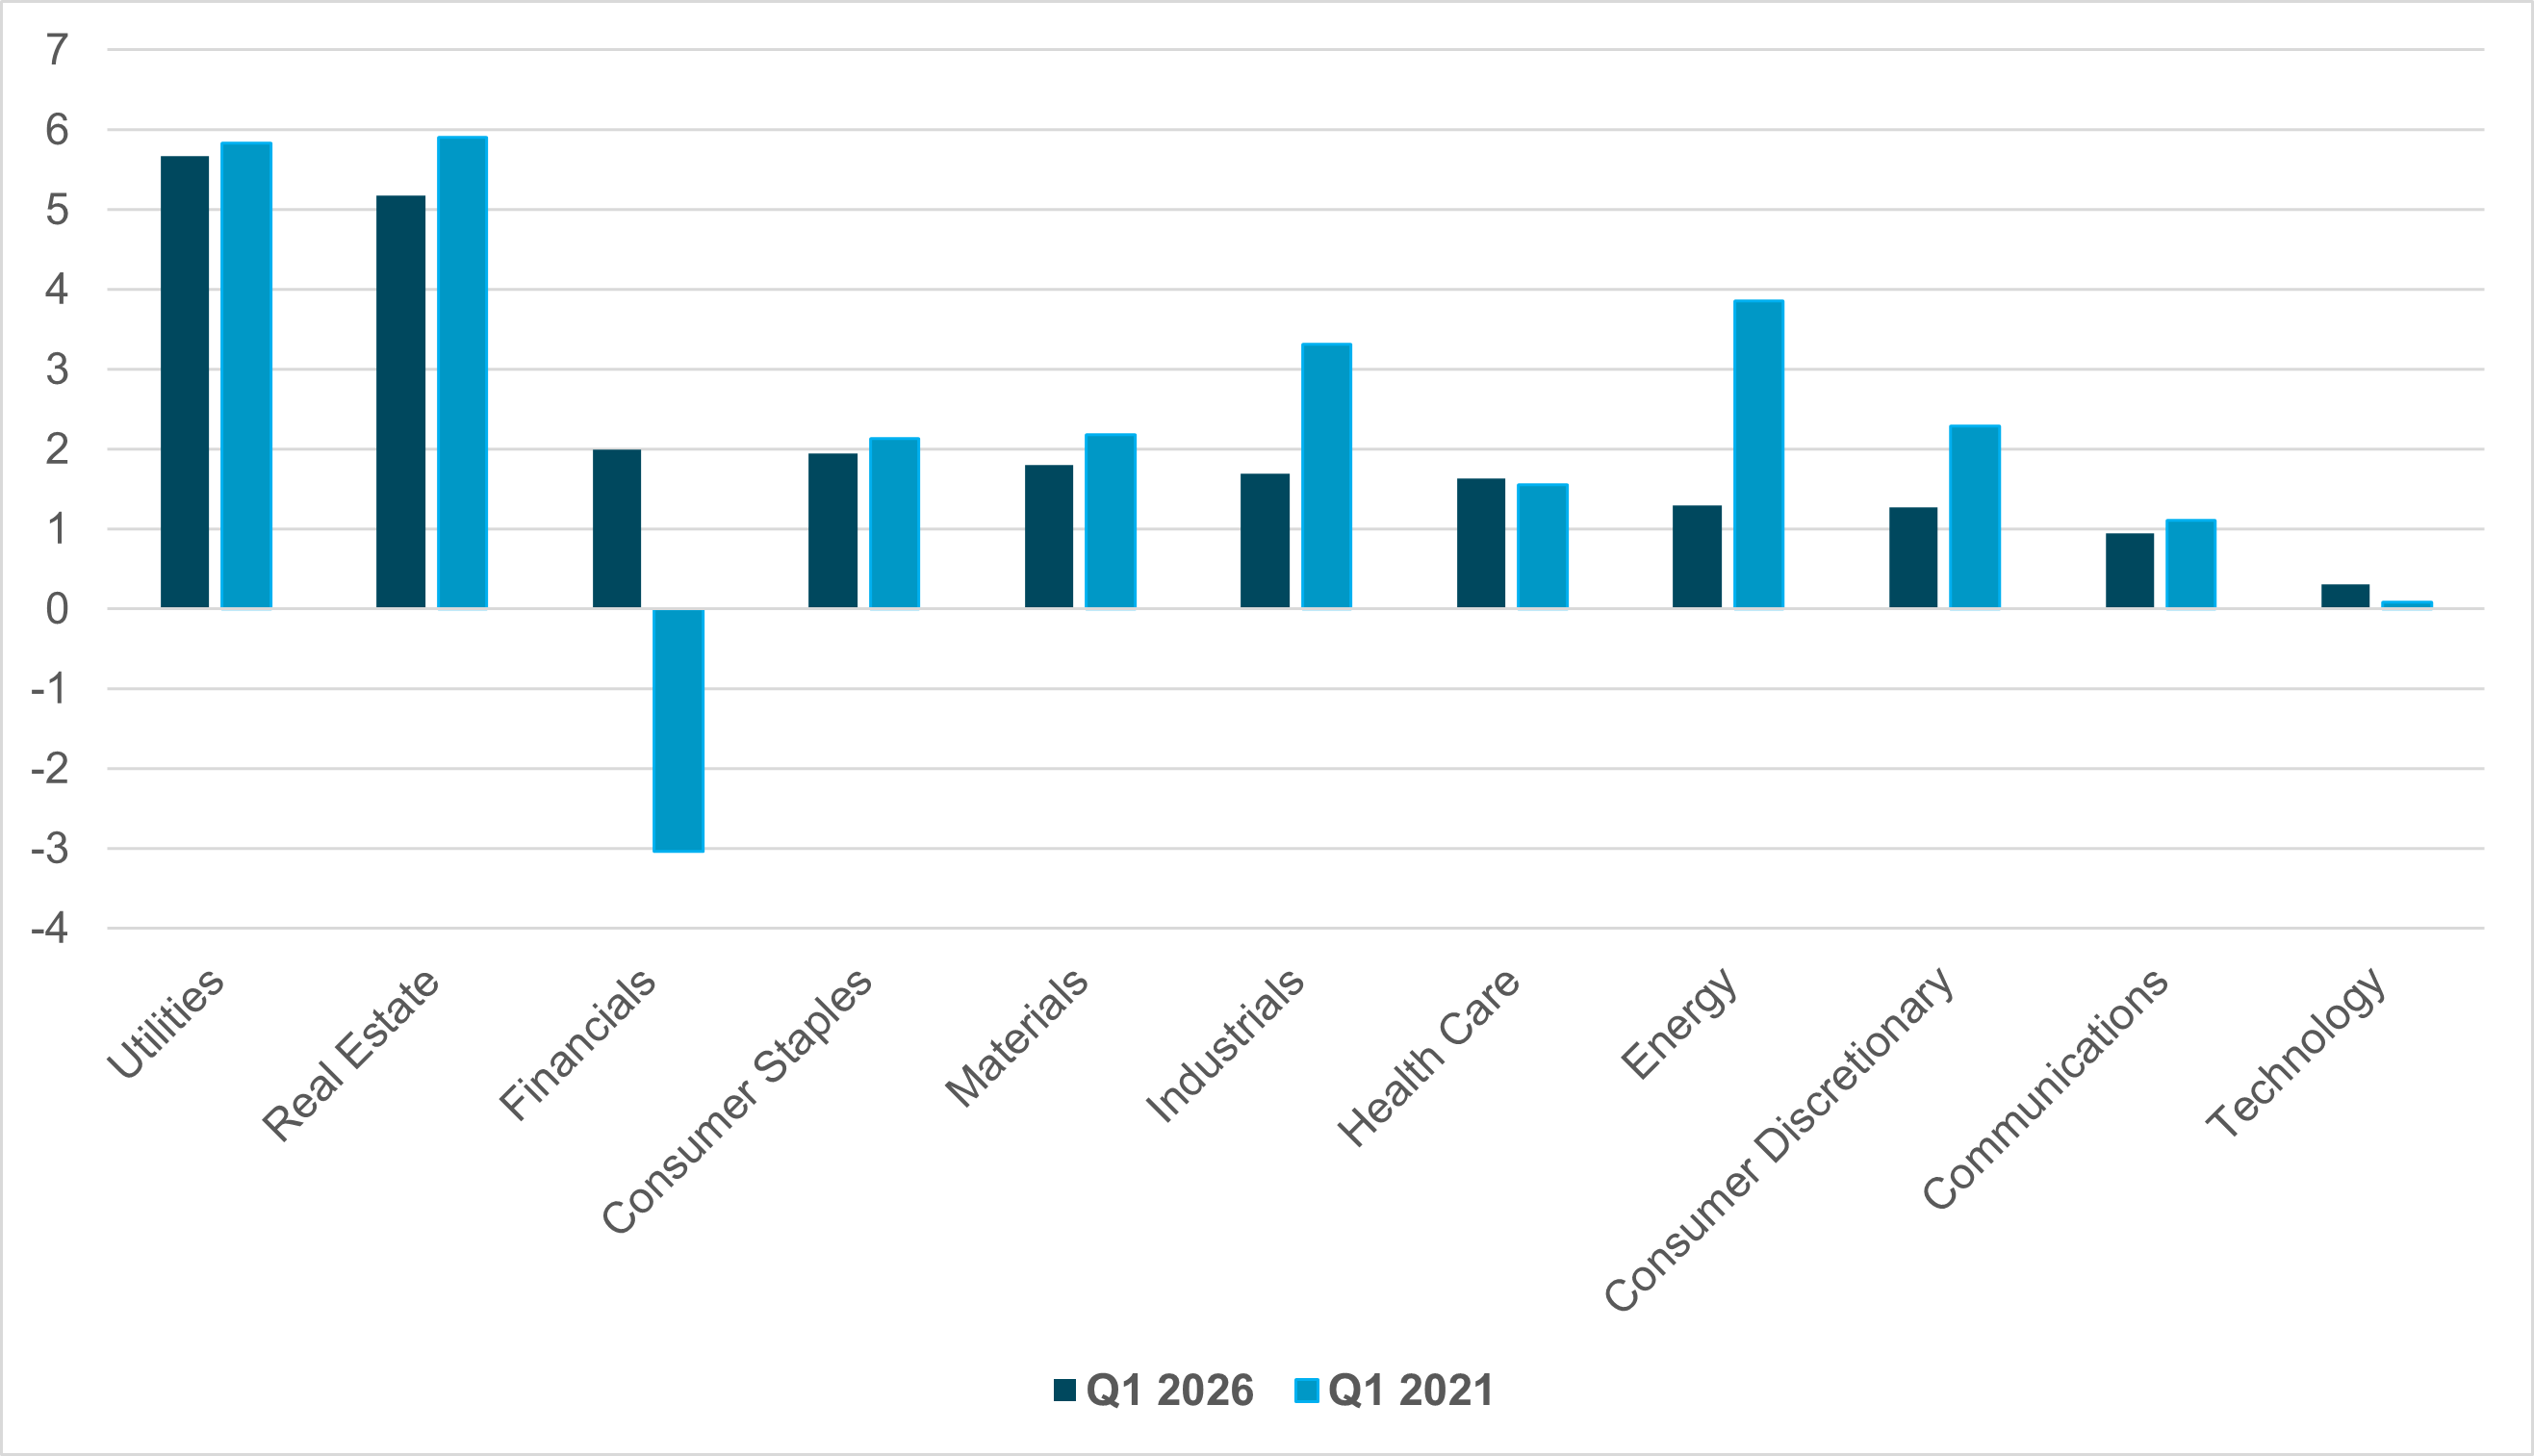
EXHIBIT #3: U.S. DEBT TO EBITDA BY SECTOR
Source: BNY, Bloomberg
Our take
The inflation shock that followed the Covid supply shock drove stocks and bonds to correlate positively. Higher real yields notably hurt the tech sector. Other duration-heavy sectors also suffered. Utilities, REITs and consumer staples were pressured as higher yields reduced their relative income appeal and increased financing costs. The leaders of that inflation spike were in financials, where heavy government Covid payments lifted bank deposits, and in energy, where returns rebounded. The period from 2024 to present has been defined by Fed policy shifts – in which rate levels mattered less than the pace of normalization. Growth resilience helped industrials and financials first, but renewed inflation fears may revive duration concerns, leaving tech, utilities and REITs vulnerable again.
Forward look
The first-phase reaction to earnings spikes and inflation is often index resilience, because strong earnings can justify high multiples for a while. Equities are seen as an inflation hedge. The next phase is frequently consolidation or narrowing leadership, especially if earnings growth is concentrated.
Historically, gaps between the economy and earnings mean lower forward returns and more dependence on a shrinking group of leaders. The key variable is rates: the current hyperscaler investment will broaden if real rates remain slightly negative, led by energy, financials and industrials. However, if the U.S. earnings roll over due to demand destruction, expect a return to defensive plays in utilities, real estate and consumer staples – with IT and communications normalizing toward the S&P 500’s long-term 18x P/E target.
Historically, wider earnings gaps in the real economy have led to higher yield pressures or sticky rates, more selective equities, and more sector rotation away from the narrowest leadership before any broader defensive turn.
The most likely path forward is not an immediate reversal in U.S. equities, but a transition to a more selective and valuation-sensitive market environment. Strong earnings – particularly those tied to AI investment and operating leverage – can continue to support index levels in the near term, especially if capital spending remains robust across technology, industrials, and parts of financials.
However, the widening gap between earnings growth and the broader economy suggests that forward returns are likely to moderate unless upcoming quarters show a meaningful broadening beyond a narrow group of mega-cap leaders. From here, market direction will depend increasingly on the interaction between real rates, energy-driven financial conditions, and the resilience of the consumer.
If rates remain only modestly restrictive and productivity gains expand beyond the largest firms, cyclical leadership can persist. But if inflation re-accelerates or demand weakens further, expect narrower leadership, greater sector rotation, and a gradual shift toward companies with stronger balance sheets, durable cash flows, and lower sensitivity to valuation compression.