active vs. passive
Equities provides an in-depth look each Friday at the factors shaping equities markets in developed and emerging economies around the world.
Equities provides an in-depth look each Friday at the factors shaping equities markets in developed and emerging economies around the world.

Bob Savage
Time to Read: 5 minutes
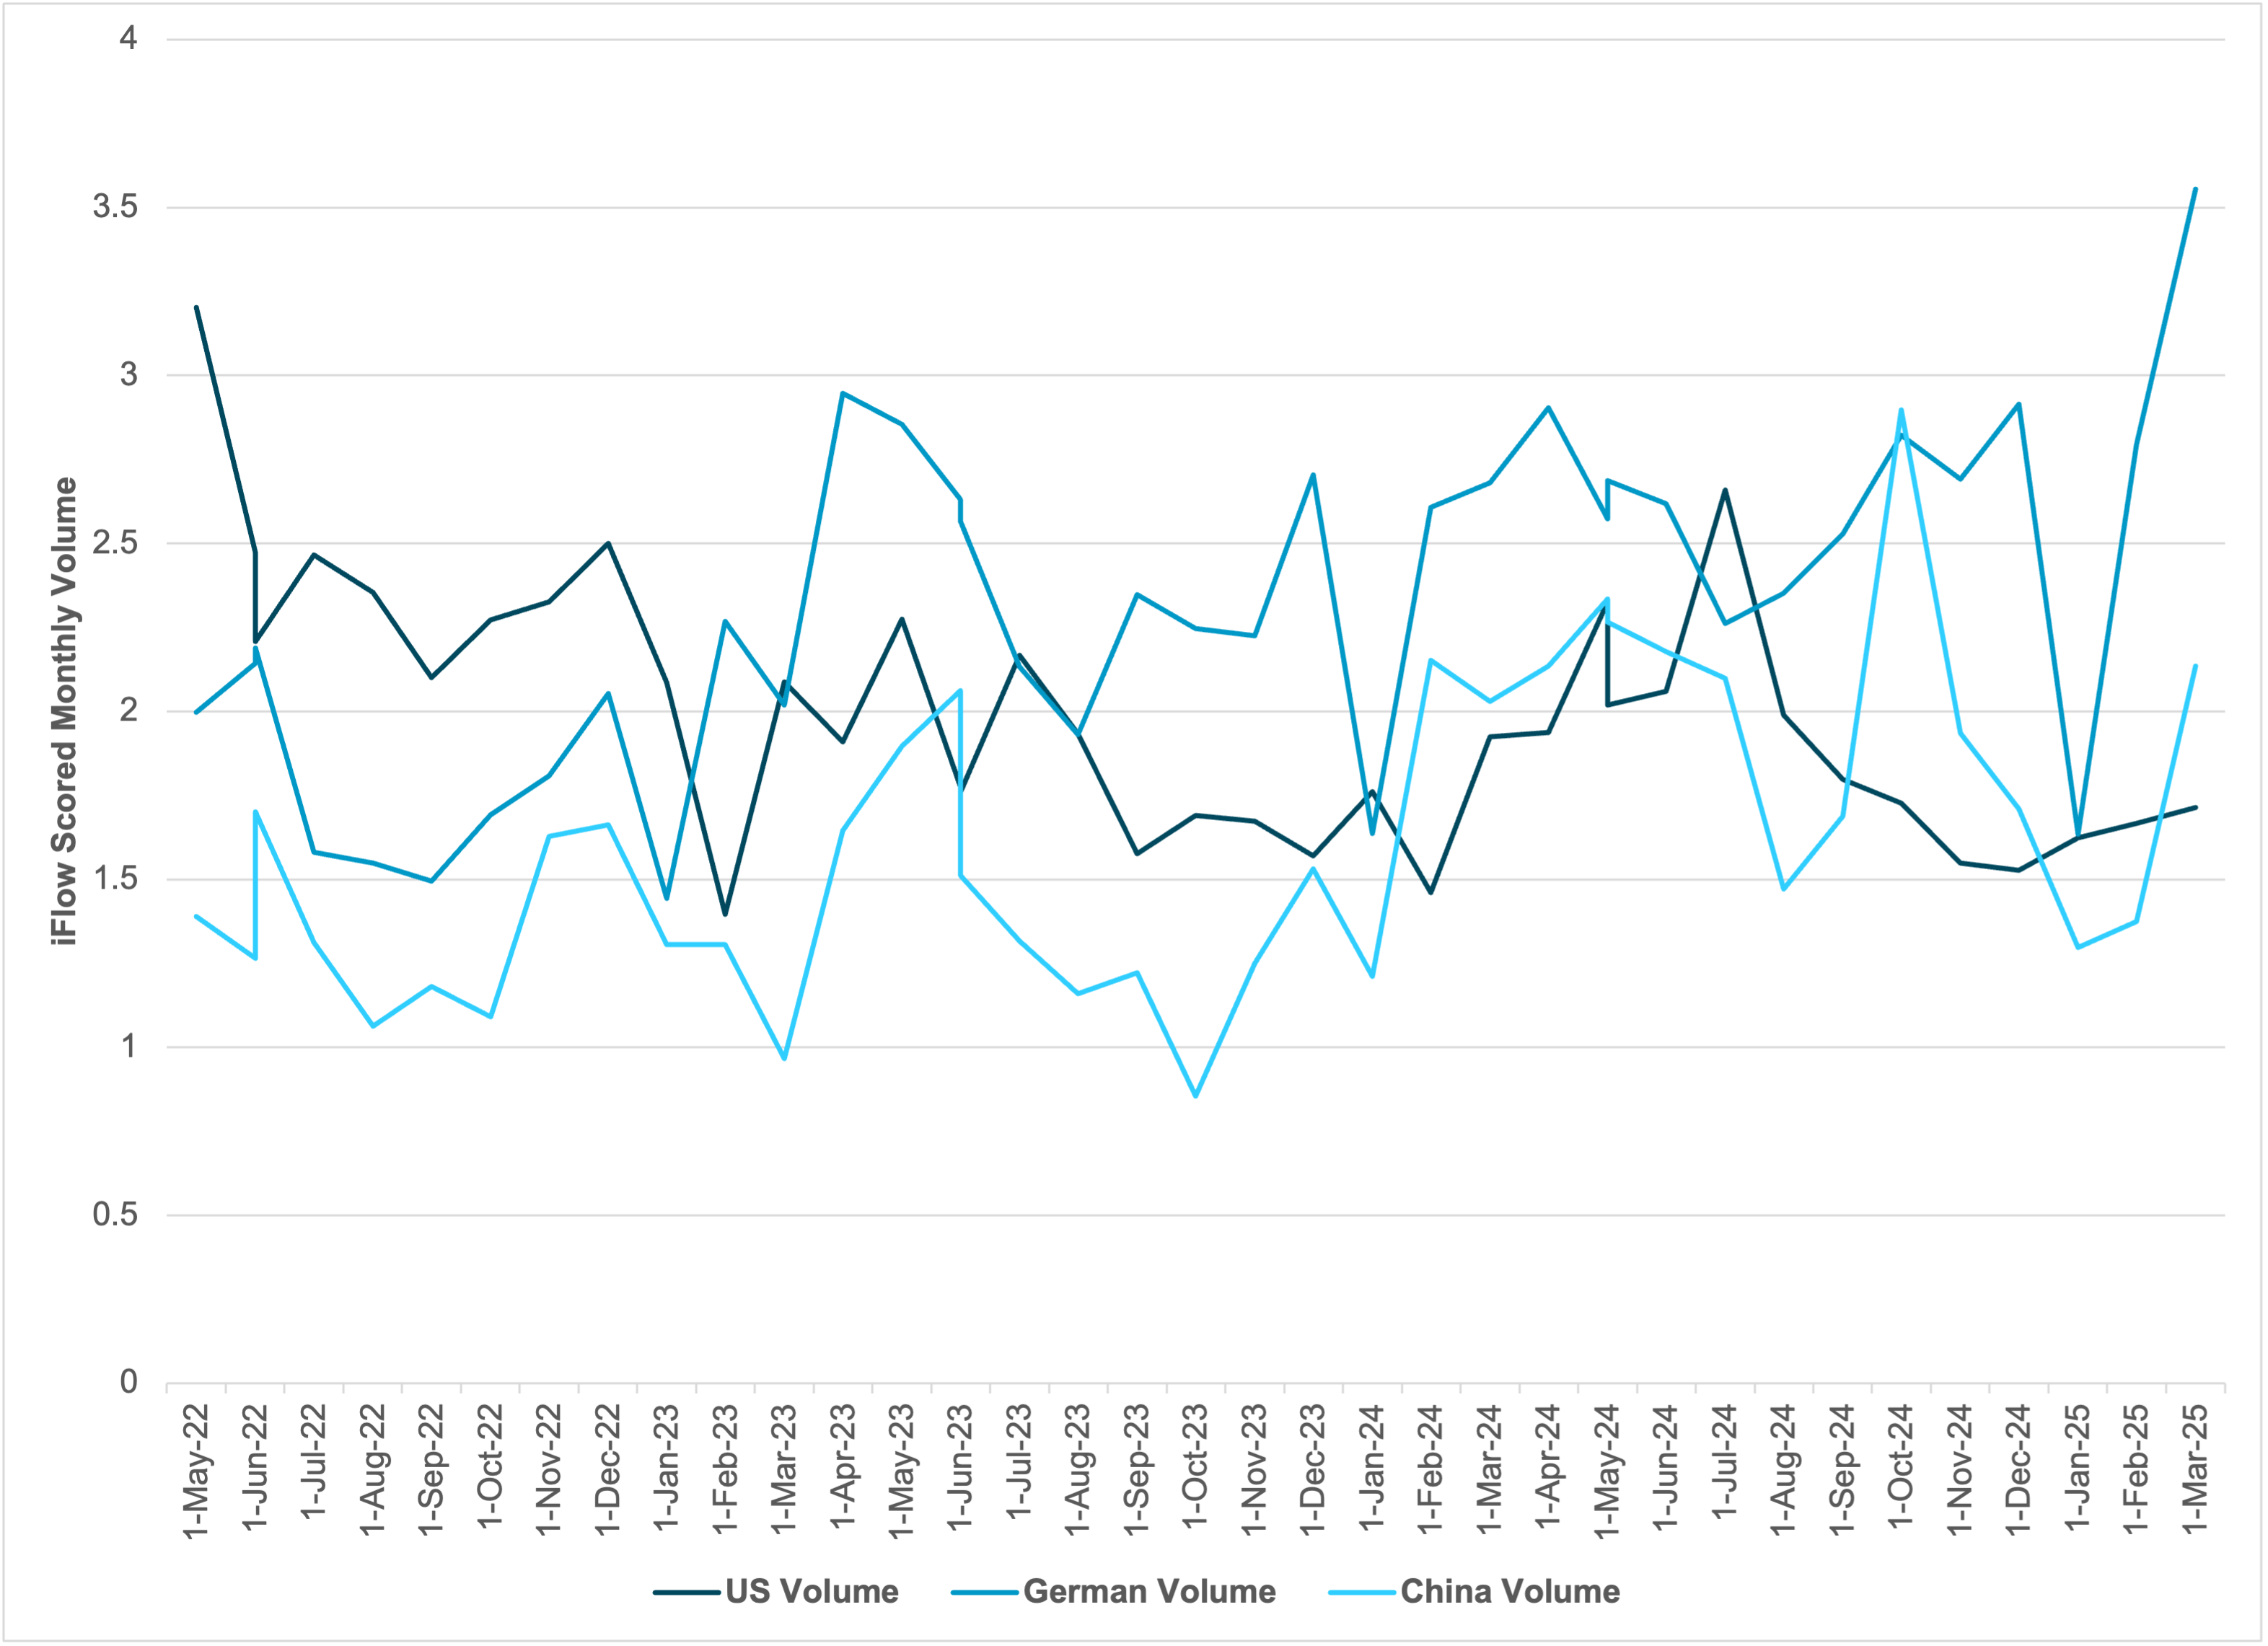
EXHIBIT #1: VOLUMES OF EQUITIES - GERMANY, CHINA, US
Source: BNY iFlow
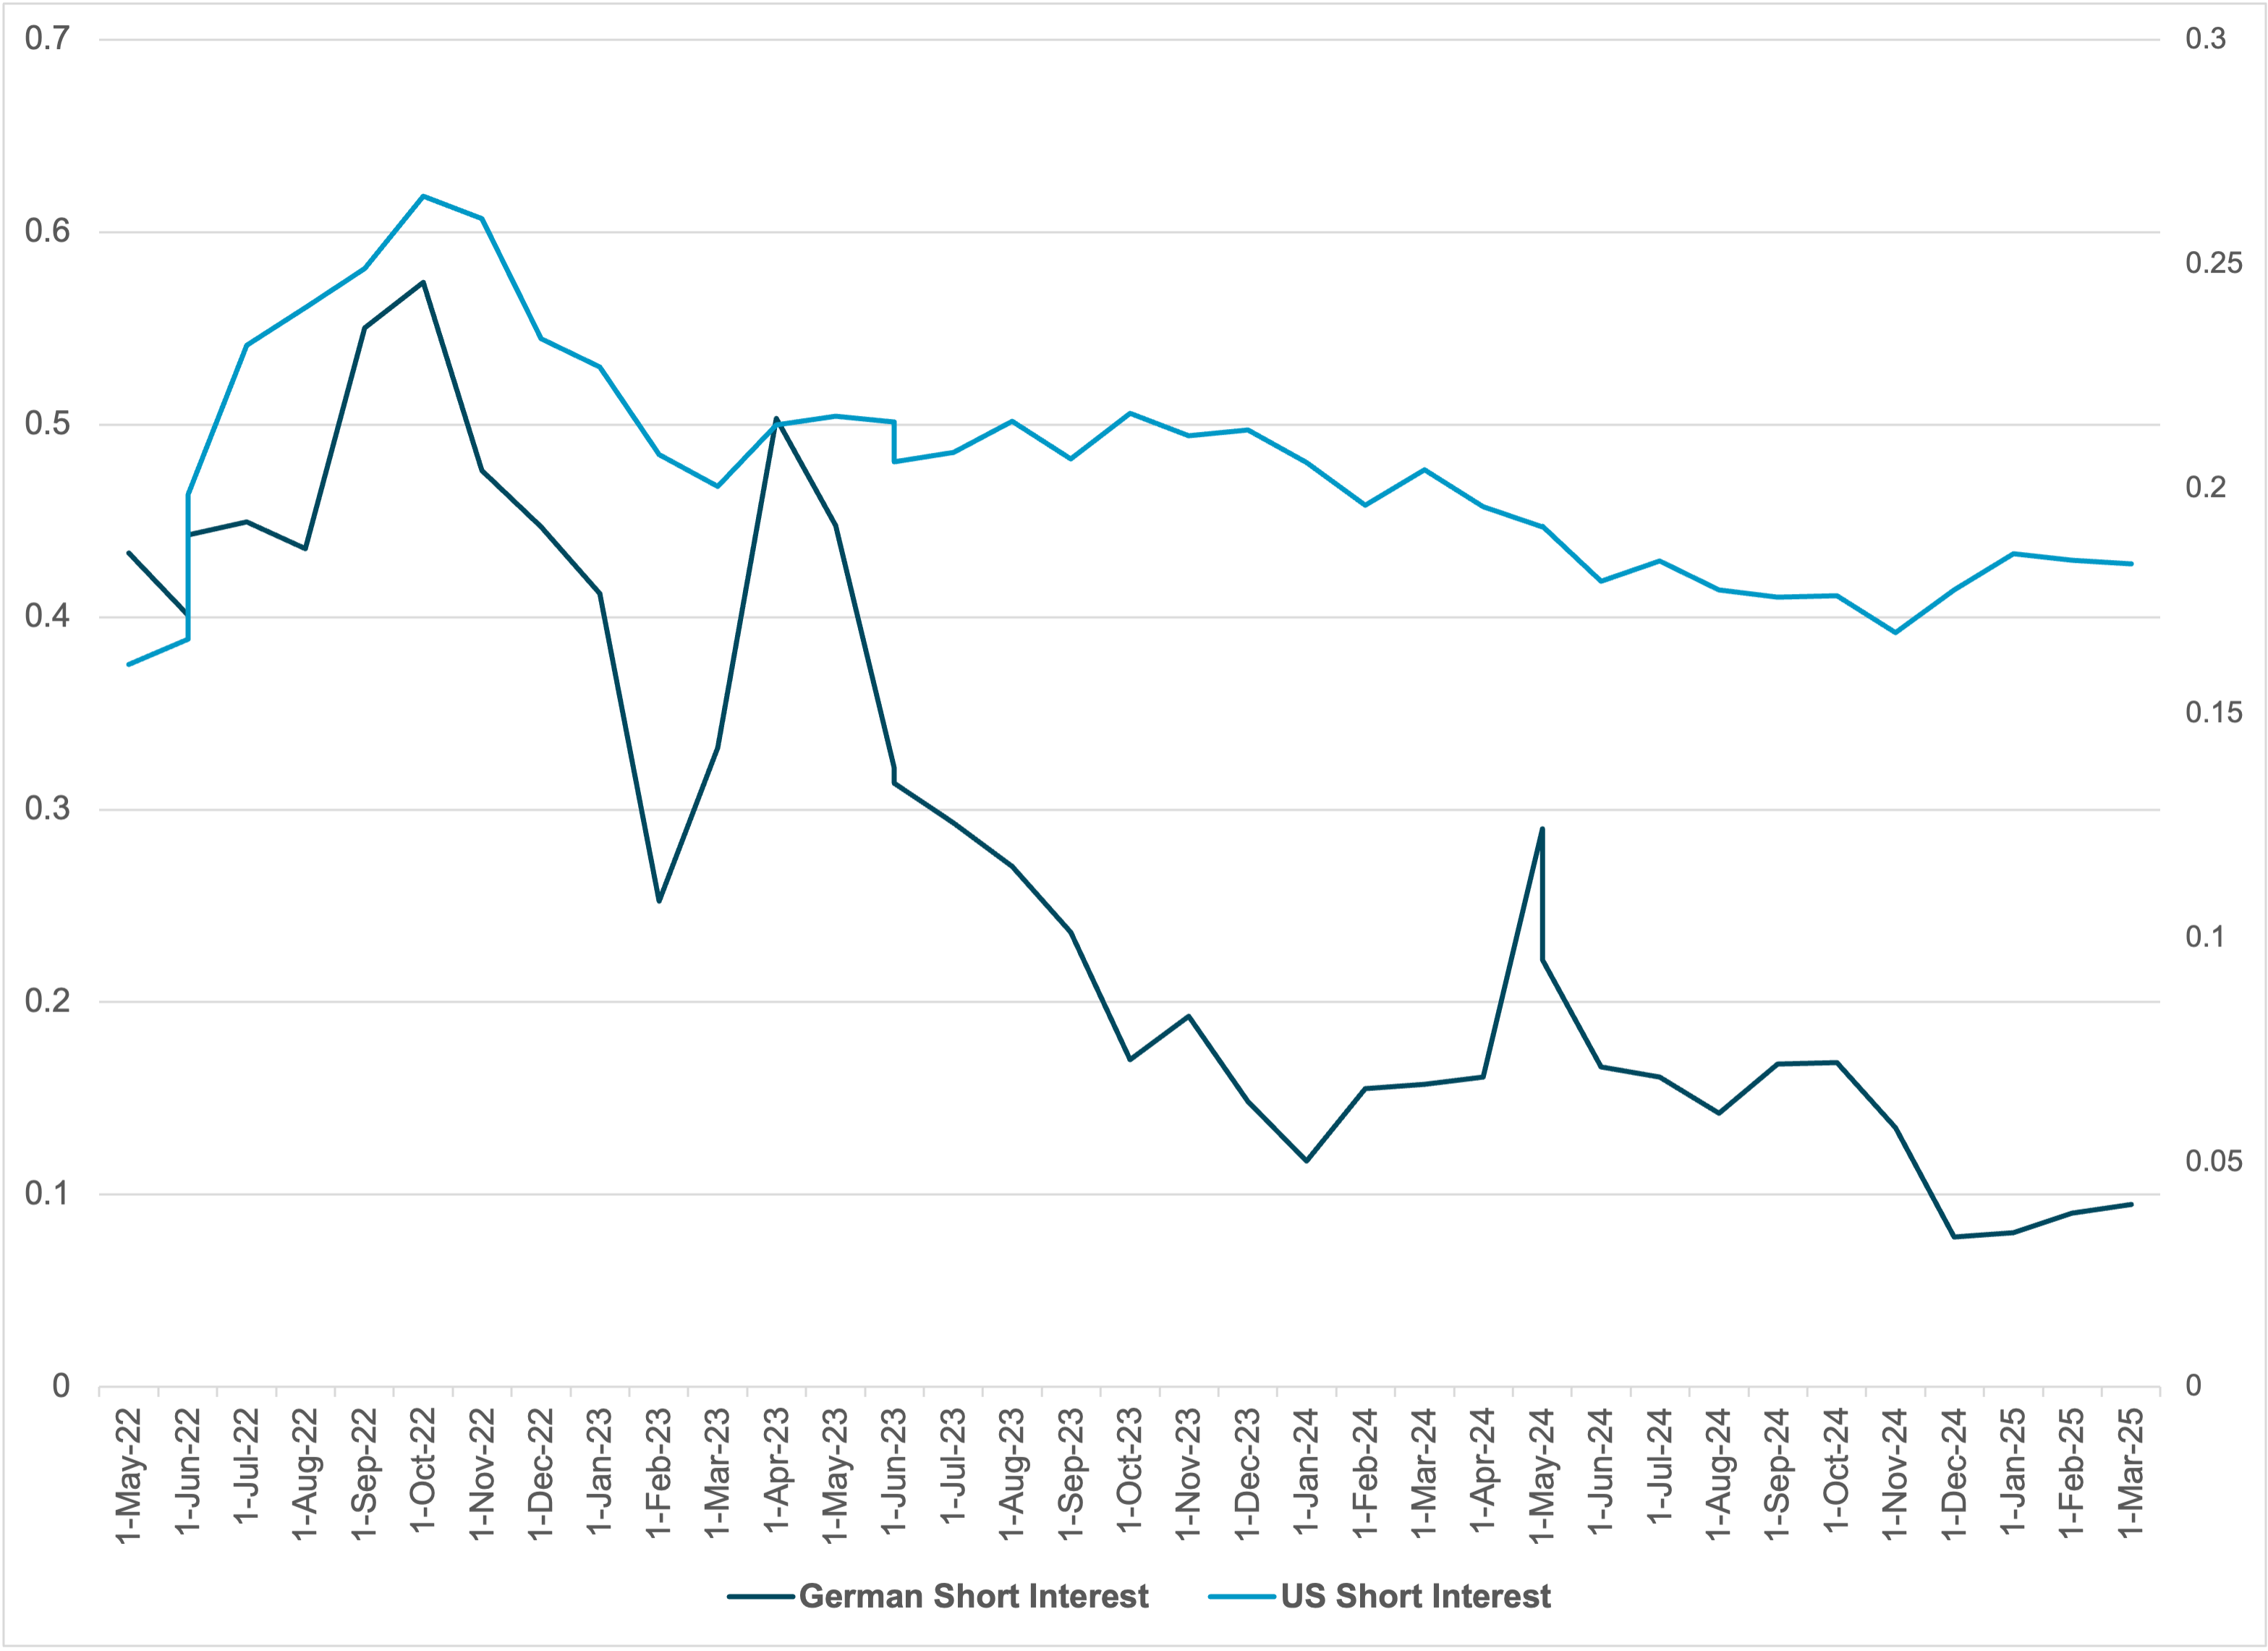
EXHIBIT #2 : SHORT EQUITY FLOWS- GERMANY VS. US
Source: BNY iFlow
The price action across markets suggests fear is bottoming out, but unlike previous quick corrections the bounce back in risk-taking may require more time to take hold. The lack of volume in US markets and the tepid volume in China highlight that the selling of US tech and buying of Chinese tech is not extraordinary. Rotational shifts are not drivers of significant volatility. Rather, the move up in Europe is the biggest surprise and that positive move could be reversed than US or China shares bounce back.
Our take
The risk for Q2 equities for US investors depends on how the rest of the world performs with tariffs, policy responses from central bankers and hedging demand. The biggest risk investors face in the weeks ahead is a potential reversal of EU shares, which have seen inflows increase by two standard deviations. Whether this risk plays out will be determined by earnings, the ongoing Ukraine peace negotiations and the role of government stimulus matched with ECB easing to support growth. Further, when looking at iFlow short equity flows we can see that Europe has seen a significant drop in short positioning – suggesting less upside ahead.
Forward look
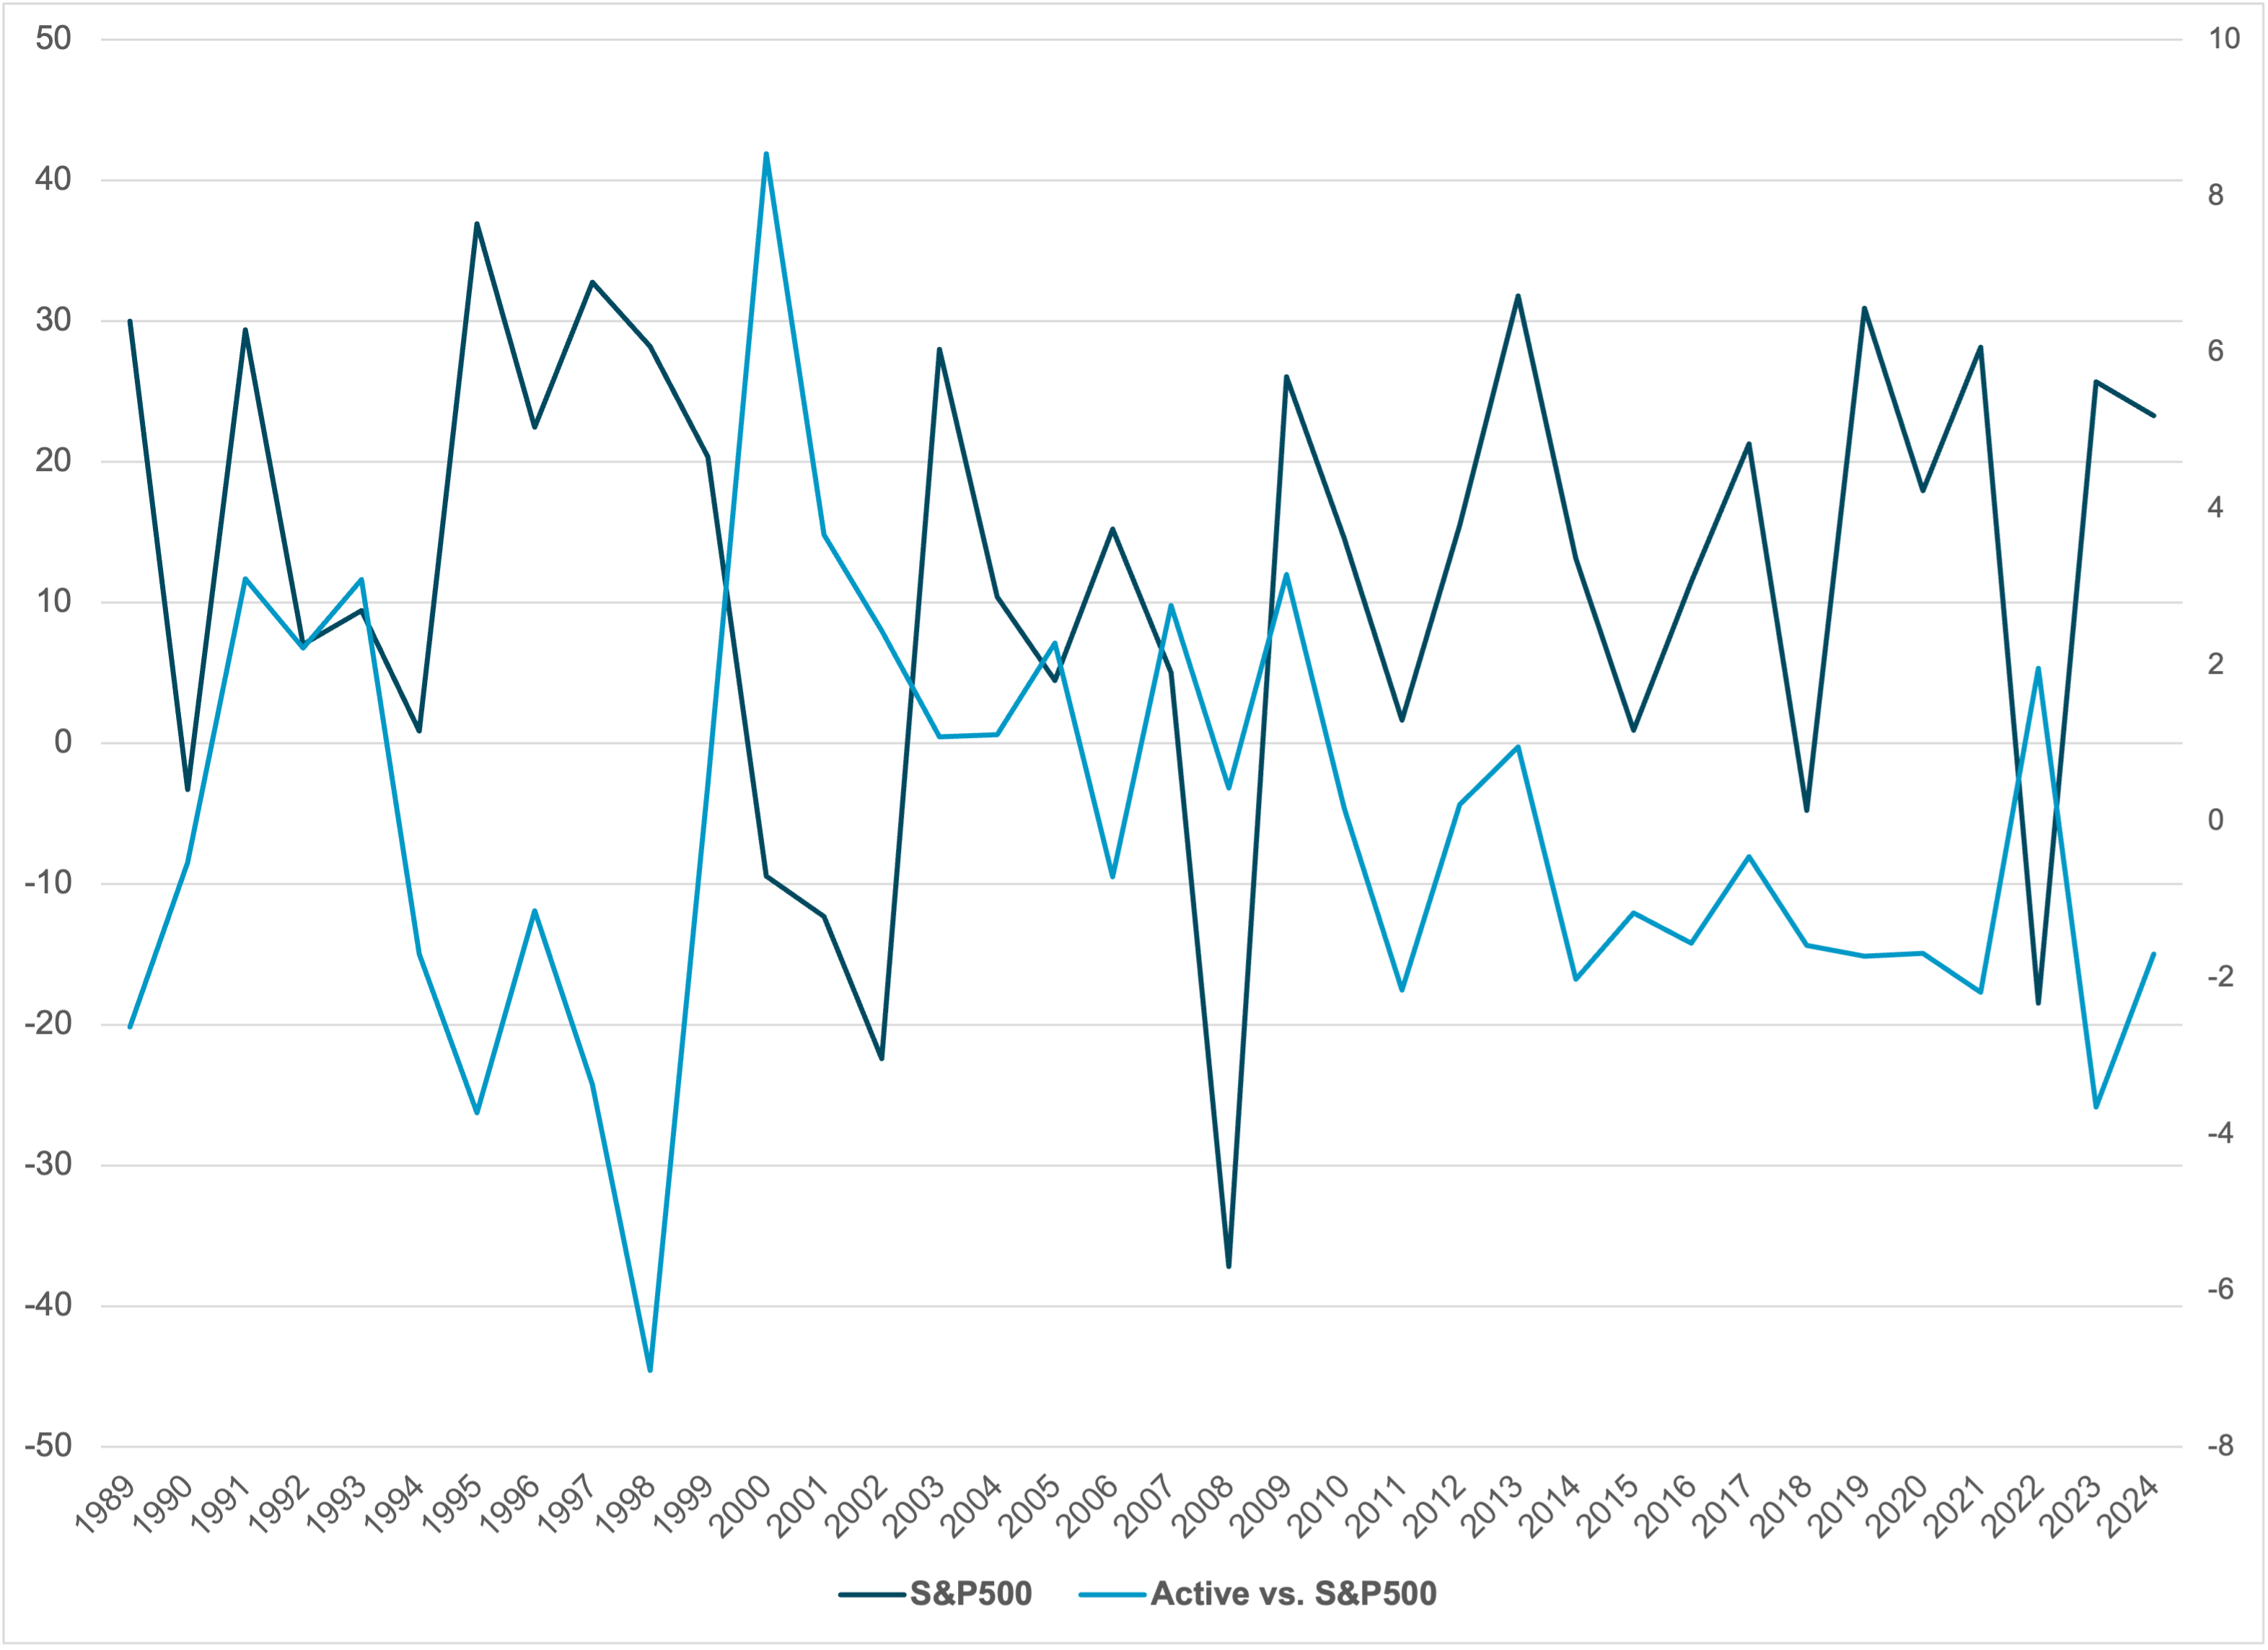
The role of passive vs. active strategies in equity markets has returned to focus as volatility across all markets has led to a sharper, more divergent 2025 performance in Q1. Investing outside US exceptionalism once again entails risks. Position washouts and the end of the Magnificent Seven explain Q1 performance, but growth scares in the US and uncertainty factors are also drivers. ETF markets in the US saw passive funds surpass active ones in flows and size last year – as two years of 20%+ returns on indices added to the trend. The expectation over the month is that higher volatility leads to active beating passive – and the best performance of March is in the 2X long VIX ETF, up 24% in the last week. The difference between active and passive returns is cyclical. From 2001-2009, active beat passive, while over the last decade – apart from 2015 – passive consistently beat active performance.
EXHIBIT #3: S&P 500 YEARLY VS. ACTIVE BLEND ETFS
Source: Morningstar, BNY
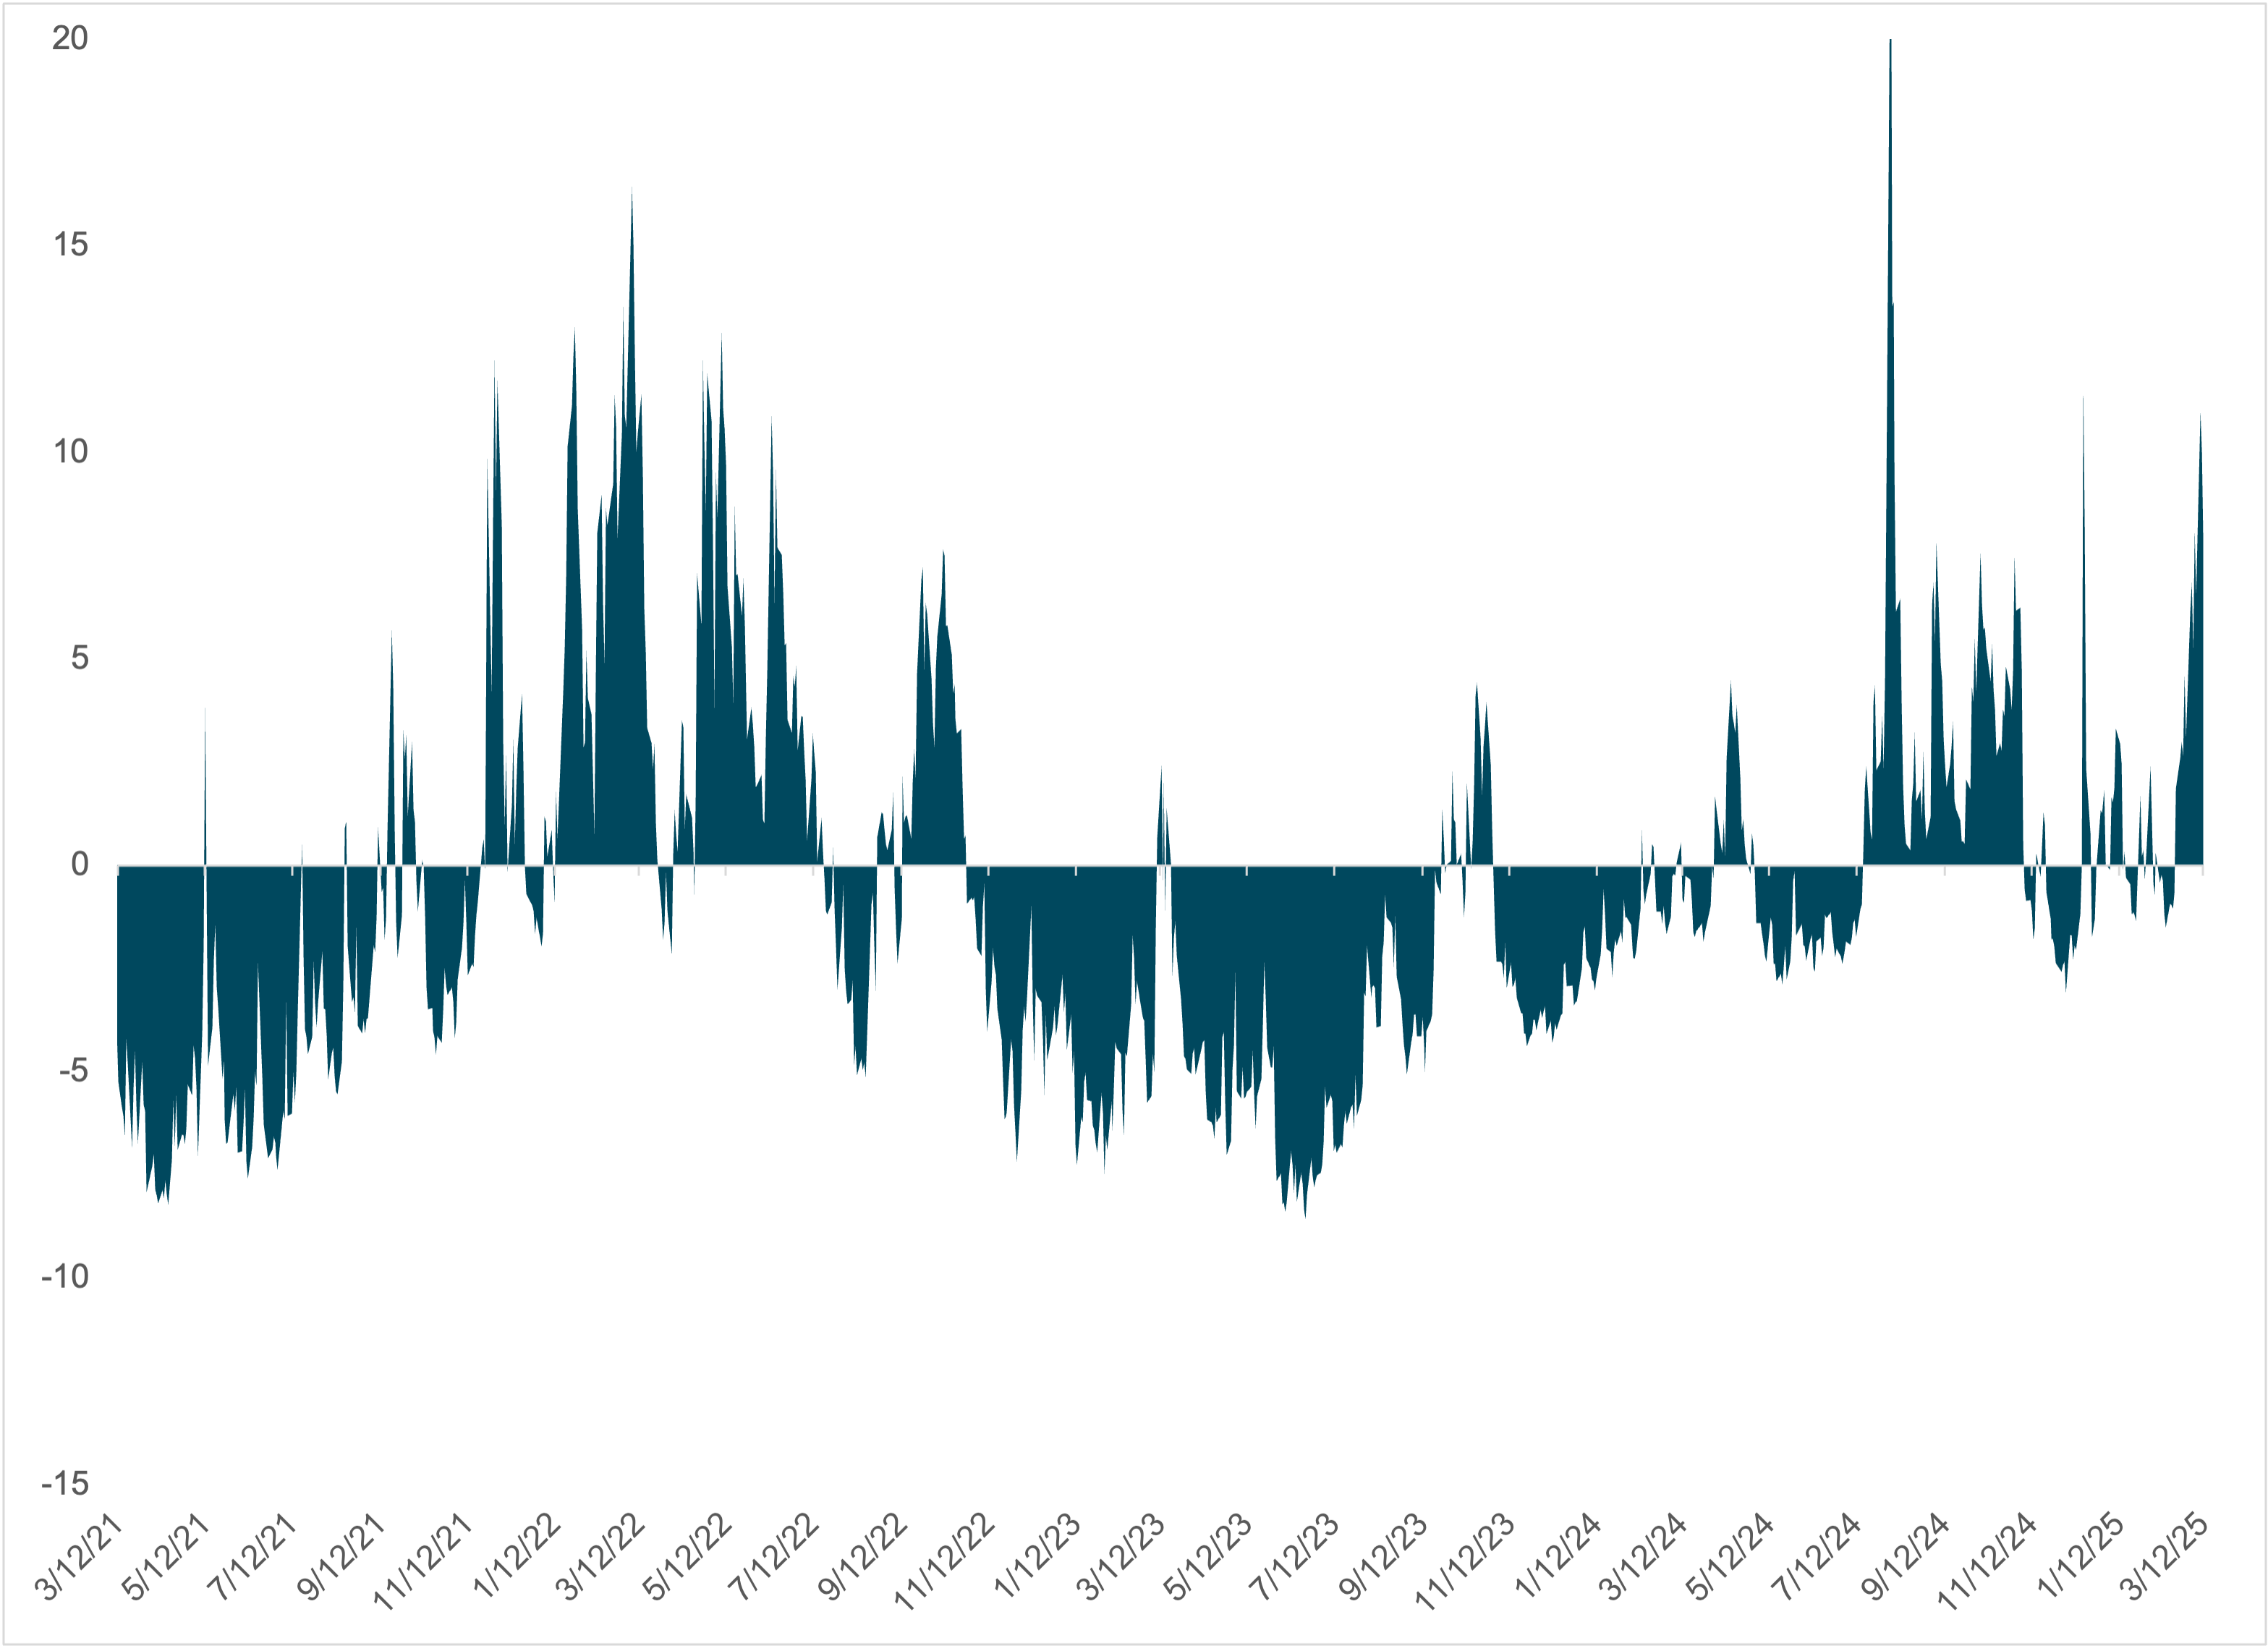
EXHIBIT #4: VIX VS. 200 MA
Source: Bloomberg, BNY
Our take
Active funds have higher expenses, and the last decade reveals a bias toward lower-fee passive funds. Morningstar studied the returns of 72% of the US ETF market – 8,326 funds with $21trn. From July 2023 to June 2024, 51% of the active funds beat the passive fund average, up from 47% in June 2023. Over the long term (10 years), active managers beat passive managers 29% of the time, however, different market states matter significantly to active vs. passive performance. In 2024, active bond managers outperformed. The MOVE index (measuring the volatility of US bonds) was notably higher. Beyond volatility, the liquidity of a market matters and the less traded sectors see active success, as in the US commodity funds or small cap shares.
Forward look
The risk of markets not bottoming out and seeing a “buy-the-dip” bounce rests on volatility. One way to look at this is through the US VIX and the history of it being above and below the 200-day average. The current period has seen a steady rise in volatility in the MOVE, Currency VIX and S&P 500 VIX. What stands out is that the current fears about rates are less persistent than the VIX and C-VIX measures. The Fed pause has made bond markets more constrained in tighter ranges, while the FX markets and correlations to the USD across markets have been on the frontlines of reacting to headlines about trade policy. The extreme volatility is different from a crisis as it is more about unpredictability over surprise or uncertainty.
There is a quite distinct setup for the rest of the year, as the next two weeks are likely to be about waiting and seeing what happens to US trade tariffs and the negotiations with Canada and Europe to prevent a trade war. The ongoing hopes for a Ukraine/Russia peace aren’t derailing EU defense spending and other stimulus, but the risk of a reversal seems higher should these talks extend into Q2. 2025 uncertainty is different than the uncertainty during the 2020 pandemic or 2015 US tightening/China growth hits. Buying this dip should make money for value plays but determining that value is hard to see given the rising volatility.