Game Changers
Start of the Week previews activities across global financial markets, providing useful charts, links, data and a calendar of key events to help with more informed asset allocation and trading decisions.
Start of the Week previews activities across global financial markets, providing useful charts, links, data and a calendar of key events to help with more informed asset allocation and trading decisions.

Bob Savage
Time to Read: 14 minutes
August began with a sharp risk reversal across markets as stagflation concerns resurfaced, driven by reciprocal U.S. tariffs (35% for Canada, 39% for Switzerland) and weakening U.S. employment data, with nonfarm payroll revisions bringing the three-month average to just 35,000, a level not seen since the pandemic recession. Economists see U.S. Q3 GDP at stall speed below 1%. Tariffs, which now average 20% globally, will impact the U.S. economy, with core PCE now at 3.5% y/y on a 12-month forward basis. Markets reacted with bond rallies, USD weakness and equity sell-offs. The week ahead features limited U.S. data (ISM services, trade balance), while the BoE will likely cut 25bp despite persistent wage pressures. In APAC, the focus shifts to China’s exports, inflation data for South Korea and Thailand, and the India RBI, which is expected to maintain rates at 5.5% with a dovish outlook. The key question is whether the U.S. economic data and new tariff certainty is a game changer. The sharp break from the July complacency in markets may not continue if the breakdown drives a new set of policy reactions – by central bankers or politicians or both. Investors trading in 2025 expect uncertainty to be costly and assume excessive volatility will trigger policy action. Whether this holds for August remains to be seen.
What is the hedge for stagflation?
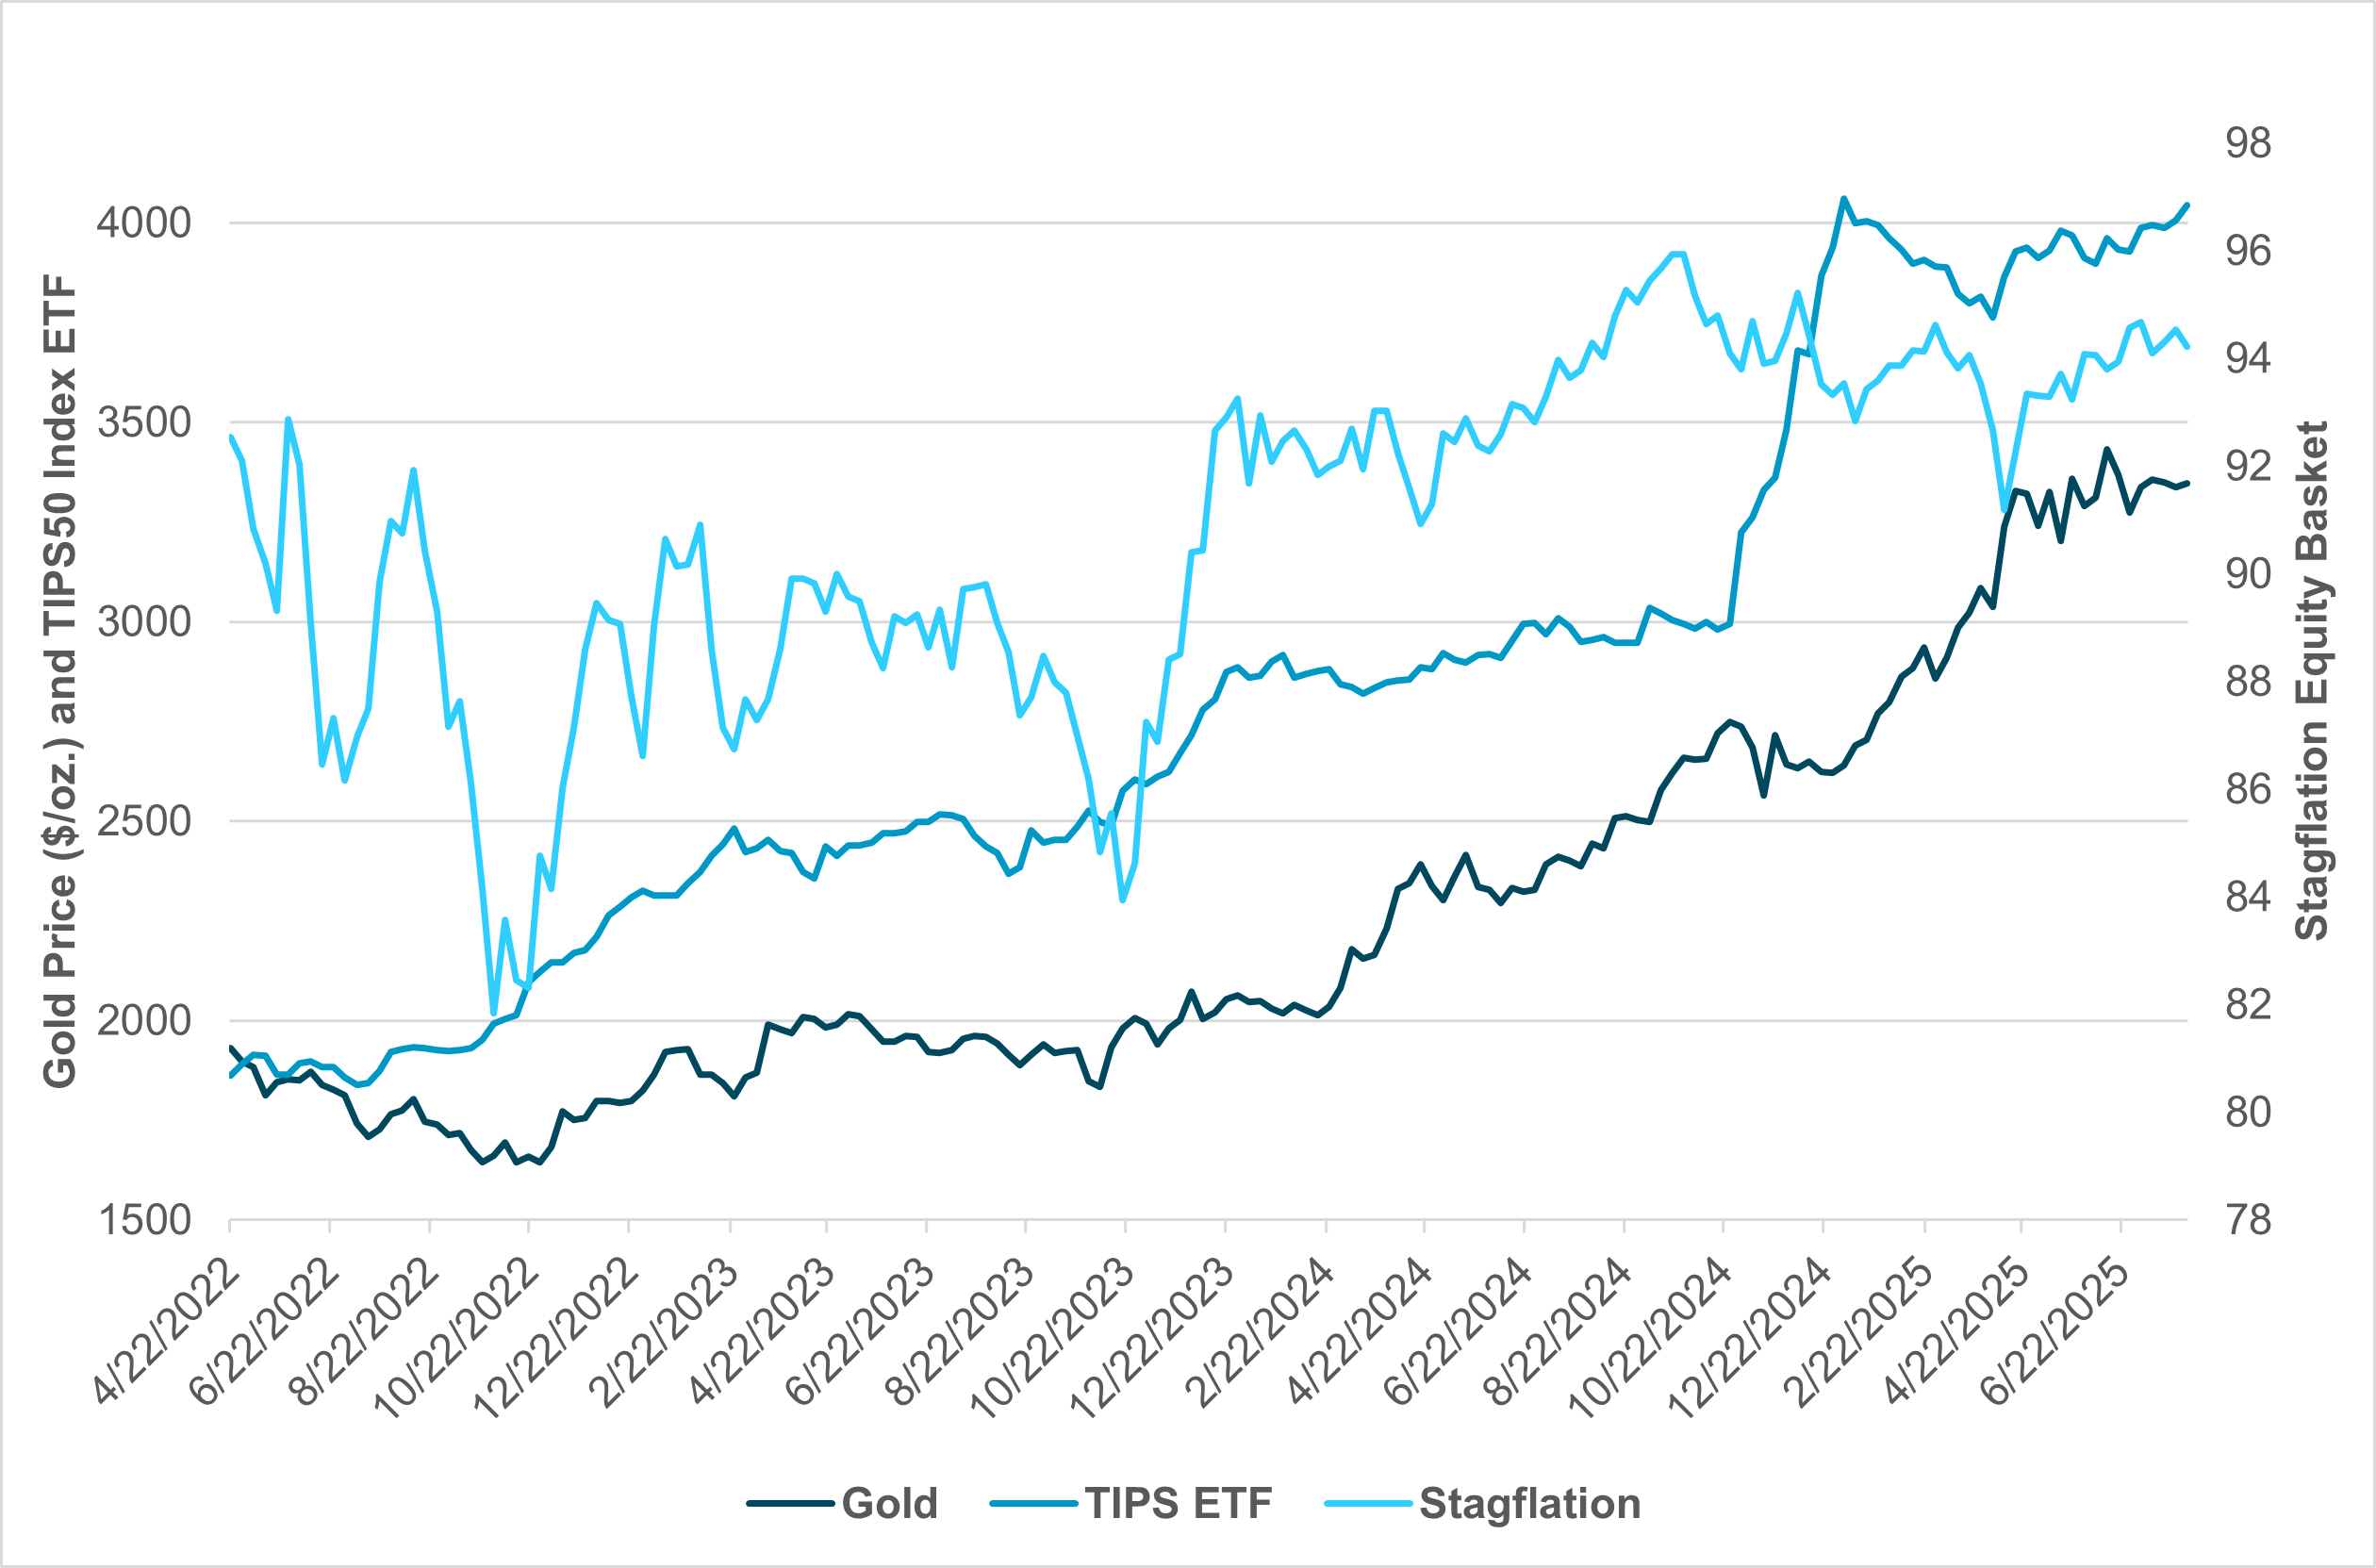
EXHIBIT #1: STAGFLATION EQUITY BASKET VS. INFLATION-LINKED U.S. BONDS AND GOLD
Source: BNY, Bloomberg
*Stagflation equity basket from BBG, TIPS50 ETF indexed, gold spot price
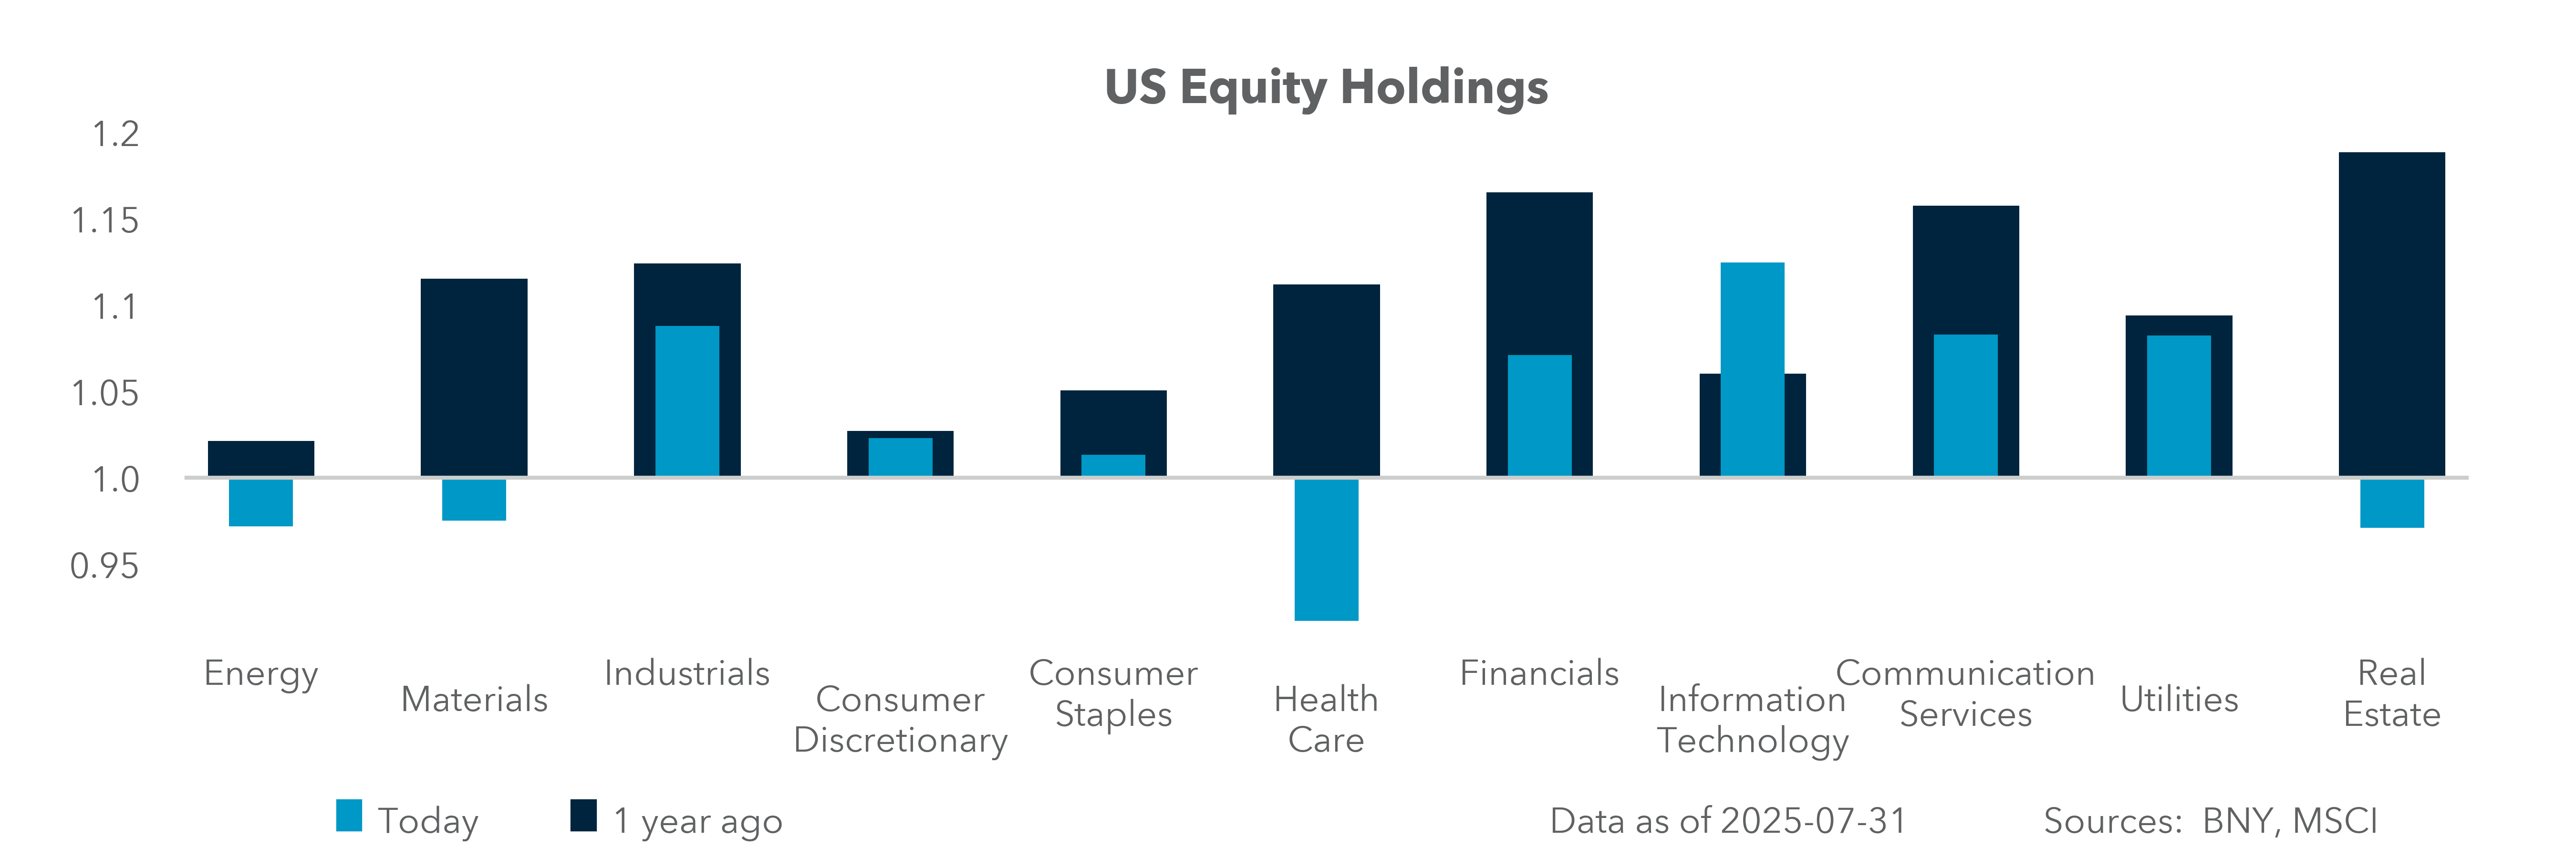
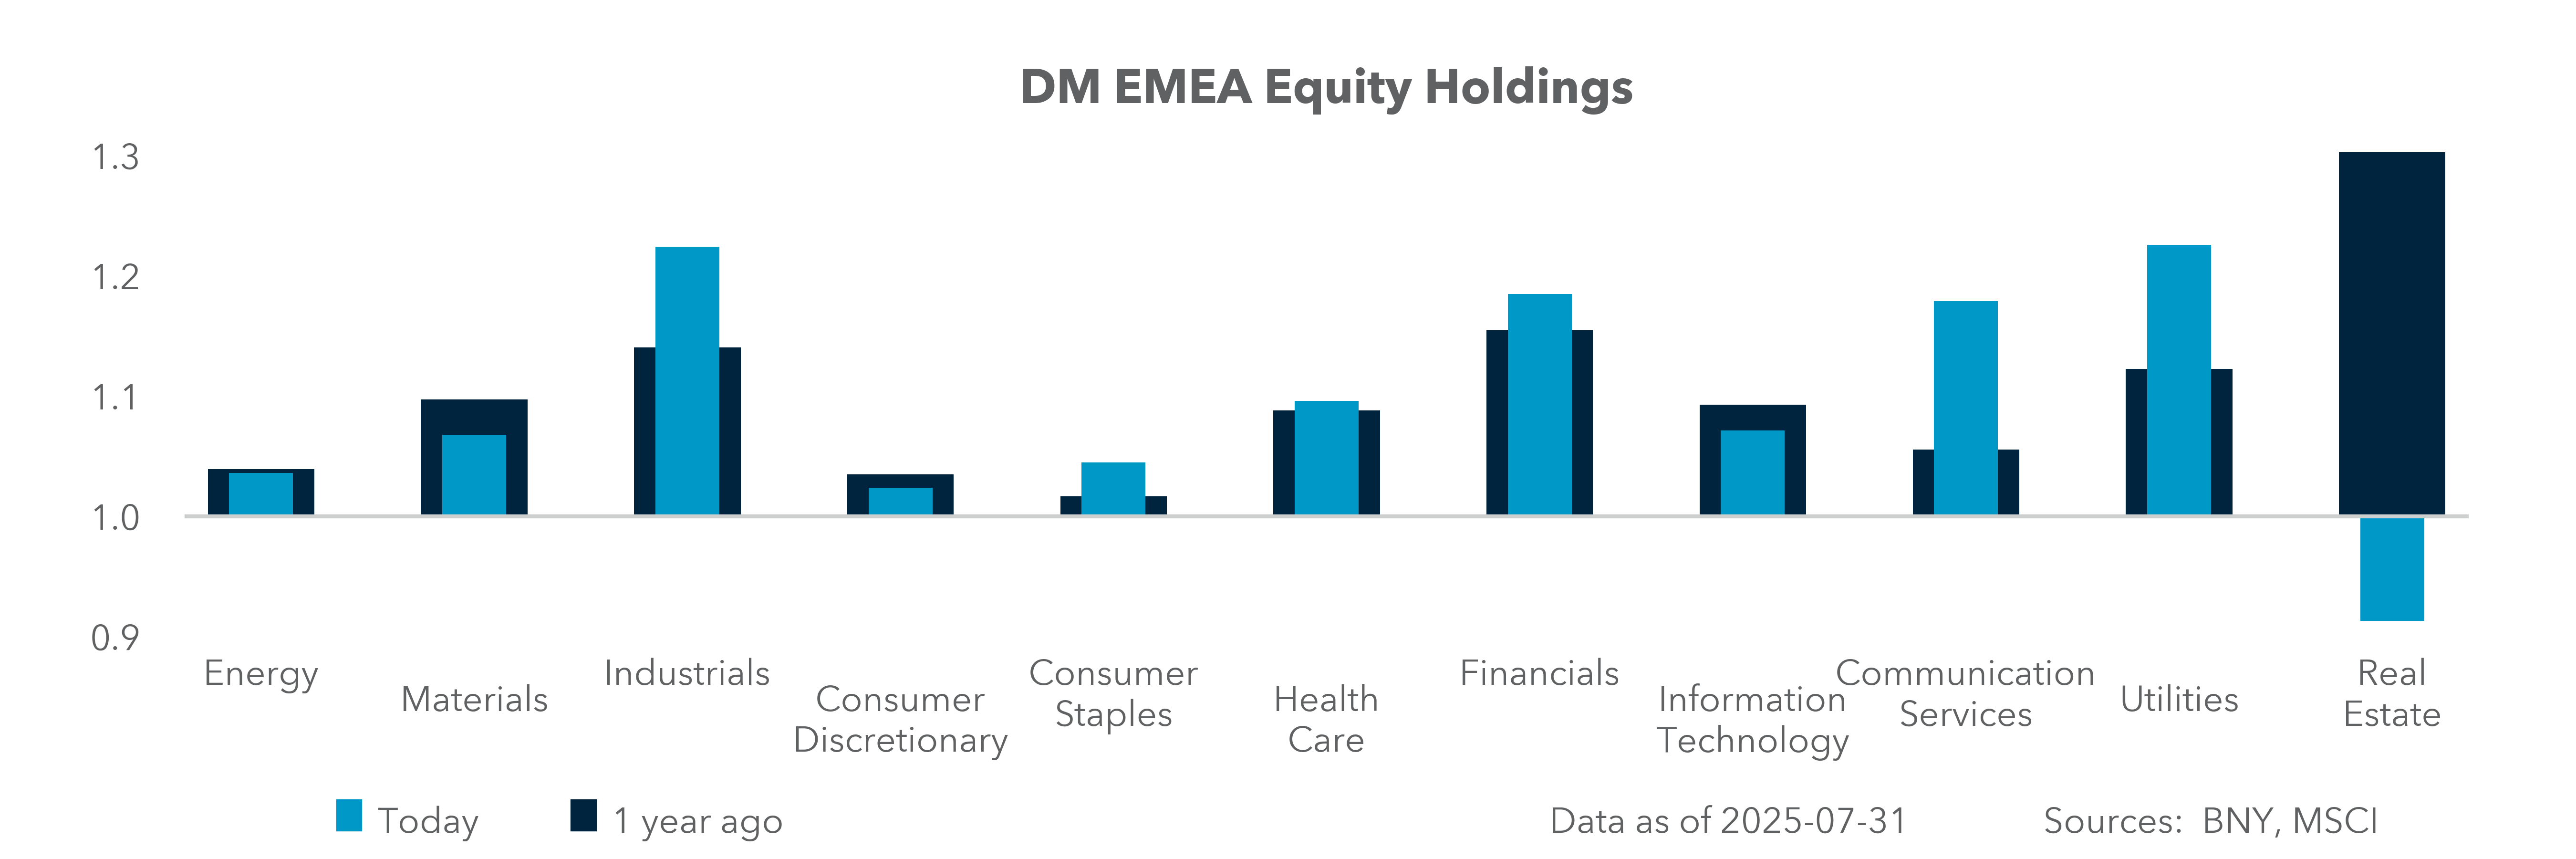
Our take: If markets are expecting higher inflation and lower growth in the months ahead, investor positioning will have to shift. iFlow suggests investors are long IT, Industrials and Financials globally, while also being long duration in bonds and cash. While we are well off the gloomy highs for stagflation set in September 2024 just before the FOMC started to ease and we are also off the lows of “Liberation Day,” the sharp change in sentiment on Friday after tariffs and the U.S. ISM/jobs reports leaves many doubting the downtrend. Growth expectations for Q3 are now linked to the impact of new tariffs and the policy responses to them. The inflation outlook is more complicated, as growth slowing enough to curb demand may offset some of the inflation impacts. This puts the focus on services costs everywhere and will lead companies making AI investments to look for payback in the form of productivity gains in the quarters ahead. During periods of “stagflation” in the U.S. – from the 1974 oil embargo to the 1990 Gulf War shock – gold is the one asset that has consistently delivered strong positive real returns and the highest return for its price volatility. The second highest hedge was energy commodities and the third TIPS. The chart above highlights the noise involved in measuring stagflation expectations in equities and the role of inflation-linked bonds as a hedge, particularly when investors fear monetary policy errors.
Forward look: The scorecard for U.S. stagflation episodes is painful – gold rose 22% y/y from 1973 to 1982. The problem is there is little duration reward for holding gold. Energy commodities and any index trading them were up 17% during the same period. Commodity baskets mainly reflect cost-push shocks and raise questions about how long these effects will persist. Further, the current focus on inflation is not about energy, but rather goods costs linked to tariffs. TIPS have been notable in not being correlated to commodities and they have a small positive carry. From 1973 to 1983, they earned 3% y/y in real terms, or 12% y/y in nominal terms. The biggest issue in holding them is their liquidity compared to fixed income products. The U.S. 10-year note by comparison was up 1% y/y, while REITS were up 5% y/y. Cash was 0% – matching inflation (assuming 3m bills or shorter-term instruments). Long duration doesn’t work during stagflation, with these products losing 3%, while equities fell 2% and industrial metals dropped 20% y/y. The volatility for the week ahead will depend on how investors shift their positions to reflect the new tariffs and economic data.
U.S. focus shifts from growth to inflation
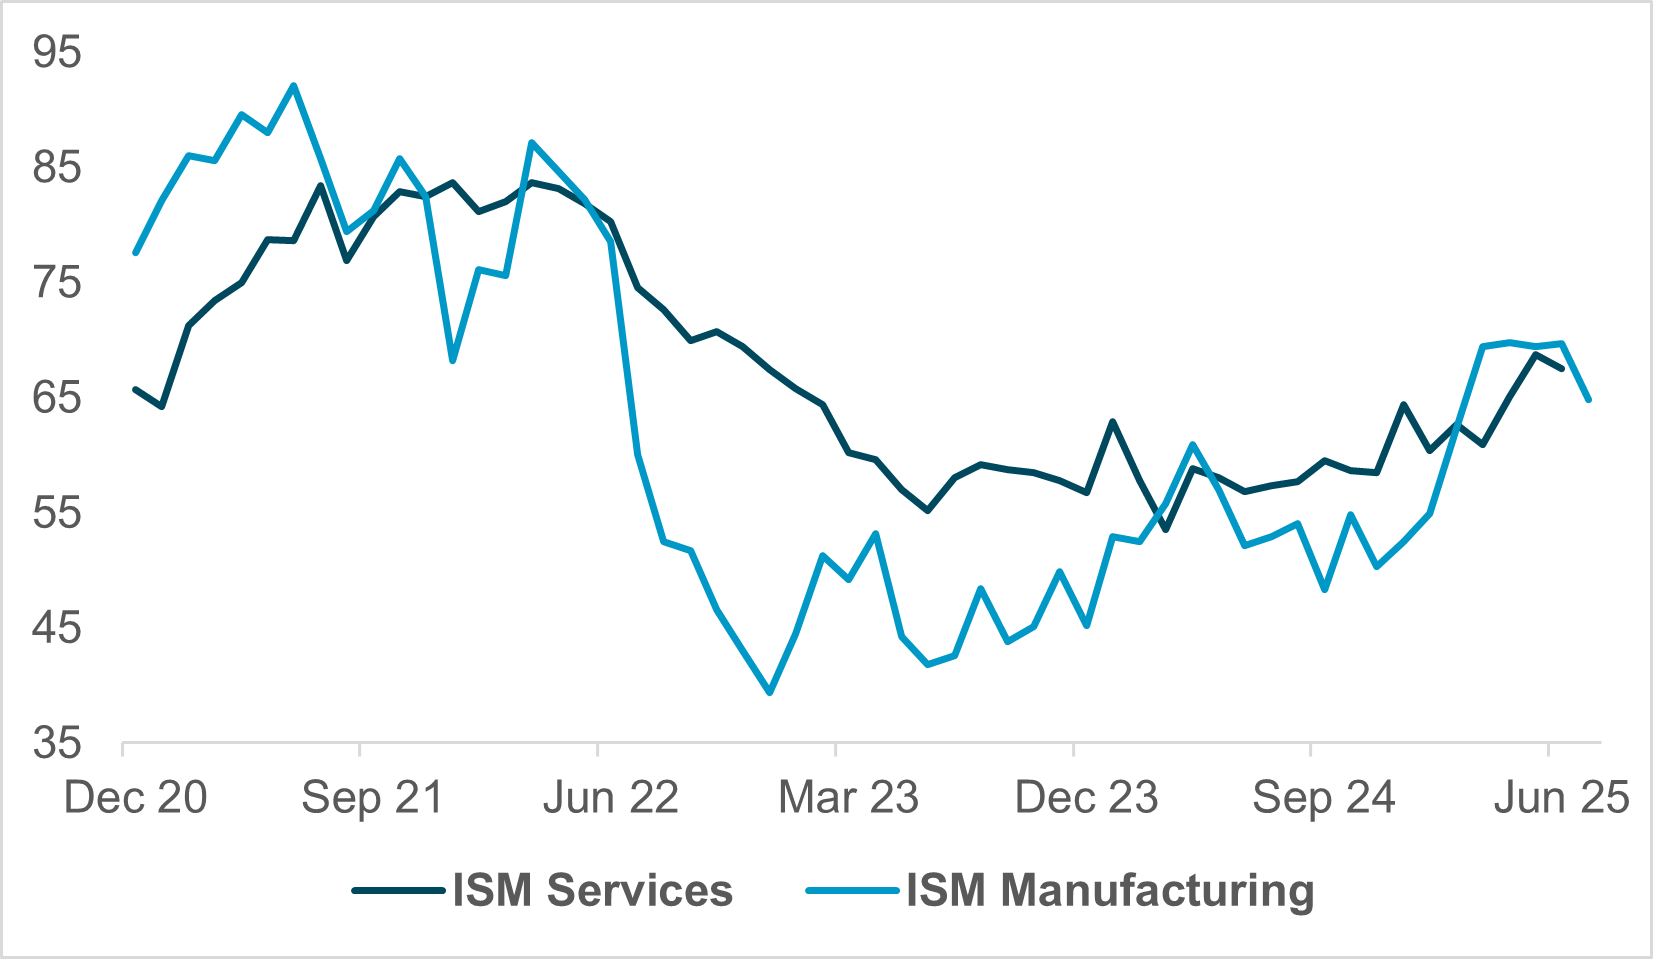
EXHIBIT #2: U.S. ISM PRICES PAID
Source: BNY, ISM
After a heavy week of data – including a disappointing job market report, an FOMC meeting, yet more tariff announcements, and a lot of social media posts calling for lower interest rates – we get a reprieve of sorts this week. Last week left us with the distinct impression that the economy is slowing even as inflation is stirring – a stagflationary mix that many saw coming once tariffs were first broached at the beginning of the year. Unfortunately, we won’t get a lot of additional information on the economic outlook in the coming days, given the light data schedule.
Our take: After a heavy week of data – including a disappointing job market report, an FOMC meeting, yet more tariff announcements, and a lot of social media posts calling for lower interest rates – we get a reprieve of sorts this week. Last week left us with the distinct impression that the economy is slowing even as inflation is stirring – a stagflationary mix that many saw coming once tariffs were first broached at the beginning of the year. Unfortunately, we won’t get a lot of additional information on the economic outlook in the coming days, given the light data schedule.
Forward look: Highlights for the week ahead include the ISM services PMI (on the heels of a mediocre at best ISM manufacturing survey last week), the June trade balance (important to see how – if at all – the import mix is changing in response to trade policy), and nonfarm productivity (which should bounce back given a positive GDP print for the second quarter). The Fedspeak calendar as of now is light, although last Friday featured explanations by Fed Governors Bowman and Waller for their dissenting votes at last week’s FOMC.
In short, we are at a potential inflation point in the economy, with important implications for monetary policy and risk markets. Unfortunately, we will not get a lot to confirm or refute the evolving thesis that, indeed, tariffs represent a stagflationary policy choice. This does not mean that developments from 1600 Pennsylvania Avenue could not add some volatility to markets despite a lack of top-tier data coming out this week.
EMEA: Bank of England to cut cautiously, Swiss franc at risk of de-rating
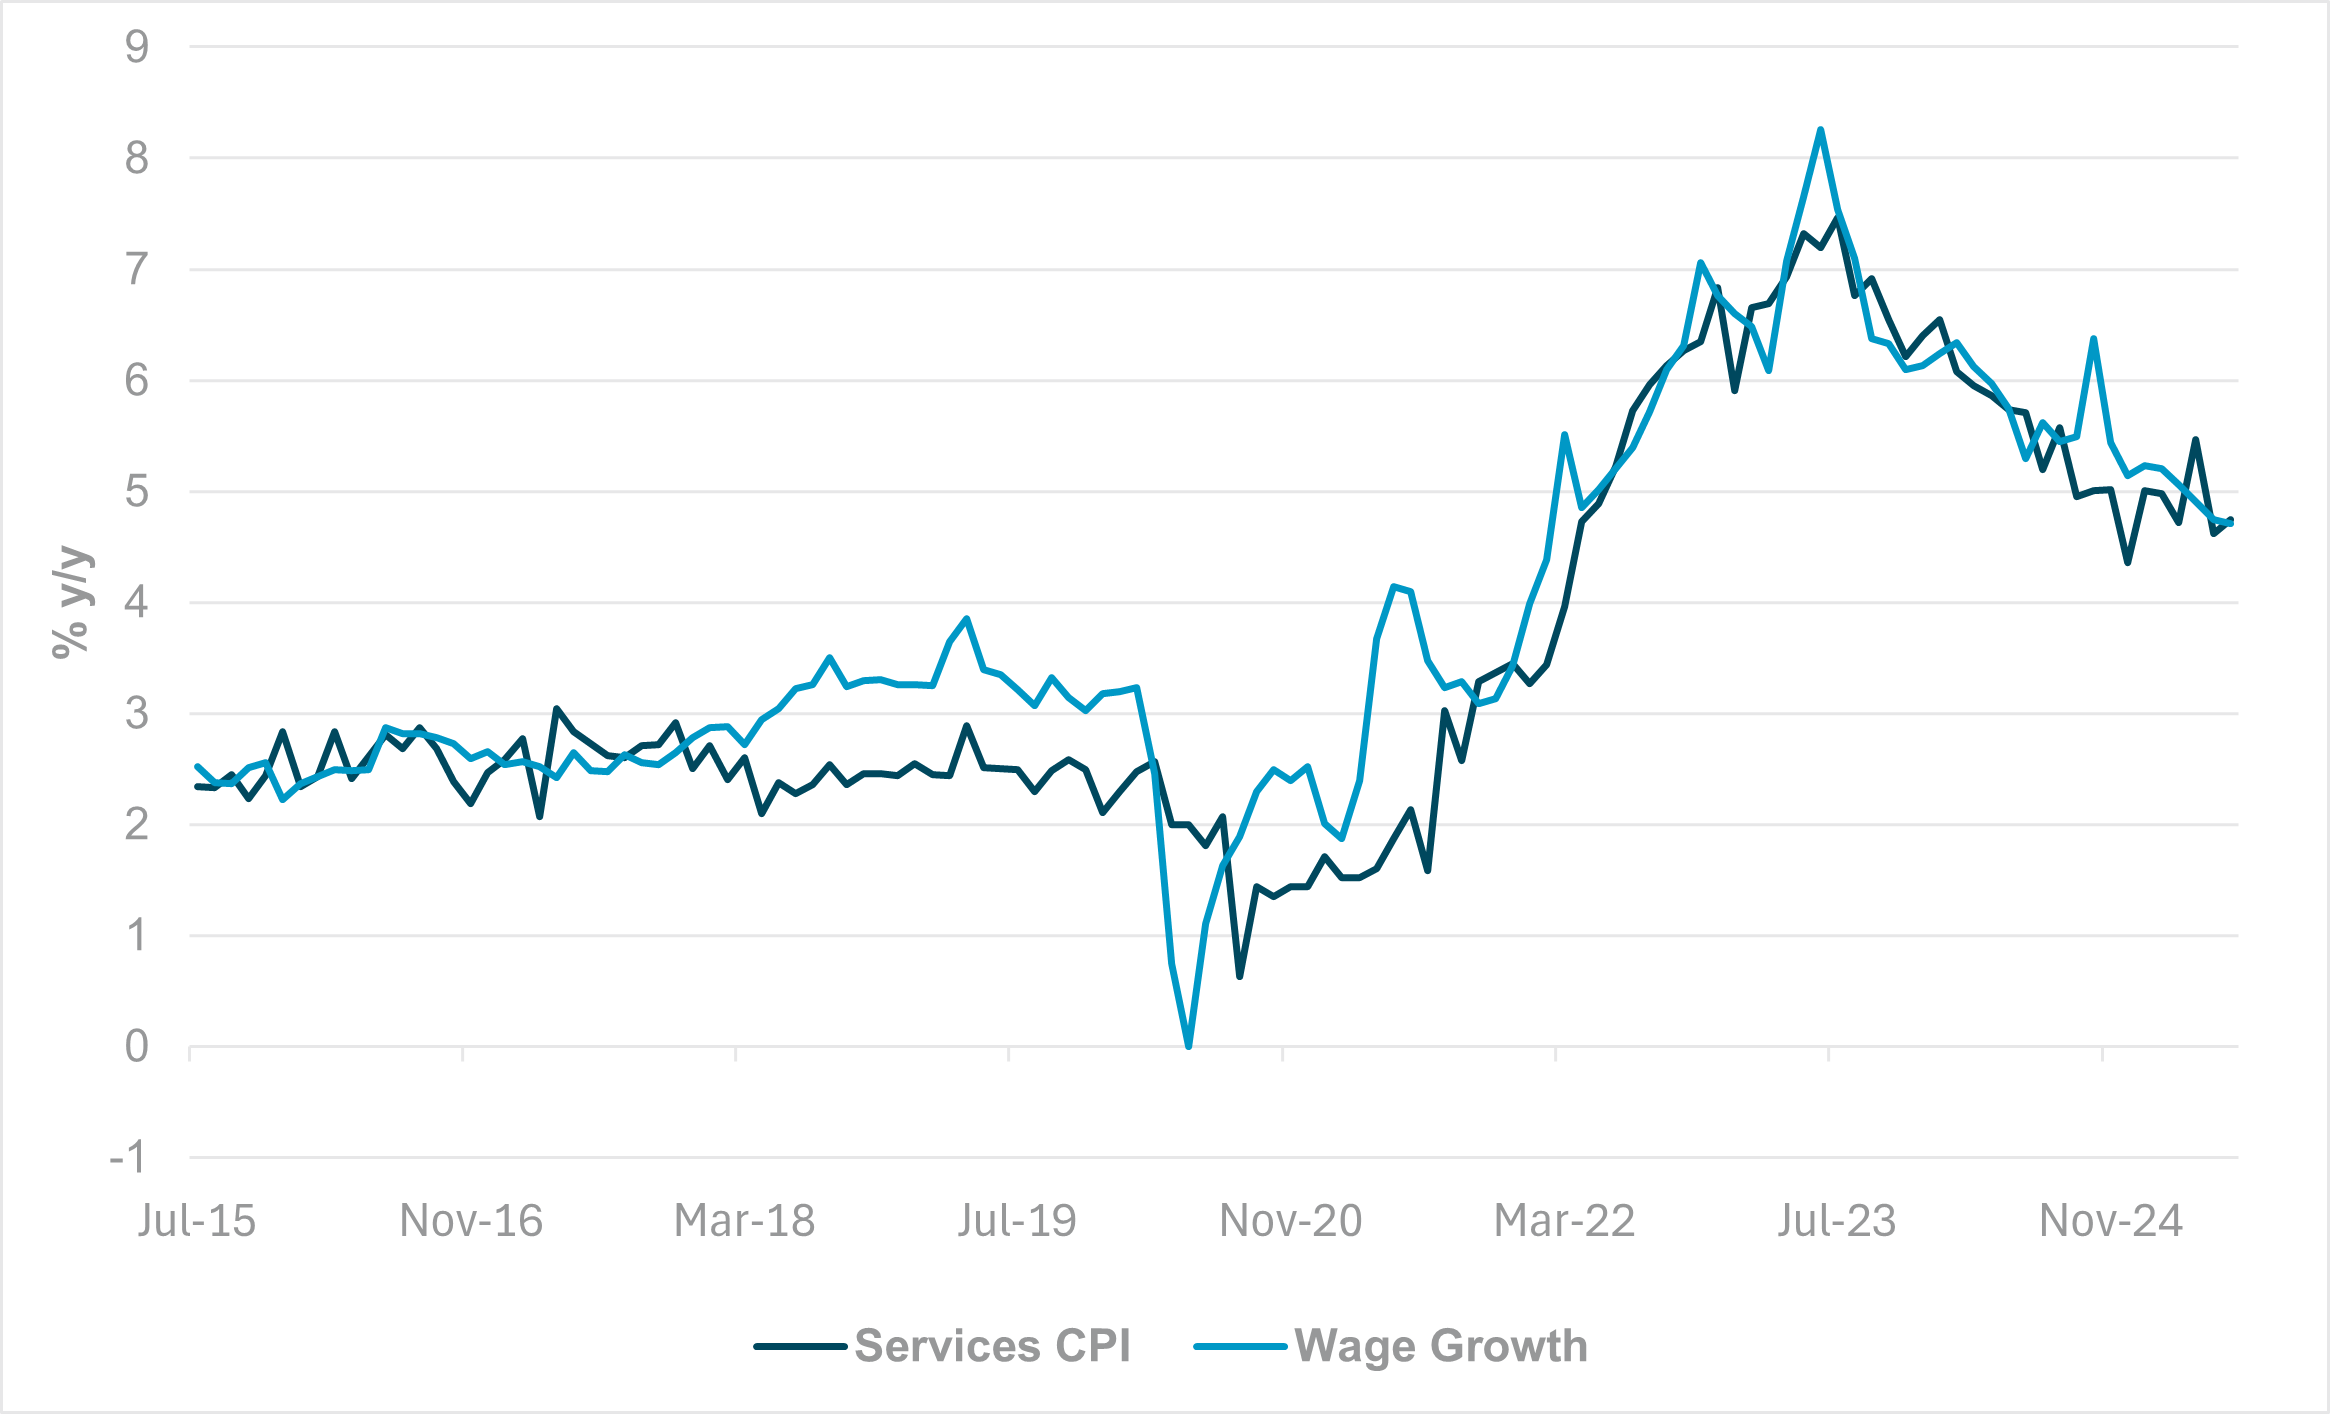
EXHIBIT #3: U.K. SERVICES CPI VS. WAGE GROWTH
Source: BNY, Macrobond
Our take: Having signed a trade deal with the U.S. early and not being a large goods exporter to the U.S., the U.K. is in an enviable position of not having to focus too much on tariff developments when calibrating its domestic policy. Even so, the Bank of England’s outlook is no less challenging due to the U.K.’s structural factors. Thursday’s BoE decision is likely to indicate a 25bp cut in the base rate to 4.00%, but we continue to question how much policy space is available for the Monetary Policy Committee. The most relevant inflation indicators remain mixed, with weak growth the only consistent factor. The U.K. economy is drifting in and out of stagflation, mostly driven by stubbornness in wage growth.
In its June decision, the MPC highlighted its expectation of “significant slowing” of measures of pay growth through the rest of the year but said it would remain “vigilant about the extent to which easing pay pressures will feed through to CPI.” Specifically, current evidence suggests that in absolute and relative terms, the net effect on CPI is not strong enough. Wages have been falling for the better part of three years, but services inflation – whose core input is labor costs – remains well aligned in terms of level and pace with earnings (Exhibit #3). We suspect the Bank of England hoped for a higher “multiplier,” whereas falling wage growth would translate into stronger demand weakness and drive bigger declines in services and goods inflation. Yet, this has not materialized, as the Bank remains cautious in determining that a “margin of slack has opened.” Where the BoE does have greater room to act, however, is on external factors. Softer European performance and more robust GBP performance since the last Monetary Policy Report can help justify precautionary moves, but we still believe that domestic data will restrict the BoE to one cut per quarter for now.
Forward look: Outside of data and policy, European capitals will be extremely active in using the one-week implementation period to secure more favorable tariff arrangements with the U.S. The urgency in Bern will be acute as Switzerland faces one of the highest tariffs imposed on any U.S. trade partner. U.S. Trade Representative Jamieson Green stated on August 1 that the situation with Switzerland was “challenging” due to pharmaceuticals, even though this segment at present continues to enjoy an exemption. As we have highlighted in the past, Switzerland will struggle to run a trade surplus without its pharmaceutical exports, and the U.S. is by far the biggest market for the sector. In the worst-case scenario – coupled with sector-specific tariffs – Switzerland could face the highest effective tariff rate of all developed economies, which in time could lead to significant questions over the future of the sector’s presence in the domestic economy. The U.S. remains Switzerland’s largest single-country export destination and a significant drop in receipts presents a case for significant de-rating of the currency, which hitherto was one of our favored names for long-term performance due to valuations and fundamentals. The immediate risk is a significant downturn in economic expectations domestically, which would strengthen the case for more assertive easing by the SNB in September. Our base remains for some form of agreement, but we acknowledge that Swiss balance of payments could face significant structural shifts.
APAC: China vs. Japan and Australian consumers and the end of disinflation
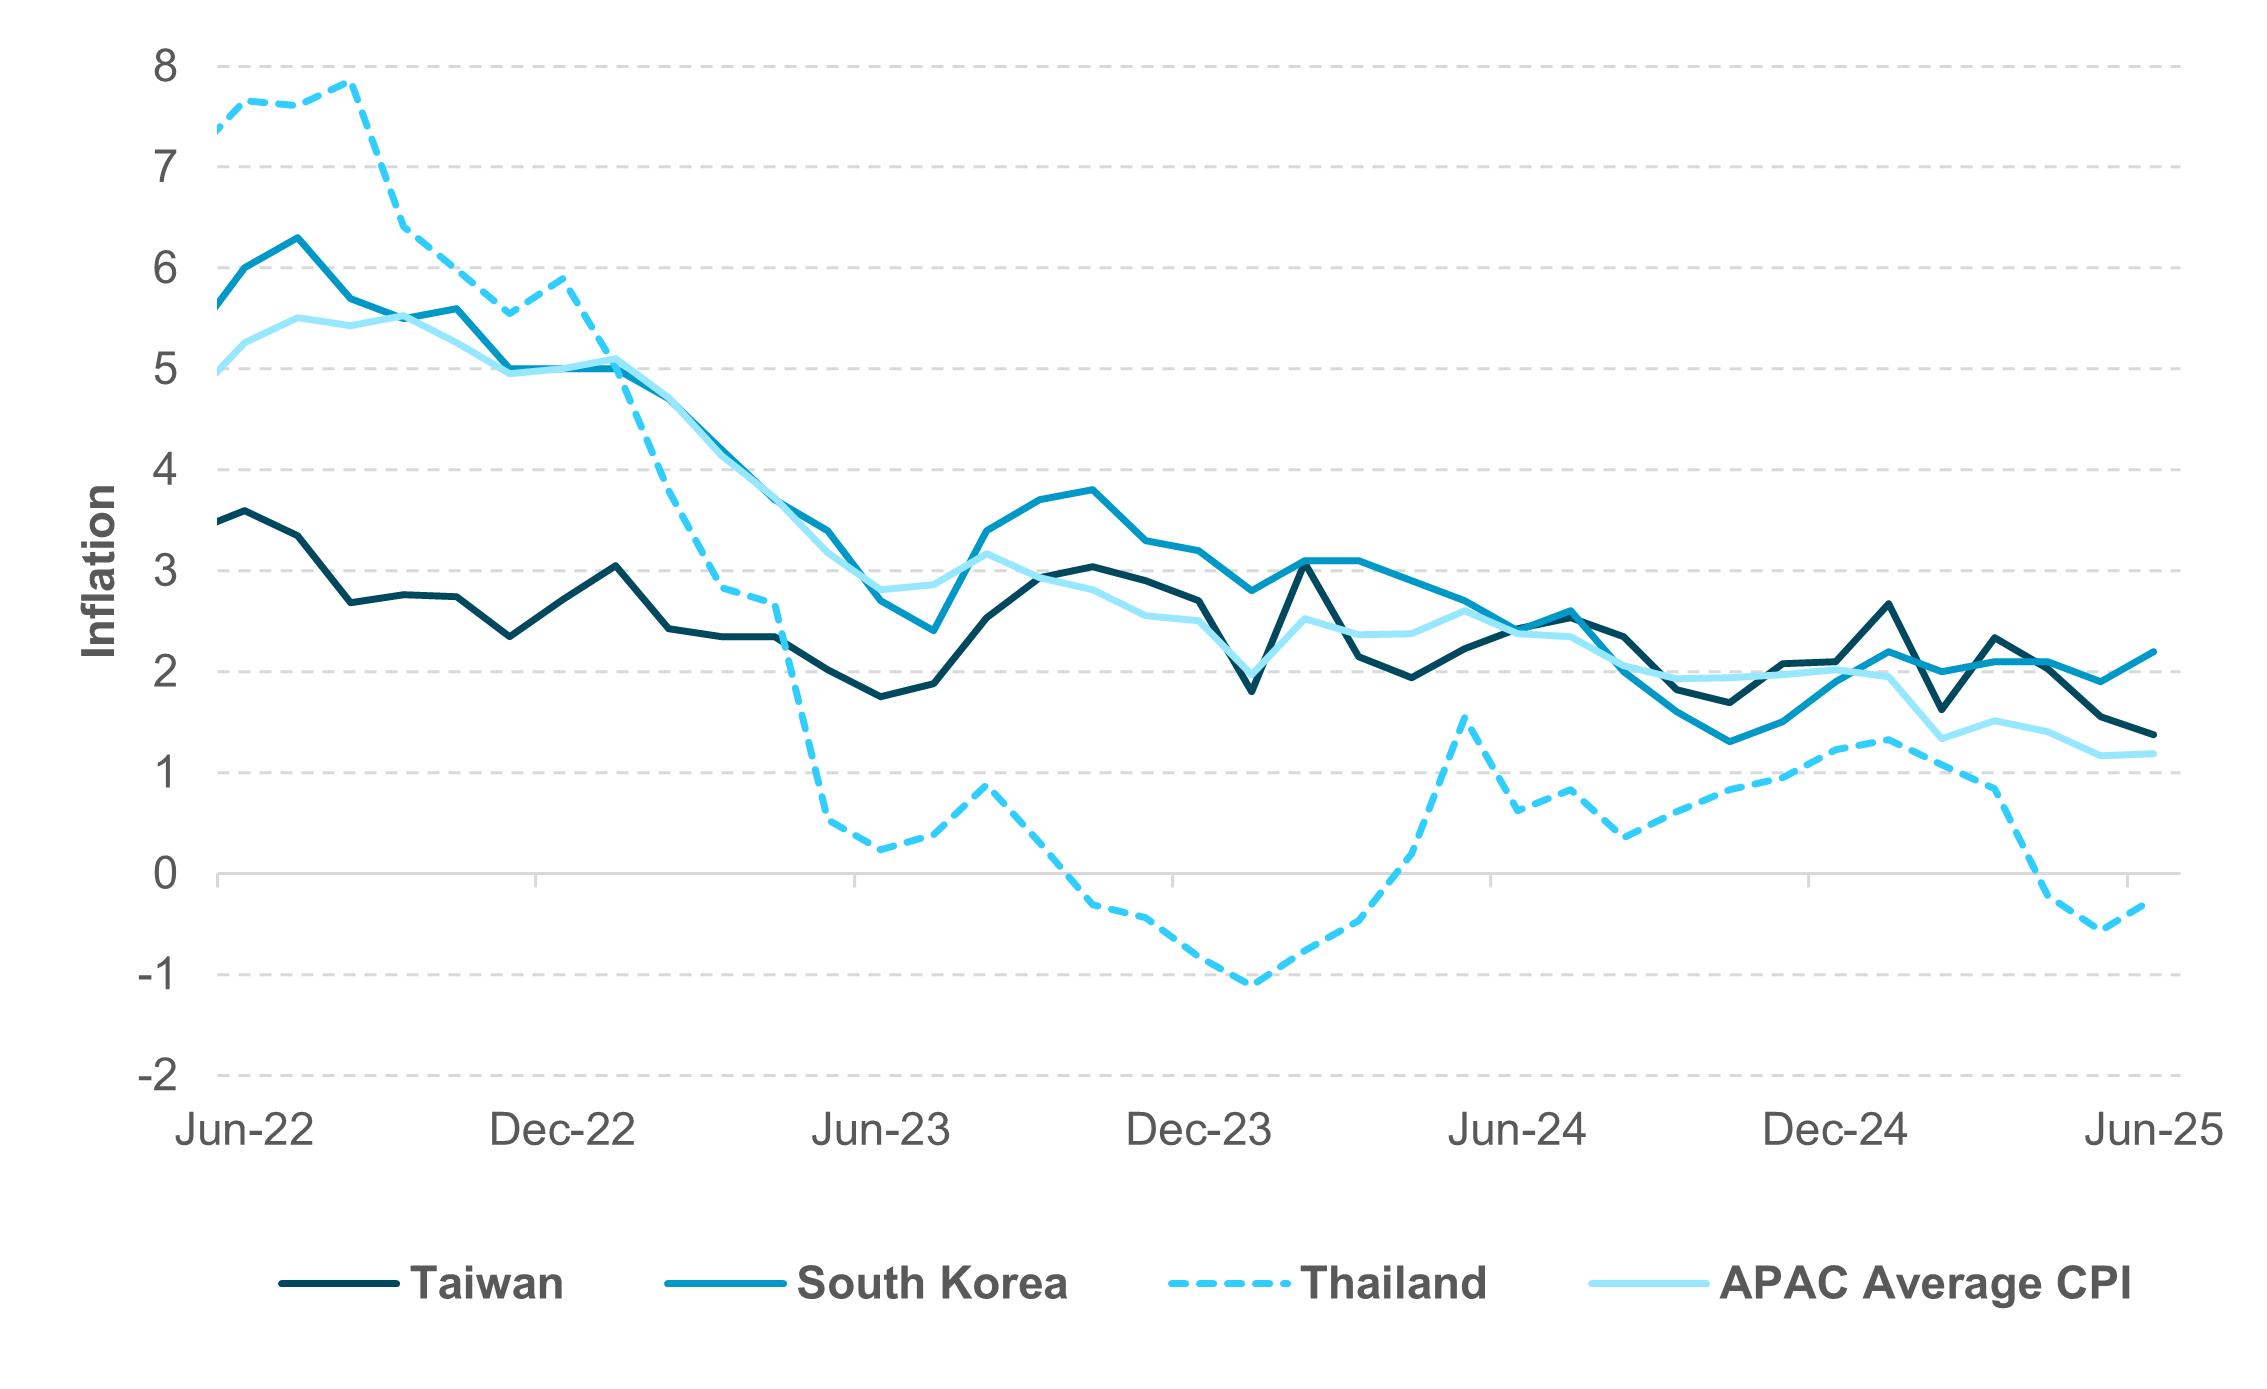
EXHIBIT #4: APAC HEADLINE DISINFLATIONARY TREND STABILIZES
Source: BNY, Bloomberg
Our take: In the Asia-Pacific region, the focus this week will be regional exports and inflation data. China and Taiwan are scheduled to report July export figures, while Australia will publish data for June. China’s export growth has moderated this year, due to ongoing trade tensions and tariff uncertainties. The most recent data from June indicate a 1.1% year-on-year increase, or a –3.8% change year to date. We will be paying attention to the headline exports figure as well as the potential rebound of exports to the U.S., which stood at –10.9% y/y year to date, accounting for 11.7% of total Chinese exports as of June 2025, compared with an average of 14.6% in 2024. In contrast, Taiwan’s July exports are expected to remain robust, supported by sustained demand in the semiconductor sector – June data showed exports up 33.7% y/y, including 82.5% growth in information and communications technology. Australian export data for June will also be closely examined following consecutive declines in April and May.
July inflation data from South Korea, Taiwan, Thailand and the Philippines will be watched carefully to assess the potential reversal of the disinflationary trend over the past year. The dampening effect of oil prices on headline inflation is expected to lessen as crude oil prices rise. South Korea’s inflation, recorded at 2.2% y/y, is unlikely to impede further monetary easing by the Bank of Korea, while the persistently low inflation profile in the Philippines provides a basis for a more dovish stance by Bangko Sentral ng Pilipinas (BSP) in the coming months. Thailand is projected to remain in a deflationary environment with negative inflation rates.
Elsewhere, Indonesia will release Q2 GDP, and we have consumer confidence data from Thailand and Indonesia. Japan and Australia household spending data will be interesting to monitor as an indirect indicator of wage growth and consumer confidence.
Forward look: Recent reciprocal tariff adjustments have exceeded market expectations for the APAC region. Notably, import tariffs for Indonesia (19% vs. April: 32%), Malaysia (19% vs. April: 24%), Thailand (19% vs. April: 36%), Taiwan (20% vs. April: 32%), India (25% vs. April: 26%), and South Korea (15% vs. April: 25%) have declined, whereas the Philippines saw a slight increase (19% vs. April: 17%). Upcoming export data will be critical in assessing the impact of these tariffs on regional trade dynamics. Additional factors such as a potential resurgence in the U.S. dollar could exert downward pressure on regional asset prices. Nevertheless, renewed inflows of foreign investment into the region continue to offset these headwinds. For instance, foreign investors were net buyers of Taiwanese and South Korean equities for the third consecutive month in July, following a prolonged period of net selling since Q3 2024. Also notable is that foreign investors turned net purchasers of Thai equities in July for the first time in 10 months. Ongoing monetary easing and fiscal stimulus measures are expected to remain supportive of risk sentiment across the APAC region.
The Reserve Bank of India is scheduled to meet this week and is expected to maintain policy rates at 5.5%, adopting a dovish outlook to account for potential tariff-related impacts on economic growth.
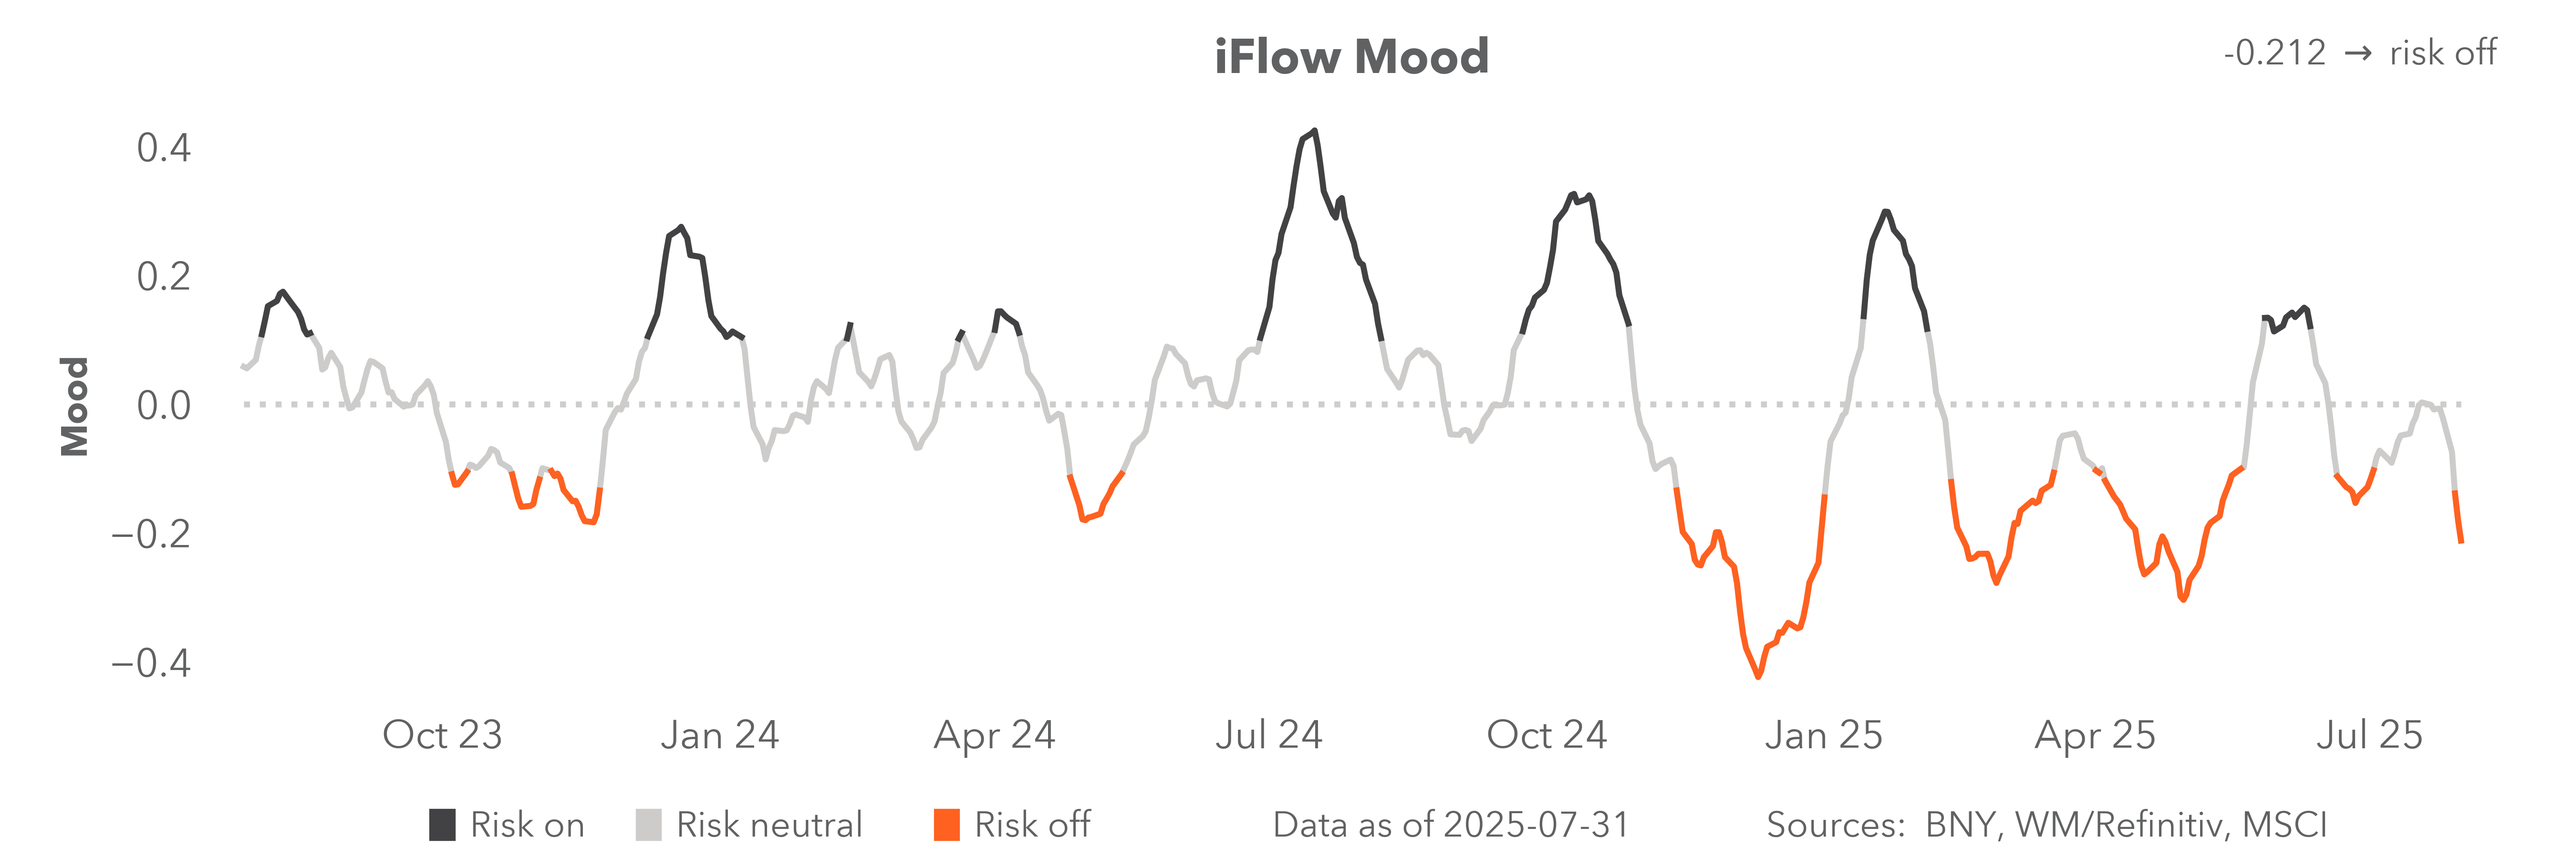
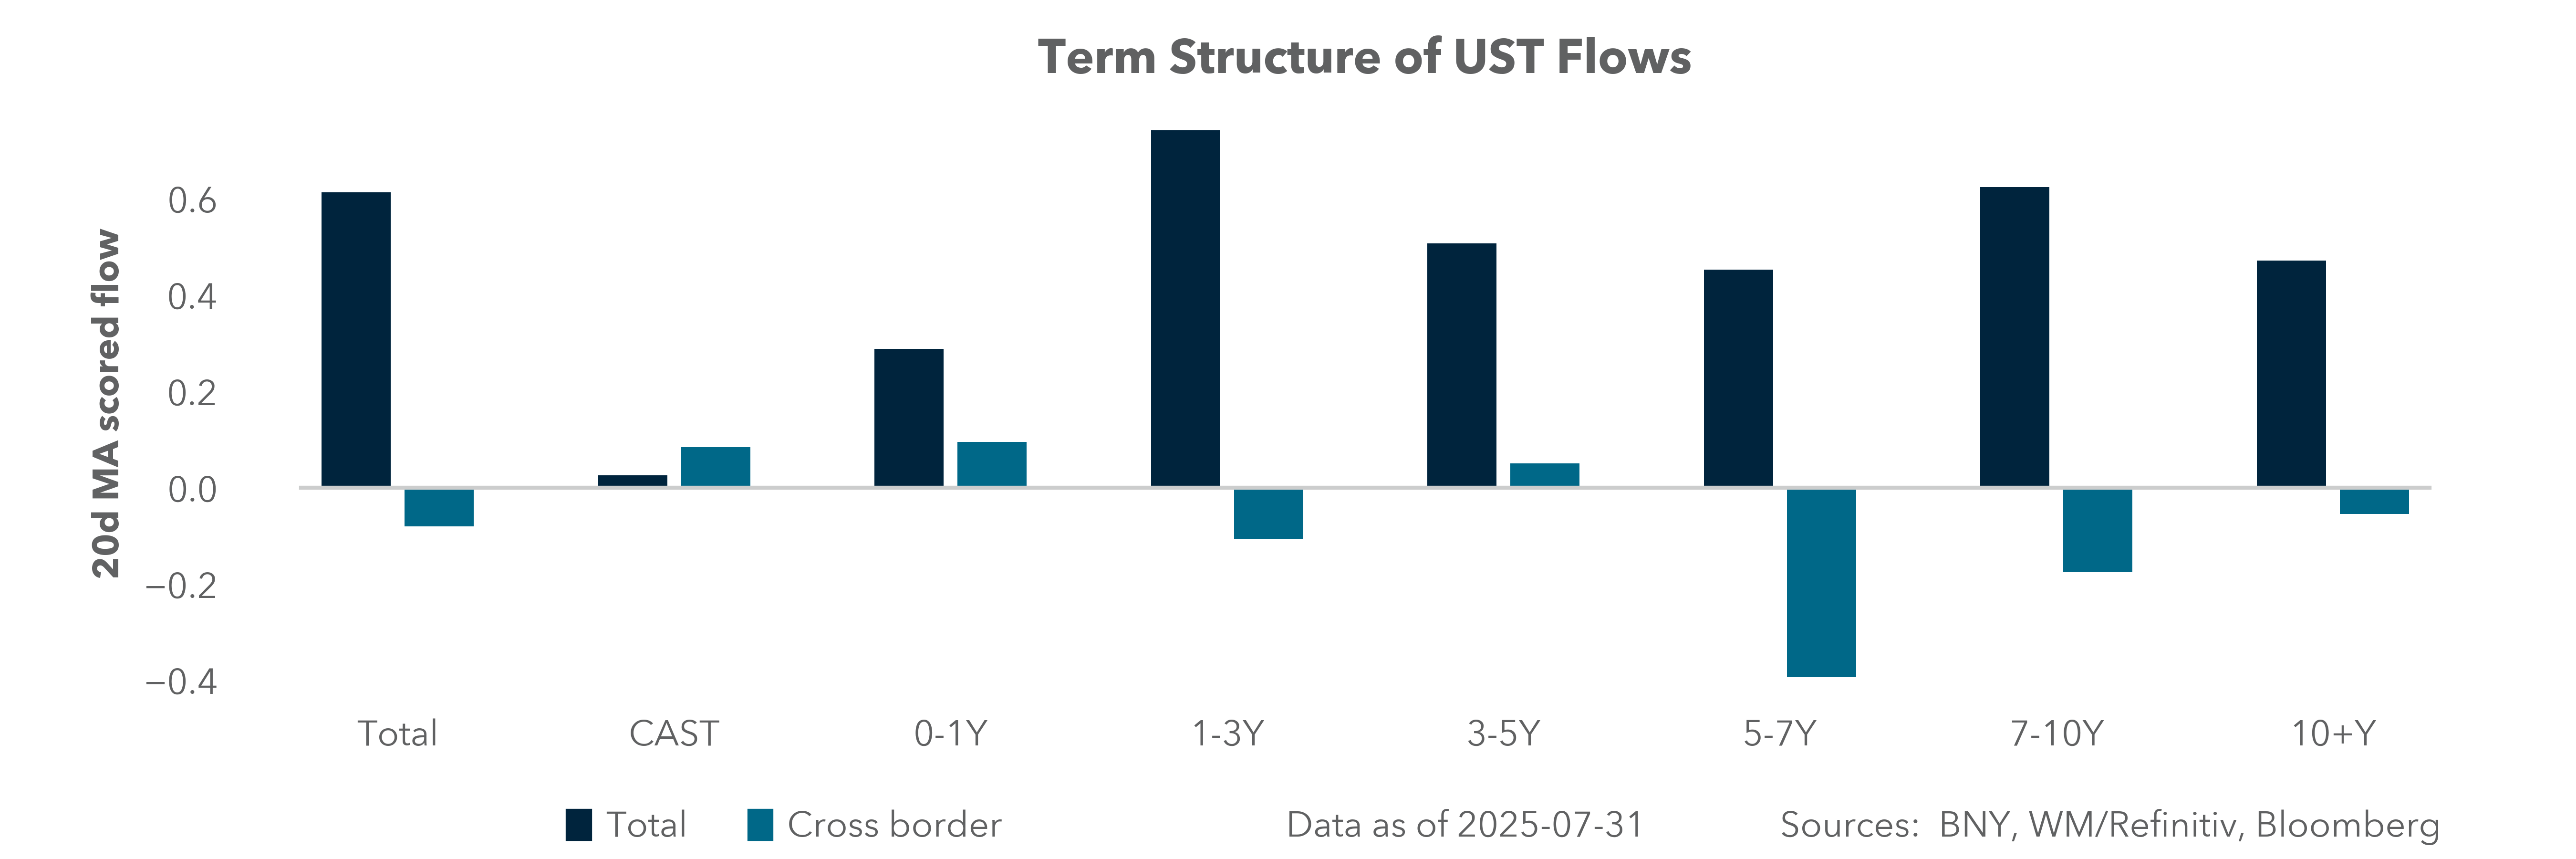
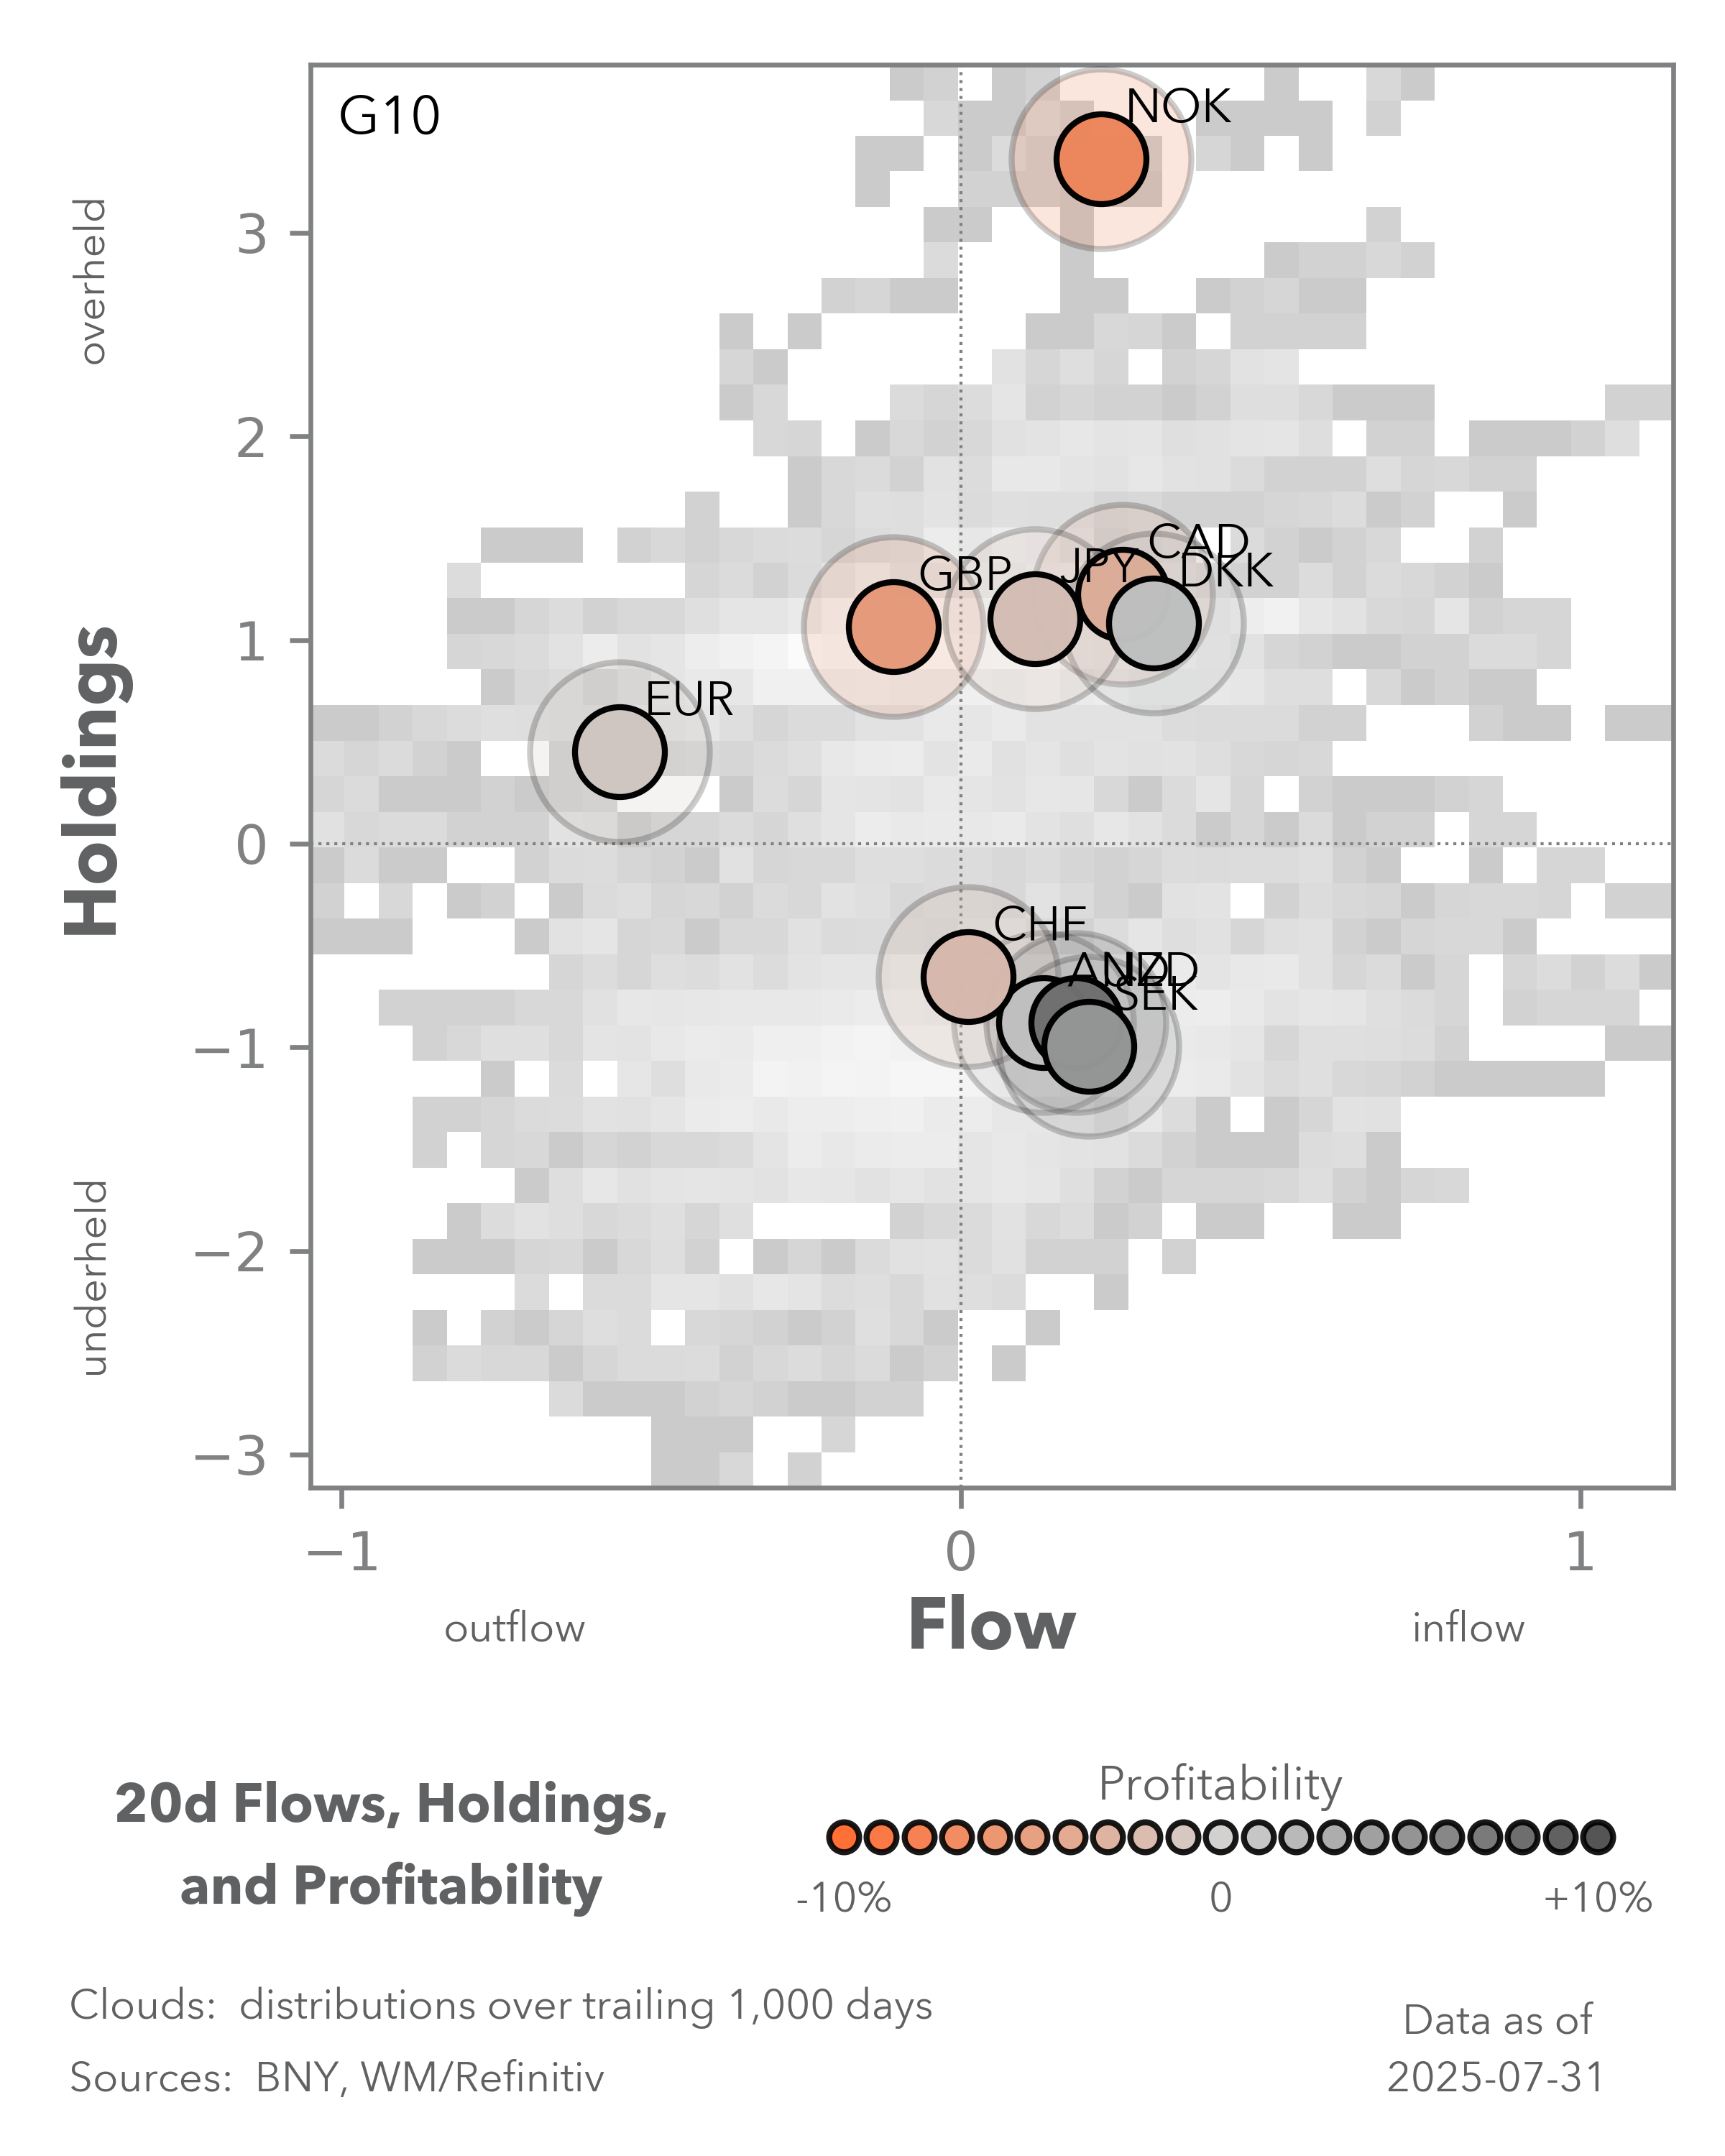
The role of position washout in August in driving September policy shifts now becomes the work for markets in the week ahead. No monetary policy response to stagflation from tariffs provides comfort after the fact. The next key risk for a larger market shift will be on August 15 with the release of CPI data. Until then, U.S. markets will be listening for a shift by Fedspeakers and further progress on trade deals by the Trump administration. As for the known unknowns for the week ahead, nothing stands out as sufficient to stop investors from a larger de-risking. iFlow Mood has been negative for four days, the MSCI All Country World Index has been down every day for six sessions, something not seen since April. The push to get to flat and shift down volatility anywhere possible in a portfolio leads back to the safe-haven discussion, with JPY, CHF, gold and bonds becoming important barometers. For the week ahead, expect less fun on the beach and more pain on the screens as the game has changed for summer trading.
Central bank decisions
India, RBI (August 6, Wednesday) – We expect the RBI to hold its policy rate at 5.75% in July, maintaining a neutral stance with a dovish bias toward a possible cut in Q4 2025. In June, RBI delivered a surprise easing, cutting its policy rate by 50bp to 5.75% and the cash reserve ratio by 100bp, while shifting back to neutral. Since then, macro conditions have been mixed: July PMIs topped 59, yet exports contracted –0.1% y/y in June, bank credit growth slowed to 9.0% y/y in May and industrial production decelerated to 1.5% y/y in June. Headline CPI fell to 2.1% in June, the lowest since January 2019, although core inflation ex-food and fuel stayed elevated at 4.55%. Indian assets underperformed regional peers, with the NIFTY down nearly 3%, the INR 2% weaker and the 10y yield rising to 6.37%, widening the spread to USTs. With growth softening and inflation below target, RBI and the Finance Ministry have reinforced the case for further ease.
U.K., BoE (August 7, Thursday) – The Bank of England is widely expected to cut rates by 25bp to 4% and the accompanying Monetary Policy Report (MPR) will indicate that the risks to the economy, especially the labor market, remain skewed to the downside. However, much to the Monetary Policy Committee’s frustration, this has not translated into sufficient softening in wage growth, and we believe the price constraints on the U.K. economy remain high enough to preclude a more aggressive easing cycle. Headline inflation is showing early signs of acceleration, while services inflation remains well-entrenched at levels close to 5%, which would be a better benchmark for wage growth and alignment through real rates. The U.K. will also face fewer challenges on the trade front, having reached a deal with the U.S. early and being less exposed to goods exports to the U.S. However, we do expect the U.K. government to also closely monitor developments on pharmaceutical tariffs. Further policy steps will also hinge on fiscal developments later in the year, but we do note that gilt flows have stabilized.
Czechia, CNB (August 7, Thursday) – The Czech National Bank is expected to keep its key interest rate on hold at 3.50% at its August monetary policy meeting. This follows June’s headline inflation slowing to 2.9% y/y, near the top of the bank’s 2% ± 1% tolerance band, while services inflation remained sticky at 5.0%, driven by rising real estate costs and strong domestic demand. July’s figures will be available to the CNB before the meeting. Markets have priced in no change, reflecting board member comments emphasizing limited scope for further easing as the economy surprised to the upside with 2.4% annual GDP growth in Q2. The bank is likely to maintain a cautious stance, noting that disinflation is progressing too slowly in services and wage pressures persist, and it has signaled that the rate-cutting cycle may be over barring unforeseen shocks. Attention will focus on the updated inflation and growth forecasts accompanying the decision, which will guide any potential policy shifts.
Mexico, Banxico (August 7, Thursday) – The Banco de México is expected to cut rates by 25bp to 7.75% while maintaining a sufficiently strong real-rate buffer. Prudence is needed despite July’s headline inflation easing to 3.55% y/y (biweekly basis), while core inflation remained elevated at 4.25%, above the bank’s 3% ± 1% target range. Despite the disinflation trend in headline prices, persistent services inflation, domestic wage pressures and recent peso volatility may cause some hesitation for further easing. Even so, more policy space can open up should disinflation continue. The Governing Board will accompany its decision with updated growth and inflation projections and commentary on balance sheet normalization, guiding expectations on the timing and pace of future policy adjustment. Banxico continues to face a balancing act in anchoring inflation expectations against volatile external demand, which remains acute given the ongoing challenges arising from trade relations with the U.S.
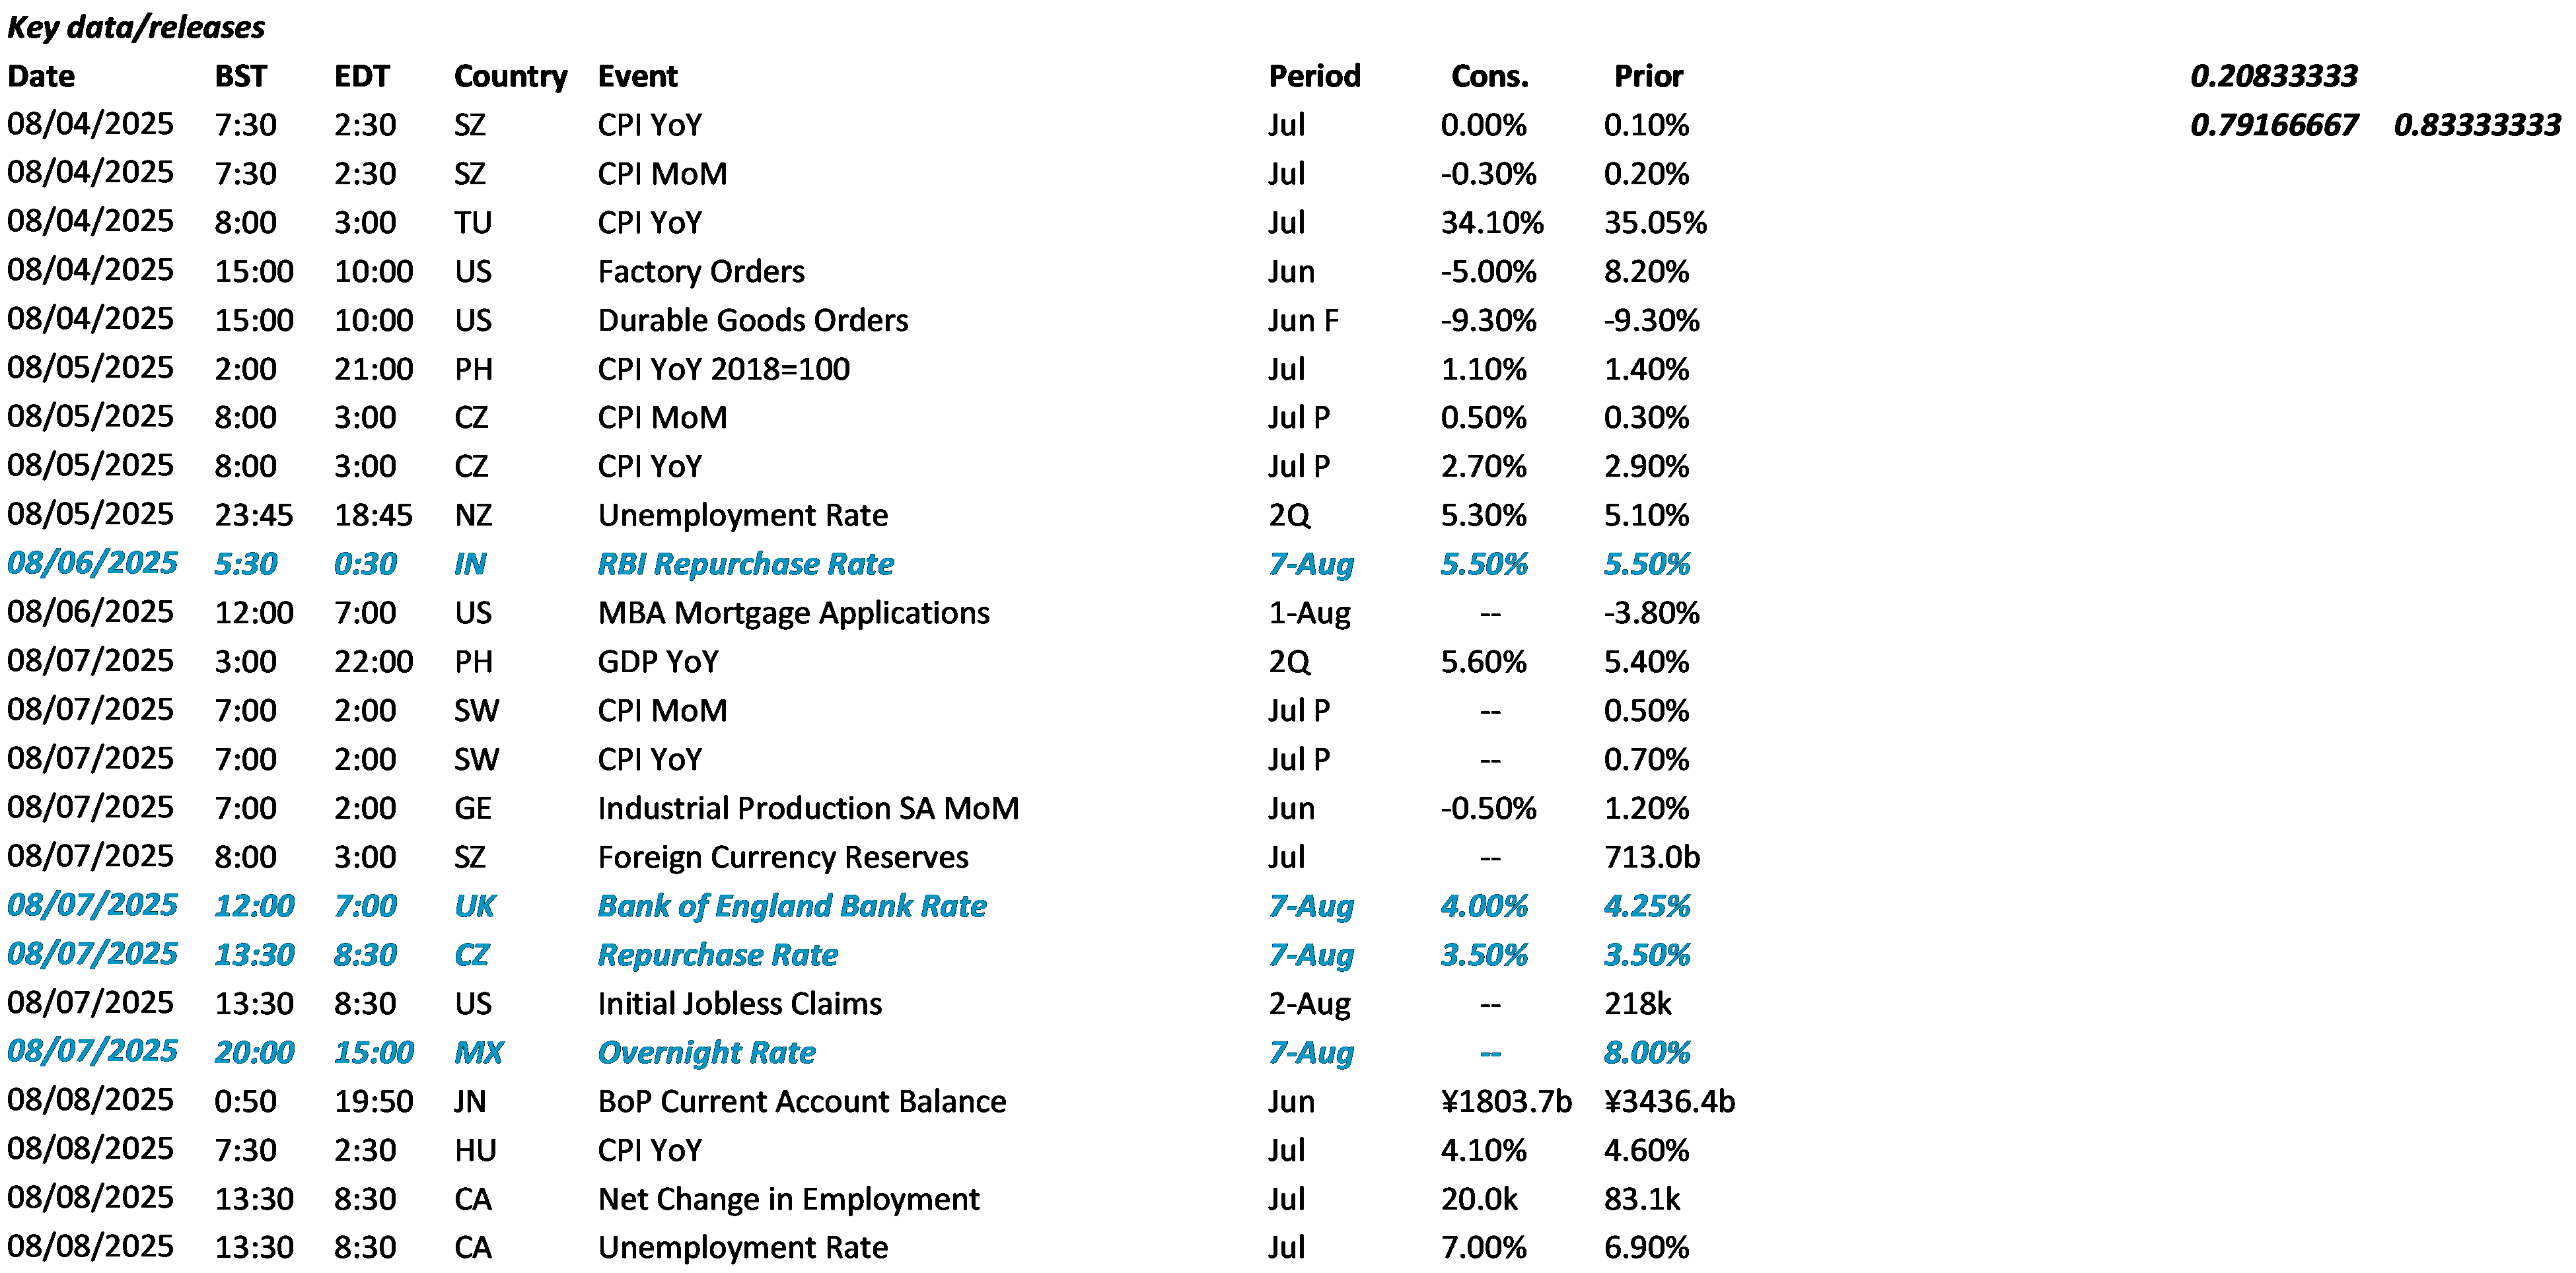
Data Calendar
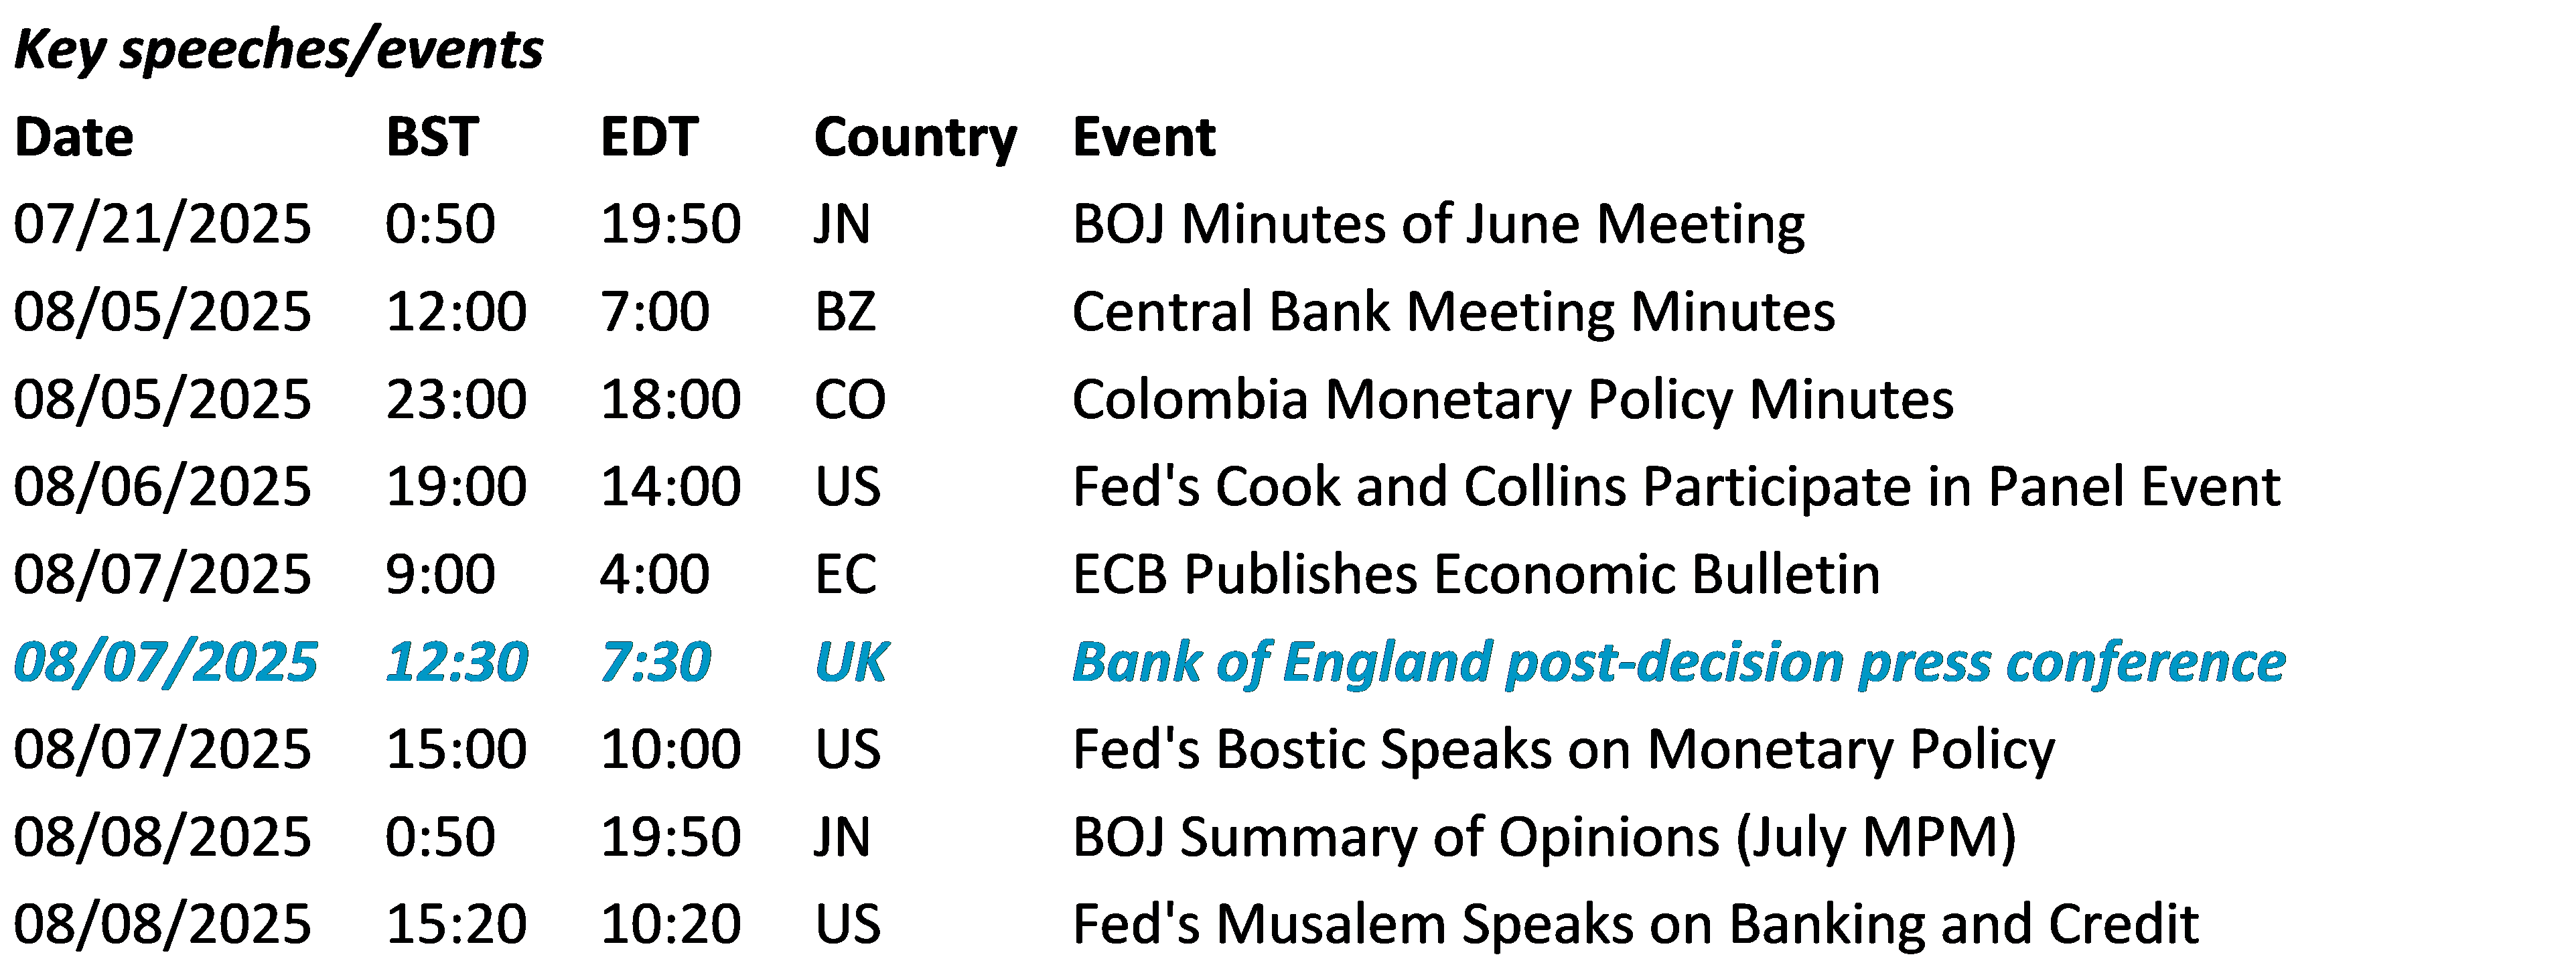
Event Calendar