Market Movers: Speed Bumps
Market Movers highlights key activities and developments before the U.S. market opens each morning.
Market Movers highlights key activities and developments before the U.S. market opens each morning.

Bob Savage
Time to Read: 12 minutes
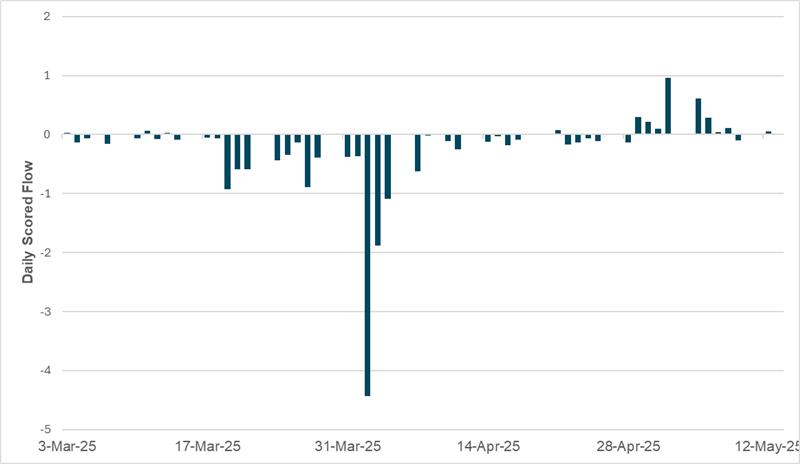
EXHIBIT #1: MXN FLOW RECOVERY FALTERS AHEAD OF BANXICO DECISION
Source: BNY
The run-up to the Banxico decision today has seen some recovery interest in MXN, but overall flows since the beginning of March are lackluster. The currency was heavily sold (or local assets faced heavy hedging interest) during the most intense period around “Liberation Day” and the early challenges vis-à-vis US trade policy beforehand also strongly inhibited inflows. Nonetheless, on a macro basis investors see Mexico in a favorable light, with the risks from tariffs contained under the USMCA umbrella. However, this drives insufficient interest to lift MXN inflow, and this speaks to broader weakness in the carry environment. FX is simply not the main instrument to express a risk positive view. In Mexico’s case, it is the bond market where we expect a stronger impact, but elevated hedging interest compared to previous waves of EM investment will have an impact on MXN performance. The bottom line is that Banxico cannot rely too much on terms of trade to help bring down inflation as fiscal restraint and associated policy credibility is a more impactful force. Meanwhile, the drop in oil prices will also have an impact on Mexico’s balance of payment and this is likely offsetting any positivity toward real rates from lower headline inflation.
Risk sentiment wavers despite ongoing signals for trade deals and peace talks. Today’s price action looks like a speed bump for talking up markets too fast. Oil is off 4% on the day as President Trump is optimistic for an Iran nuclear deal. Bonds globally are rallying. APAC sees further dollar selling led by JPY up 0.7%. In EMEA the better GDP results drove CHF up 0.6%. Stronger FX isn’t helping stocks in either region. Some of this might be about yesterday’s news, with U.S. Treasury sources saying they are not making USD revaluation part of tariff negotiations. The tech sector in Asia saw profit-taking and doubt about faster trade deals. The linkage of FX to trade talks started with South Korea yesterday and hangs over today despite reports. What seems to be the biggest driver for USD weakness – cross-border hedging of U.S. investments – is further driving bond markets. Stronger currencies should allow for easier monetary policy. The exceptions are in places where inflation is not cooperating – like Japan where the 30y continues to rise. Similarly, a weaker USD is another factor for FOMC wait-and-see bias. How this plays out in the real economy shows up today in the host of economic data, from jobless claims to retail sales to more key Fed manufacturing surveys. The bear market fears of April have all but evaporated, but many investors are still cautious. Proof that tariffs are good for the U.S. will require real data to be positive in the months ahead. The pain of policy uncertainty and the cost of financial conditions tightening in April from “Liberation Day” are likely going to show up in the data today, which will be the baseline for a May recovery. How the Fed thinks about all this will also matter given Powell speaks today. What this means for markets today is volatility as data return to driving bonds and stocks and the dollar as the main shock absorber for any surprises.
Trade ministers from the top economies that make up the Asia-Pacific Economic Cooperation, or APEC, are meeting on South Korea's Jeju Island through Friday, focusing on artificial intelligence innovation for trade facilitation, connectivity through multilateral trading system and prosperity through sustainable trade. U.S. Trade Representative Jamieson Greer is set to attend the summit and hold bilateral talks with attendees. MSCI Asia +1.268% to 194.79, BBG Asia Dollar Index -0.036% to 91.8099, BBG AGG APAC Government High Grade USD -1.7bp to 4.922%.
In Q1 2025, U.K. GDP grew by 0.7%, a marked improvement from 0.1% in Q4 2024, with annual growth reaching 1.3%. Services and production output rose 0.7% and 1.1%, respectively, while construction remained flat. On the expenditure side, growth was driven by household consumption, business investment and net trade. Business investment jumped 5.9%, and export volumes rose 3.5%. Real GDP per head increased 0.5%, ending two quarters of decline. Nominal GDP rose 1.6%, largely due to higher employee compensation. Despite a 0.5% drop in government consumption, private sector wage growth and increased inventories supported income growth. Compared to G7 peers, the U.K. showed relatively strong quarterly GDP and per capita performance. The implied GDP deflator rose 0.8%, reflecting modest domestic inflationary pressures. FTSE 100 -0.287% to 8560.35, GBPUSD +0.083% to 1.3274, 10y gilt -1.5bp to 4.698%.
Mainland Norway’s GDP rose by 1.0% in Q1 2025, its strongest quarterly growth since early 2022, rebounding from a 0.4% decline a year earlier. Excluding electricity and fishing, growth was still solid at 0.8%. The expansion was supported by a 1.6% rise in household consumption, driven by a 2.0% increase in goods consumption, especially cars, ahead of April’s tax hike. Services consumption rose 0.5%. Employment and hours worked both grew 0.4%. Manufacturing output increased, while oil and gas production declined. Total GDP, including petroleum, was flat. However, exports rose 6.8% in value despite a 1.9% fall in volume. Imports fell, pushing the trade surplus to NOK 240 billion, NOK 57 billion higher than Q1 2024, marking the highest surplus since Q1 2023. Public sector consumption also grew, though government investment declined. OSE +0.081% to 1536.33, EURNOK -0.178% to 11.6232, 10y NGB +0.7bp to 4.096%.
Switzerland’s flash GDP expanded by 0.7% in Q1 2025, marking the strongest quarterly performance since early 2023. This growth was driven mainly by the services sector, with industry also contributing positively. It continued a consistent upward trend in quarterly expansion: 0.1% in Q3 2023, 0.2% in Q4, 0.3% in Q1 2024, followed by 0.4%, 0.5%, and 0.6% in subsequent quarters. The GDP volume index has also risen steadily, from around 99.7 in early 2023 to over 103 in Q1 2025, reflecting sustained and broad-based economic momentum. SMI -0.155% to 12113.35, EURCHF +0.36% to 0.93811, 10y Swiss GB -1.8bp to 0.373%.
Australia April unemployment rate steady at 4.1% y/y. April employment increased by 89k of which 59.5k full time and 29.5k part time. The participation rate rose to 67.1% while the employment-to-population ratio was unchanged at 61.1%. The front-end of AUD OIS interest rates pricing is 3-5bp higher across the curve, but markets continue to price in a 25bp rate cut next week to 3.85%. Elsewhere, Australia May consumer inflation expectation eased from 4.2% to 4.1% y/y. ASX -0.291% to 4651.07, AUDUSD -0.14% to 0.6419, 10y ACGB +5.6bp to 4.534%.
U.S. May New York Fed Empire Manufacturing – marginal improvement to -8.0 from
-8.1 expected.
U.S. April retail sales, ex-auto – expected to show flat growth headline basis, but +0.3%m/m on a core basis.
US April PPI ex-food and energy – expected to rebound to 0.2% m/m, 3.1% y/y from 3.3% y/y. Headline expected to fall to 2.5% y/y from 2.7% y/y.
U.S. weekly jobless claims – expected to remain unchanged at 228k.
U.S. May Philadelphia Fed business outlook – improvement to -11 from -26.4 expected, still in contraction territory.
U.S. April industrial production, capacity utilization, manufacturing production – marginal increase of 0.1% expected after -0.3% m/m in March.
U.S. March business inventories – steady pace of expansion at 0.2%m/m expected.
U.S. May NAHB Housing Market Index – expected to remain unchanged at 40.0.
Central Bank of Mexico decision – cut of 50bp expected, bringing the overnight rate down to 8.50%.
Fedspeakers: U.S. Fed Daly speaks at a fireside chat at the California Bankers Association’s 2025 Annual Conference. Fed Chair Jerome Powell gives remarks on the framework review at the Thomas Laubach Research Conference.
Mood: iFlow Mood continues to normalize at a fast pace. Equities buying momentum is back to the strongest levels since the end of January 2025 while demand for sovereign bond remains elevated.
FX: SEK, JPY, AUD and TWD posted the most outflows against inflows in EUR and GBP. APAC FX was broadly sold against mixed flows in the rest.
FI: Demand for Brazilian government bonds as well as cross-border buying for both U.S. Treasurys and Eurozone government bonds.
Equities: APAC equities posted broad buying against selling bias in the G10 complex, while flows in LatAm and EMEA were mixed. For global equities, the health care and communication services sectors were the most sold against best demand in energy and real estate sectors.
“There will always be rocks in the road ahead of us. They will be stumbling blocks or stepping stones; it all depends on how you use them.” – Friedrich Nietzsche
“National borders aren’t even speed bumps on the information superhighway.” – Tim May
Central bank data show personal remittances from overseas Filipinos rose by 2.6% year on year to $3.13 billion, with land- and sea-based workers contributing. Cumulative remittances for January-March reached $9.4 billion, up 2.7% from the same period in 2024. Of this, bank-transferred cash remittances totaled $2.81 billion in March and $8.44 billion for the quarter, increasing 2.6% and 2.7%, respectively. The rise was driven by higher inflows from the U.S., Singapore, Saudi Arabia and the U.A.E., with the U.S. remaining the top source. PSEi -1.297% to 6466.86, USDPHP +0.194% to 55.75, 10y PHGB -564.7bp to 6.202%.
Indonesia’s Q1 external debt rose to $430.4 billion, growing 6.4% y/y, up from 4.3% in Q4 2024. This acceleration was driven by public sector debt, particularly government external debt, which reached $206.9 billion, up 7.6% y/y. The rise reflected loan drawdowns and strong foreign inflows into government securities. Private external debt declined 1.2% y/y, a smaller contraction than in Q4. Long-term debt dominates, ensuring sustainability, with a total external debt-to-GDP ratio of 30.6%, with long-term maturities comprising 84.7% of this amount. JCI +1.192% to 7063.089, USDIDR +0.212% to 16515, 10y IDGB +1.7bp to 6.916%.
Taiwan finds no major issues with state banks’ Treasury exposure. Note that eight state-backed banks held a total of around TWD 340bn in U.S. Treasurys, and U.S. Treasury investments accounted for as much as 15.6% of total investment assets. Elsewhere, the Taiwan finance minister reiterated that talks with the U.S. didn’t involve forex issues. TAIEX -0.242% to 21730.25, USDTWD +0.319% to 30.172, 10y TGB -100.5bp to 1.59%.
New Zealand April food price rose 0.8% m/m, 3.7% y/y. Top contributors are 5.2% y/y gains in grocery food group (milk +15% y/y, cheese +24% y/y) and 6.8% y/y higher for non-alcoholic beverages. This might exert further upward pressure on the broader CPI index. NZX 50 +0.795% to 12880.83, NZDUSD -0.17% to 0.5889, 10y NZGB -1.3bp to 4.64%.
Japanese investors posted the best weekly buying of foreign bonds since September 2024 as of last Friday. Demand for foreign equity continues with record ¥8231bn buying year to date. Foreign investors net sold Japanese bonds for the second week as the JGB yield fell back toward 1.50%, while continuing to cover their short Japanese equities position. Year to date remains net sold ¥-383bn. Nikkei -0.977% to 37755.51, USDJPY +0.576% to 145.91, 10y JGB +2.1bp to 1.481%.
Indonesia March external debt increased by $2.73bn to hit a record high of $430.4bn. The main contributor is the higher debt accumulated by the government, up $2.56n at $207bn. Elsewhere, financial corporations and non-financial corporations’ external debt stood at $38.4bn and $157bn, respectively. JCI +1.192% to 7063.089, USDIDR +0.212% to 16515, 10y IDGB +1.7bp to 6.916%.
Q1 GDP in both the euro area and the EU increased by 0.3% q/q, according to Eurostat’s flash estimate. This marked a modest acceleration from Q4 2024, when GDP rose by 0.2% in the euro area and 0.4% in the EU. On an annual basis, GDP expanded by 1.2% in the euro area and 1.4% in the EU, maintaining the same pace as the previous quarter. Employment also showed positive momentum, with the number of employed persons rising by 0.3% in the euro area and 0.2% in the EU compared to the previous quarter. Year-on-year, employment grew by 0.8% in the euro area and 0.6% in the EU, up slightly from 0.5% EU-wide growth in Q4 2024. EuroStoxx 50 -0.494% to 5376.77, EURUSD +0.188% to 1.1196, BBG AGG Euro Government High Grade EUR -0.1bp to 2.813%.
Industrial production rose by 2.6% in the euro area and 1.9% in the EU m/m in March, driven by strong gains in capital and consumer goods. Year on year, output increased by 3.6% in the euro area and 2.7% in the EU. Notably, non-durable consumer goods surged over 12%, while intermediate goods declined slightly. Ireland recorded the strongest monthly growth (+14.6%), while Luxembourg saw the sharpest decline (-6.3%), reflecting varied national industrial momentum.
U.K. monthly real GDP grew by 0.2% in March 2025, following 0.5% growth in February. Over the three months to March, GDP rose 0.7% compared with the previous quarter, mainly driven by broad-based growth in the services sector. Services output increased 0.4% in March, after 0.3% in February, and expanded 0.7% over the quarter, making it the largest contributor to GDP growth. Production output fell 0.7% in March after a revised 1.7% rise in February yet still rose 1.1% over the quarter. Construction output rose 0.5% in March following a downwardly revised 0.2% rise in February but showed no growth for the quarter overall. These figures highlight the central role of services in sustaining economic momentum, despite mixed performance in other sectors. FTSE 100 -0.287% to 8560.35, GBPUSD +0.083% to 1.3274, 10y gilt -1.5bp to 4.698%.
U.K. March trade data show goods imports fell by £0.4 billion (0.7%) due to lower non-EU imports, partly offset by a rise from the EU. Goods exports rose by £0.2 billion (0.8%), mainly to the EU. Exports to the U.S. increased for the fourth straight month, up £2.4 billion in Q1 2025, with imports from the U.S. also rising by £1.3 billion. The overall trade deficit in goods and services narrowed by £3.6 billion to £6.6 billion. The goods trade deficit fell by £4.3 billion to £55.2 billion, while the services surplus dipped £0.7 billion to £48.6 billion.
Norway’s external trade in goods (excluding ships and oil platforms) saw falling volumes but rising export prices. Overall, export volumes declined 4.4% and import volumes 4.6%, while export prices rose 6.6% and import prices dipped 0.5%. Fuel exports dropped 3.6% in volume but surged 7.4% in price, supporting the trade balance. Manufactured goods performed well, with export volumes up 1.6% and import volumes down 6.3%. Food exports fell sharply by 21.5% in volume but saw a 10.9% price increase, softening the impact. Price dynamics broadly improved trade terms. OSE +0.081% to 1536.33, EURNOK -0.178% to 11.6232, 10y NGB +0.7bp to 4.096%.
Germany’s April wholesale prices rose by 0.8% y/y but fell 0.1% compared to March. This marks a continued slowdown from annual increases of 1.3% in March and 1.6% in February. The year-on-year rise was driven primarily by higher prices for food, beverages and tobacco (+4.6%), especially items like coffee, tea, and spices (+32.2%) and bakery goods (+16.6%). Non-ferrous metals and related products also saw significant increases (+21.3%). However, declines were recorded in wholesale prices for solid fuels and oil products (-8.4%), computers (-5.8%) and iron and steel products (-4.4%). DAX -0.235% to 23471.78, EURUSD +0.188% to 1.1196, 10y Bund -2.2bp to 2.677%.
Switzerland’s Producer Price and Import Price indices rose by 0.1% m/m in April, reaching 106.9 (base: December 2020 = 100), but declined by 0.5% y/y. The Producer Price Index increased 0.2% from March, driven by higher prices for machinery (+1.1%), petroleum products (+3.2%) and electrical equipment (+0.4%). The Import Price Index remained flat overall but included notable rises in machinery (+1.3%) and gasoline (+6.0%), offset by significant drops in petroleum and natural gas prices (-6.2%). Core inflation for total supply rose 0.2% from the previous month and 0.1% y/y, indicating modest underlying price pressure despite pronounced sector-specific shifts. SMI -0.155% to 12113.35, EURCHF +0.36% to 0.93811, 10y Swiss GB -1.8bp to 0.373%.
Polish GDP rose by 3.2% y/y in Q1 2025 (unadjusted), up from 2.2% in Q1 2024. On a seasonally adjusted basis, GDP increased by 0.7% q/q and 3.8% y/y in constant prices (reference year: 2020). This marked a continuation of the steady growth trend observed throughout 2024. The seasonally adjusted quarterly growth figure of 100.7 (previous quarter = 100) reflects consistent momentum. These preliminary results will be revised in the full estimate due on June 2, 2025. The data suggest a broad-based economic expansion with increasing strength compared to the previous year’s performance. WIG -0.615% to 103176.8, EURPLN -0.01% to 4.2323, 10y PGB -0.2bp to 5.453%.
Polish CPI for April came in at 4.3% y/y, with services up 6.3% and goods up 3.5%. Compared to March, overall prices increased by 0.4%, driven by a 1.1% rise in services and a 0.2% rise in goods. Key contributors to the annual inflation included housing and utilities (+8.3%), food (+5.3%) and restaurants and hotels (+6.1%). Transport prices fell 5.6% y/y, offsetting some of the gains. Month on month, notable increases came from food, clothing and footwear, and recreation. The April reading slightly exceeded the flash estimate and remained above the National Bank of Poland’s inflation target range of 2.5% ±1 pp.