Market Movers: Soggy
Market Movers highlights key activities and developments before the U.S. market opens each morning.
Market Movers highlights key activities and developments before the U.S. market opens each morning.

Bob Savage
Time to Read: 11 minutes
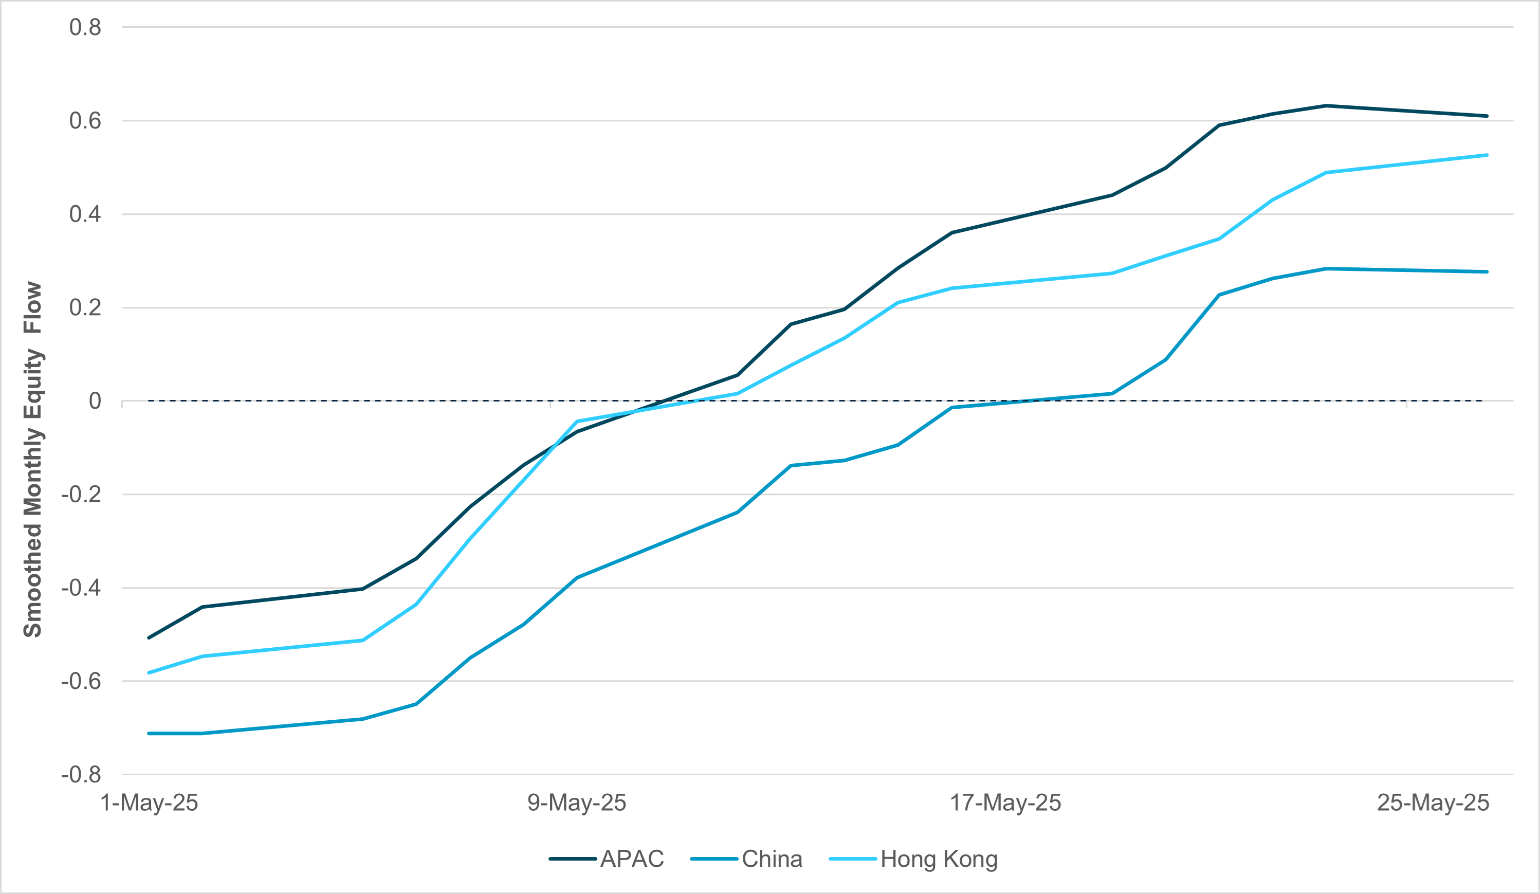
EXHIBIT #1: CONVICTION GROWING IN APAC ASSETS, LED BY EQUITY FLOW
Source: BNY
Despite uneven progress on U.S. trade deals and rising tensions – especially China's recent pushback against U.S. chip restrictions – markets appear to be discounting risks in the region. Flows last week were largely positive across APAC, with no major outflows in any asset class. Most notably, China recorded rare, comprehensive inflows across FX, equities and fixed income, with equity and bond inflows the strongest in the region. This suggests growing conviction in Chinese assets, despite concerns over weak stimulus and slowing growth. Hong Kong is also benefiting, with equity flows hitting their highest levels on a three-month rolling basis. Under-positioning in both Hong Kong and mainland China points to further upside potential, which may challenge regional central banks’ currency management. CNY outflows have been limited, while the HKD has remained firm aside from brief mid-month intervention. Although some April FX flows may reflect hedge unwinds, recent activity looks more conviction-driven. PBoC guidance and Taiwan’s FX flexibility suggest greater tolerance for currency strength. The bulk of inflow momentum centers around equity markets. Compared to Europe, APAC equity flows have been less consistent, and with margin compression risks still present, China and Hong Kong flows must rely on more than just attractive valuations.
Risk sentiment mixed to weaker, balancing between bonds and equities moderating the May uptrend. Like the weather, moods are soggy with the month-end work of rebalancing risk beating out animal spirits to chase trends. Overnight news was also mixed for risk-taking as the RBNZ cut rates again as expected but now has less than 50bp more easing ahead despite ongoing tariff uncertainty, while a poor 40y JGB sale – the worst since July 2024 – puts the focus back on problems in Japan and ongoing geopolitical conflicts, from the war in Ukraine to the conflict involving Israel and the Houthis. All of this provides enough noise to slow further rapid equity rallies. The focus of the U.S. session will be on the FOMC minutes and whether the central bank can react to uncertainty and look through tariff price effects. After the close, the Nvidia earnings will be key, with 5 p.m. call and Q2 guidance just as important as the Q1 earnings, as revenue is expected to be around $43.3bn and EPS at $0.73. How AI demand plays out has far-reaching implications for the U.S. market as we head into June, and many will be waiting to see today’s report before doubling into the May bounce-back in risk. Today’s headlines – about the risks of Lagarde’s succession, about more debt auctions ahead and about divisions over tax-and-spend policies everywhere – mean volatility and uncertainty are still muddying the flow of money.
The Reserve Bank of New Zealand (RBNZ) cut 25bp to 3.25% with a downward revision of the Official Cash Rate (OCR) and CPI. RBNZ said that 3.25% is “into neutral zone.” The decision was not unanimous. The RBNZ revised its OCR projection lower, expecting an average of 2.92% in Q4 2025 and a bottom of 2.85% in Q1 2026. CPI is projected to fall below 2% in H1 2026, reaching 1.9%, then hovering around 2.1% through H2 2026 and 2027. The central bank noted that the economy is beginning to recover after a mid-2024 contraction, aided by strong export prices and lower rates. Spare capacity remains but is expected to diminish. Labor market conditions have eased, with slower wage growth and easier hiring. However, new U.S. tariffs may weigh on exports and investment. Inflation impacts remain uncertain, though fiscal policy is viewed as broadly neutral, with investment incentives offset by reduced government spending. NZX 50 -1.749% to 12362.26, NZDUSD +0.37% to 0.5971, 10y NZGB +3.8bp to 4.619%.
In April 2025, the ECB Consumer Expectations Survey showed that consumers' median inflation expectations for the next 12 months rose to 3.1%, matching perceived past inflation and reaching the highest level since February 2024. Expectations for longer-term inflation (3 and 5 years) remained unchanged. Nominal income growth expectations decreased slightly, while expected spending growth increased. Economic growth expectations turned more negative, and the expected unemployment rate edged up to 10.5%. Consumers forecast home prices to rise 3.2% over the next year, with lower-income households expecting higher increases. Expectations for mortgage rates also rose to 4.5%. More households reported tighter credit conditions and more expect further tightening in the year ahead. EuroStoxx 50 -0.202% to 5404.49, EURUSD 0% to 1.1328, BBG AGG Euro Government High Grade EUR +1.5bp to 2.859%.
In Q1 2025, France’s real GDP grew modestly by 0.1%, rebounding from a 0.1% decline in the previous quarter. Household consumption declined by 0.2%, mainly due to a sharp drop in spending on transport equipment. Investment remained flat, as weaker construction was offset by strong growth in information and communication sectors. Foreign trade weighed heavily on GDP, with exports down 1.8% and imports up 0.5%, resulting in a -0.8-point contribution from net trade. Inventory buildup, particularly in chemicals, pharmaceuticals and transport equipment, contributed positively (+1.0 point). Household purchasing power and savings rates both rose slightly, while non-financial corporations saw a slight dip in profit margins. CAC40 +0.009% to 7827.48, EURUSD 0% to 1.1328, 10y OAT +2.6bp to 3.232%.
In April 2025, German import prices fell by 0.4% y/y and by 1.7% from the previous month – the sharpest monthly decline since April 2020. Export prices rose 1.0% compared to April 2024 but dropped 0.5% m/m. The decline in import prices was driven primarily by an 11.2% y/y drop in energy costs, especially crude oil, coal and refined products. Excluding energy, import prices rose 0.8% annually. Food imports, such as juices, meat and dairy, saw strong price increases, while some agricultural goods like pork and onions fluctuated sharply. On the export side, consumer and investment goods drove price growth, with notable increases in coffee and dairy products. Energy exports showed mixed trends, with natural gas prices rising but refined petroleum falling compared to the previous year. DAX -0.134% to 24194.09, EURUSD 0% to 1.1328, 10y Bund +2.1bp to 2.553%.
Germany’s unemployment rate rose to 3.8% in April, up from 3.2% in April 2024, with the number of unemployed increasing by 256,000 to 1.66 million – an 18.2% y/y rise. Seasonally adjusted, unemployment stood at 1.58 million, slightly down from March, while the adjusted unemployment rate remained unchanged at 3.6%. Total employment held steady at 45.8 million people (seasonally adjusted), showing no monthly change. Non-adjusted figures showed a modest rise of 77,000 employed (+0.2%) from March, though below the typical April increase. Year on year, employment declined by 61,000 people (-0.1%), continuing a mild downward trend seen since late 2024. Separate Bundesbank figures show that Germany’s unemployment claims rate for May was unchanged at 6.3%, despite a significant rise of 34,000 in unemployment on the month.
Australia April headline CPI stood unchanged at 2.4% while trimmed mean ticked higher from 2.7% to 2.8% y/y. The largest contributors to the annual movement were food and non-alcoholic beverages (+3.1%), housing (+2.2%), with rents +5%, electricity (-6.5%), and recreation and culture (+3.6%). Transport was the biggest drag at -3.2% (of which automotive fuel was -12% y/y). Elsewhere, Australia Q1 total construction work done was flat from upwardly revised 0.9% q/q in Q4 2024 or 3.5% y/y vs. 1.8% y/y in Q4 2024. Looking into breakdown, residential building work done rose 1.6% q/q, 7.0% y/y while engineering work done fell -1% q/q but +4.5% y/y. ASX +0.098% to 4763.77, AUDUSD +0.031% to 0.6445, 10y ACGB +2bp to 4.332%.
U.S. May Richmond Fed Manufacturing Index consensus at -9 from -13, with the focus on service sector conditions as well as prices and jobs.
U.S. FOMC meeting minutes, with a focus on tariff effect on growth and inflation.
U.S. Treasury sells $70bn in 5-year notes along with $28bn in 2-year FRN and $60bn in 4-month bills.
Mood: iFlow Mood accelerates further into positive territory with strong demand in equities, the most since December 2020. Sovereign bond demand eases to the slowest pace since April.
FX: Broad FX inflows across regions globally, with the most in APAC, followed by the CEE region. Notable outflows in SEK, PLN and AUD.
FI: Good buying in Norway and Malaysia government bonds, followed by Japan, China and U.S. Treasurys. Australia government bond selling continues.
Equities: DM APAC the only region with net selling in equities against buying in EM EMEA. Within EM APAC, industrial and energy sectors were significantly bought, followed by materials, consumer staples and health care, while financials was the only notable sector with outflows.
“A ground plan is important in terms of its rigor. If your plan is soggy and weak, your production will be soggy and weak.” – Daivd G. Hays
“If you cast your bread upon the water and you have faith, you’ll get back cash. If you don’t you will get soggy bread.” – Don King
French April household consumption expenditures on goods rebounded slightly, rising by 0.3% in volume after a revised 1.1% decline in March. The increase was primarily driven by a 2.1% rise in food consumption and a 0.7% uptick in spending on engineered goods. However, this recovery was partially offset by a significant 3.6% drop in energy consumption, which weighed on the overall growth in household spending. CAC40 +0.009% to 7827.48, EURUSD 0% to 1.1328, 10y OAT +2.6bp to 3.232%.
In Q1 2025, payroll employment in France was nearly stable, declining slightly by 0.1% (-20,900 jobs) after a sharper 0.4% drop in Q4 2024. Private sector employment fell by 28,700 jobs (-0.1%), down 0.6% y/y, while public sector employment rose modestly by 7,800 jobs (+0.1%), up 0.5% from Q1 2024. Despite the recent declines, total payroll employment remained 4.8% above pre-pandemic levels (end of 2019), with the private sector up 5.2% and the public sector up 3.3%.
In April 2025, producer prices in French industry dropped sharply by 3.9%, following a 1.1% decline in March. The fall was more pronounced for the domestic market (-4.3%), especially in mining, energy and water sectors (-14.7%), driven by a steep 24.4% drop in electricity prices due to increased renewable generation and mild weather. Export market prices also declined (-2.8%). Refined petroleum prices fell 8.4% m/m and 26.8% y/y, reflecting weaker global oil prices and a stronger euro. Excluding energy, producer prices declined slightly (-0.3%) after six months of gains. Prices for electronic equipment and other industrial products also dipped. Year on year, overall producer prices fell 1.3%.
Norway’s April retail trade volume rose 0.7% from the previous month and 4.2% y/y, according to Statistics Norway. Non-specialized store sales increased by 1.3% monthly and 2.9% annually. Sales of food, beverages and tobacco rose 2.6% from March but declined 1.9% compared to April 2024. Automotive fuel sales continued to weaken, down 1.0% monthly and 4.6% annually. The standout performer was ICT equipment, with a sharp 12.8% monthly increase and 33.0% y/y growth. The figures, adjusted for seasonality and calendar effects, reflect strong consumer demand in select categories, especially technology, while essential goods and fuel remain more subdued. OSE -0.256% to 1570.49, EURNOK +0.057% to 11.5159, 10y NGB +1.9bp to 4.077%.
Sweden's April retail sales volume rose 0.9% from March, with durables up 1.3% and consumables (excluding Systembolaget) up 0.8%, according to Statistics Sweden. Over the February-April period, sales grew 1.1% from the prior three months. Year on year, retail volume increased by 5.3%, with durables up 8.5% and consumables up 1.9%. In unadjusted figures, total retail volume rose 7.2% from April 2024. Measured in current prices, retail turnover increased 9.2% annually, led by an 11.6% rise in consumables and a 6.6% rise in durables. OMX -0.389% to 2508.007, EURSEK -0.053% to 10.8981, 10y Swedish GB +0.6bp to 2.366%.
Sweden recorded a net trade surplus of SEK 6.6bn in April, with exports totaling SEK 169.5bn and imports SEK 162.9bn. This is slightly lower than the SEK 7.1bn surplus recorded in April 2024. Both exports and imports declined by 7% y/y, partly due to one fewer weekday in April 2025. Trade with non-EU countries generated a surplus of SEK 27.5bn, while trade with EU countries resulted in a SEK 20.9bn deficit. Seasonally adjusted, April’s trade surplus was SEK 8.2bn, up from SEK 7.4bn in March. Cumulatively, from January to April 2025, Sweden posted a trade surplus of SEK 44.8bn, compared to SEK 37.1bn during the same period in 2024. Over this four-month span, exports rose 1%, while imports remained unchanged.
Sweden’s unemployment rate for those aged 20-65 rose to 6.0% in March, up 0.5 percentage points from the previous year. This included 5.8% for women and 6.2% for men. The number of unemployed people increased by 24,000 to 306,000. Unemployment remained significantly higher among foreign-born individuals at 13.1%, compared to 3.6% among those born in Sweden. The total number of employed people aged 15-74 was 5,104,000, a decrease of 12,000 from March 2024, with employment trends varying by sex and region of birth. Wages for non-manual workers continued to grow robustly, at 3.3% y/y.
South Korea Composite Business Sentiment Index (CBSI) for all industries for May 2025 was 90.7 (April: 87.9), the highest since November 2024. The outlook for June is 89.5. Looking into the breakdown, May manufacturing sector CBSI, at 94.7, was the highest since July 2024, and the outlook for June is 93.1, while the May non-manufacturing sector CBSI is 88.1 (April: 84.5) and the outlook for June is 87.1. Elsewhere, South Korea April retail sales eased slightly from 9.2% y/y to 7.2%. KOSPI +1.249% to 2670.15, USDKRW -0.356% to 1371.5, 10y KTB -6.5bp to 2.705%.
South Korea Q1 short-term external debt rose from $146.5bn to $149.3bn, an increase of $2.8bn after a drop of $12bn in Q4 2024. Short-term debt is around 40% of the total external debt of $367.9bn. The short-term external ratio (vs. reserve assets) is 36.5%.
Taiwan’s financial regulator considers letting insurers use six-month average exchange rates, instead of the rate on the last day of a financial report period, to calculate risk-based capital requirements. The easing would lower the impact of FX volatility on capital requirements. Elsewhere, Taiwan final Q1 GDP came in better than expected at 5.48% (flash: 5.37%, Q4 2024: 2.9%). Taiwan statistics office (DGBAS) revised 2025 GDP lower from 3.14% to 3.10%. Note that 2025 GDP profile is heavily front-loaded, with 5.35% in H1 2025 before dropping sharply to 1.0% y/y in H2 2025. DGBAS revised CPI lower from 1.94% to 1.88%, driven by declines in oil and material prices as well as TWD strength, compensating for higher food and rent prices. TAIEX 0.099% to 21357.72, USDTWD -0.154% to 29.897, 10y TGB -0.4bp to 1.574%.
New Zealand April filled jobs down -0.1% m/m from a downwardly revised 0.1% m/m in March. Industries that impacted the most are construction (-6.5% m/m), administrative and support services (-6.7% m/m), manufacturing (-2.3% m/m) and retail trade (-1.5%). Overall, goods producing industries and services sectors are down -0.3% m/m, -4.23% y/y and -0.1% m/m, -1.06% y/y, respectively. NZX 50 -1.749% to 12362.26, NZDUSD +0.37% to 0.5971, 10y NZGB +3.8bp to 4.619%.