Market Movers: Safe and Secure
Market Movers highlights key activities and developments before the U.S. market opens each morning.
Market Movers highlights key activities and developments before the U.S. market opens each morning.

Bob Savage
Time to Read: 11 minutes
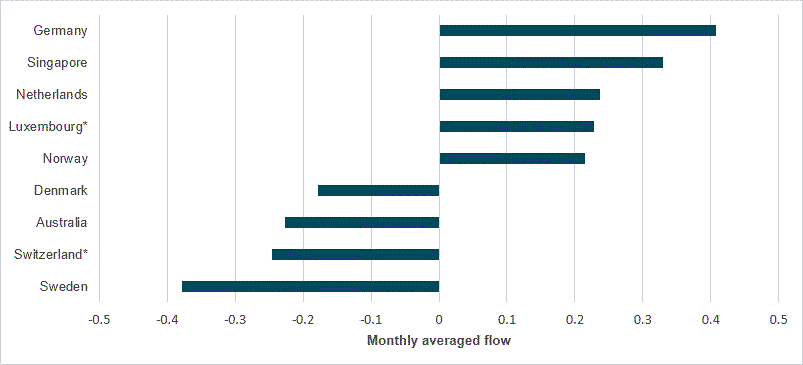
EXHIBIT #1: FLOWS INTO “SUPER AAA” SOVEREIGN BONDS TAME DESPITE GLOBAL FISCAL CONCERNS
Source: BNY
Global bond markets remain nervous over fiscal dominance in developed markets. The U.S. budget sparked concerns for U.S. Treasurys, while movements in the U.K. and Japan underscore the changes in demand dynamics. Assuming that absolute safety means an “AAA” rating with stable outlook from all three major agencies, then alternatives to USTs, JGBs or gilts are slim. The largest bond markets in the space are Australia and Germany; Canada’s loss of AAA from Fitch five years ago materially shrank the pool. This is important given that the sovereign rating has major implications for other issuers in a jurisdiction whose credit quality is anchored by the sovereign. Asset-backed securities, especially mortgage-backed securities (MBSs), covered bonds, and municipal and agency debt, all fall into this category. Most other “super AAA” issuers are based in Europe, while Singapore is the only APAC name. Tracking the flows into sovereign and corporate flow, we find that the “ultra-safety” theme is currently more talked about than actioned upon by cross-border asset allocators. Out of the largest markets, only Germany continues to see good surge flow into sovereign debt, while many of the high-rated European markets, such as those in Scandinavia, the Netherlands and Switzerland, are dominated by domestic long-term investors. Liquidity constraints are also hindering larger inflows into these markets, but we do expect greater demand for covered bond markets across Europe over the medium term as a highly rated alternative. The strength of inflows into Singaporean sovereign bonds are helping to anchor surprisingly strong flows into low-yielding APAC sovereigns. These purchases are likely motivated by safety needs and regional diversification. Some central banks, such as the Swiss National Bank, outright consider SGD a bona fide reserve currency, merited on its ratings alone. However, overall liquidity is limited. Corporate flow is generally negative, and the two phases of strong inflows this year do not appear linked to safety demand.
Risk sentiment was mixed, as bond relief and trade talks helped drive the sixth week of equity inflows for APAC and EMEA. The dollar continued to drop, adding to global central bank easing bias. The exception was Japan, where CPI came higher than expected, maintaining expectations of a BoJ rate hike. The G7 meeting of central bankers and finance ministers ended with more support than discord, also adding to hopes of better trade talks. The holiday weekend in U.K. and U.S. means less liquidity today and less interest that might reverse trends. The weaker USD stands out across markets, with KRW, MYR and INR leading those gains overnight, up nearly 1%; on the week NOK, SEK and PLN are leading gains, up 2.5%. The standout in options markets is EUR, amid a rising view that EUR 1.20 seems easy compared with other USD weakness. The key relief for risk overnight – and one to watch on the day ahead – comes from U.S. bonds, where the 30y was holding above 5% but well off its 5.15% highs yesterday. Debt relief in Japan was also notable; the country’s ultra-long issues also dropped 10bp. The role of higher rates in supporting FX has been reversed in the U.S., and that correlation break remains the biggest change for the week. Some will see a dollar frown rather than a smile from the U.S. budget and point the blame there; others see ongoing trade talks as the key issue, but for the day ahead it may be just chasing momentum that drives markets across bonds, stocks and foreign exchange. The month-end rebalancing will likely test the wisdom of all such strategies and return markets to a focus on volatility and safety.
Germany’s GDP grew by 0.4% q/q in Q1 2025, driven by stronger-than-expected output in manufacturing and exports, especially pharmaceuticals and motor vehicles. Year-on-year, GDP was flat. Exports rose 3.2%, while imports increased by 1.1%. Household consumption climbed 0.5%, though government spending decreased by 0.3%. Investment rose 0.9%, with gains in construction and equipment. Gross value added increased by 0.6%, led by manufacturing (+1.0%) and construction (+0.9%), while services posted mixed results. Employment fell 0.1% y/y, though hours worked per person rose slightly. Labor productivity per hour declined by 0.5%. National income rose 3.3%, with employee compensation up 4.6%. However, due to higher social contributions, net wages rose just 2.6%. The savings rate fell to 13.0%, as consumption outpaced income growth. Compared with other major economies, Germany’s quarterly growth outperformed the U.S. (-0.1%) and matched EU-27 averages (+0.3%), though year-on-year performance was weaker at 0.0% versus 1.4% in the EU. DAX +0.395% to 24093.94, EURUSD +0.435% to 1.133, 10y Bund -3.4bp to 2.609%.
Retail sales volumes in Great Britain climbed by 1.2% in April 2025, marking the fourth consecutive monthly increase and a 5.0% y/y rise. The three-month period to April saw a 1.8% increase compared with the prior three months, the strongest since July 2021. Food store sales volumes surged 3.9%, rebounding from earlier declines, helped by favorable weather. Non-food store sales fell 0.7%, weighed down by drops in clothing and miscellaneous retailers. Department and household goods stores, however, saw modest gains. Online sales dipped 0.3% m/m, but were 6.1% higher than a year ago. Total retail spending rose by 0.7%, though the share of online sales edged down to 26.8%. Overall, retail volumes are now slightly above pre-pandemic levels, reaching their highest point since July 2022. Retailers widely cited good weather as a key driver, particularly for food and household sectors, though non-food and online channels showed mixed performance. FTSE 100 +0.432% to 8776.99, GBPUSD +0.395% to 1.3472, 10y gilt -3.1bp to 4.72%.
Sweden’s unemployment rate stood at 8.9% in April 2025, with 513,000 people out of work. Seasonally adjusted data showed a slight improvement, with the rate easing to 8.6%. Youth unemployment remained elevated at 23.8%, with 135,000 of the 167,000 unemployed young people being full-time students. Long-term unemployment affected 161,000 individuals. Despite the subdued overall picture, some signs of recovery emerged. Employment rose to 5.261 million (69.0% employment rate), improving to 69.1% on a seasonally adjusted basis. Labor force participation reached 75.7%, with the total labor force at 5.774 million. Hours worked averaged 157.0 million per week. The number of employees climbed to 4.780 million, driven by a rise in permanent roles. While challenges remain, recent gains in employment and a decline in joblessness suggest gradual labor market recovery. OMX +0.796% to 2521.489, EURSEK -0.238% to 10.8474, 10y Swedish GB -2.8bp to 2.444%.
Japan April national headline CPI was unchanged at 3.6%, while core inflation ex-fresh food and energy rose from 2.9% to 3.0% y/y. Core inflation is the highest since February 2024 (3.2%). Food prices surged 7.0%, with rice and chocolate up 98.6% and 31.0%, respectively, reflecting seasonal price resets and possible supply pressures. Services inflation eased slightly to 1.3%. Despite strong wage growth from spring negotiations, consumption remains weak and real incomes are under pressure. Inflation has now been above the BoJ’s 2% target for over three years. This data follows January’s rate hike to 0.5%, which ended a decade of ultra-loose policy. With Q1 growth contracting and inflation still persistent, Japan faces a stagflation-like mix of rising prices and weak demand, complicating the policy outlook and raising the stakes for further decisions later this year. Nikkei +0.472% to 37160.47, USDJPY -0.445% to 143.37, 10y JGB -3.7bp to 1.536%.
Fitch Ratings revised its 2025 outlook for Taiwan’s life insurance sector from “neutral” to “deteriorating” due to heightened risks to earnings and capital from a sharp 8% appreciation by the TWD in early May. With around 70% of insurers’ assets in foreign currencies, mostly U.S. dollar-denominated, the sector faces significant currency mismatches as liabilities remain in TWD. The recent currency surge has likely depleted foreign exchange valuation reserves and raised hedging costs. Although insurers have increased hedging to 60%-70% and expanded U.S. dollar policy sales (37% of 2024 first-year premiums), profitability is under pressure. Policy surrenders have not yet increased but remain a risk. Liquidity concerns are also rising, as many assets are held at amortized cost despite market losses from higher U.S. rates. Ongoing regulatory shifts, including TW-ICS and IFRS 17, are compounding the strain. Fitch warns that further TWD gains and earnings weakness could trigger negative rating actions. Meanwhile, Taiwanese industrial production increased by 22.13% y/y in April. TAIEX -0.086% to 21652.24, USDTWD -0.1% to 30.01, 10y TGB -0.6bp to 1.565%.
U.S. April new home sales consensus sees a 4% drop to 695k, from 724k in March.
Fedspeakers: St. Louis Fed President Musalem and Kansas City Fed Schmid to speak in a fireside chat on the Fed and the U.S. economy; Fed Governor Cook to give a speech on financial stability.
Mood: iFlow Mood is marching firmly toward zero and could turn positive in the coming days if the trend continues. Equity buying remains strong, with first signs of slowing demand for sovereign bonds.
FX: AUD and SEK recorded the most outflows, against inflows in TRY, CZK and CNY. Overall, EMEA currencies posted the most demand, against light selling in G10. The majors, i.e., USD, EUR, GBP and JPY, were lightly bought.
FI: Cross-border investors net sold both U.S. Treasurys and Eurozone government bonds. Australian, Japanese, Brazilian and Chinese government bonds were bought.
Equities: Equity demand was strong in emerging markets, notably in Chile, Poland and Taiwan, while there was moderate selling in G10 equities. Within EM, real estate was the only sector with outflows, while the industrial sector posted significant inflows, followed by good buying in the materials, consumer staples and information technology sectors.
“When nothing is sure, everything is possible.” – Margaret Drabble
“There is nothing so strong or safe in an emergency of life as the simple truth.” – Charles Dickens
Eurozone negotiated wage growth slowed sharply to 2.4% y/y in Q1 2025, down from 4.1% in Q4 2024 and significantly below the 5.4% peak recorded last year. This marks a substantial easing in pay pressures and supports the European Central Bank’s view that inflation is on track to return to its 2% target. Services inflation, where wages have a strong influence, stood at 4% in April. Headline inflation was 2.2% last month, and the European Commission expects it to fall to 2% by mid-2025 and below that in 2026. An ECB tracker of expected wage growth also indicates a further slowdown by year-end. Euro Stoxx 50 +0.258% to 5438.48, EURUSD +0.435% to 1.133, BBG AGG Euro Government High Grade EUR +1.5bp to 2.859%.
UK consumer confidence improved in May 2025, with GfK’s Consumer Confidence Index rising three points to -20. All five key indicators saw gains, driven by stronger sentiment about the year ahead. Expectations for personal finances moved into positive territory at +2, up five points, while the outlook for the general economy rose four points to -33. The major purchase index also climbed three points to -16, the highest since late 2024. However, the savings index dipped two points to +28. Despite continued concerns over inflation and global trade tensions, sentiment appears to have improved slightly, possibly aided by the Bank of England’s recent rate cut. Consumers remain cautious, but the upward trend in future-focused indicators suggests a modest recovery in confidence. Compared with a year ago, perceptions of the past year’s economic situation remain worse, but there are tentative signs of growing optimism about personal finances and big-ticket spending. FTSE 100 +0.432% to 8776.99, GBPUSD +0.395% to 1.3472, 10y gilt -3.1bp to 4.72%.
In a step which will provide material inflation relief, Ofgem, the U.K.’s energy regulator, will cut the energy price cap by 7% from July to September 2025, reducing average annual bills by £129 to £1,720. The drop is mainly due to lower wholesale gas prices, though costs remain 10% higher than a year ago. Standing charges for direct debit and prepayment customers will fall by around £19. Ofgem urges consumers to shop around, as fixed tariffs may offer up to £200 in savings. About 35% of customers are now on fixed deals. The regulator also finalized a review of supplier costs, enabling efficiency savings and support measures for energy debt.
South Korea April PPI decreased by -0.1% m/m – the first fall in six months. Year-on-year, PPI eased from 1.3% y/y to 0.9% y/y. Looking into the breakdown, manufacturing products (49% weight) came in flat at 0% from 1.0% y/y, driven by a -7.9% y/y drop in coal & petroleum products, while services (40% weight) eased to 1.5%, the lowest since November 2020 (1.5%). KOSPI -0.061% to 2592.09, USDKRW -0.912% to 1370.4, 10y KTB -2bp to 2.74%.
New Zealand Q1 retail sales ex inflation came in better than expected at 0.8%, from an upwardly revised 1.0% q/q in Q4 2024. Looking into the breakdown, motor vehicle retailing (+3.1% q/q), pharmaceutical (+3.7%), and clothing, footwear and personal accessories (+3.2%) saw the biggest jumps in Q1 2025, while hardware, building and garden supplies, and liquor retailing posted the largest decreases. NZX 50 -0.519% to 12596.5, NZDUSD +0.645% to 0.5937, 10y NZGB -2bp to 4.659%.
In April 2025, Japan’s nationwide department store sales fell 4.5% year-on-year, the third straight monthly decline. Urban areas saw a 5.1% drop, while non-urban regions saw a 2.1% fall. Inbound duty-free sales plunged 26.7%, despite record visitor numbers, due to weaker demand for luxury goods and a stronger yen. Domestic sales fell 1.0%, though some regions posted gains. Food sales rose 1.0%, with sweets and regional fairs performing well. Apparel and household goods declined, partly due to unseasonal weather. Cosmetics rose 3.8%, boosted by pre-price-revision demand. Overall, lower average spend per customer and ongoing caution weighed on sales performance. Elsewhere, Japan’s top business lobby, Keidanren, reported average pay rises of 5.38%, after a 5.58% pay rise in 2024. Nikkei +0.472% to 37160.47, USDJPY -0.445% to 143.37, 10y JGB -3.7bp to 1.536%.
Hungary recorded 4.666 million employed persons and an unemployment rate of 4.4% in April. Over the February-April period, average employment stood at 4.673 million, which was 32,000 fewer than a year earlier, while the unemployment total was 217,000. Employment fell for both men (2.482 million) and women (2.191 million), with the employment rate at 75.0% overall, 78.9% for men and 71.1% for women. The domestic primary labor market employed 4.503 million, while 103,000 worked abroad and 67,000 were public workers. The average job search duration was 13.1 months, with 44.1% unemployed for under three months and 35.0% for over a year. Registered job seekers at end-April totaled 228,000, down 1.0% y/y. Budapest SI +1.02% to 96431.98, EURHUF +0.05% to 403.4, 10y HGB -1bp to 6.99%.
Singapore’s consumer price index (CPI) rose 0.9% y/y in April 2025, with food inflation up 1.4% and transport costs increasing by 1.8%. MAS core inflation, which excludes accommodation and private transport, climbed 0.7%. Month-on-month, overall prices dipped 0.3%, reflecting a 2.6% fall in accommodation costs. Food inflation was broad-based, led by fruits and nuts (+7.8%) and non-alcoholic beverages (+3.9%). Health insurance costs surged 13.3% y/y, pushing overall health inflation to 2.5%. Clothing and footwear prices dropped 3.4%, continuing a downward trend. Despite the monthly dip, cumulative inflation for January-April reached 1.0%, with most pressure coming from food, health and transport. Services such as recreation and education posted modest increases, while household durables and communication prices remained subdued or declined. Overall, inflation remains relatively contained but continues to be driven by specific sectors, particularly food and healthcare. STI -0.284% to 3869.06, USDSGD -0.38% to 1.2877, 10y SGB +2bp to 2.536%.