Market Movers: No Surprises
Market Movers highlights key activities and developments before the U.S. market opens each morning.
Market Movers highlights key activities and developments before the U.S. market opens each morning.

Bob Savage
Time to Read: 11 minutes
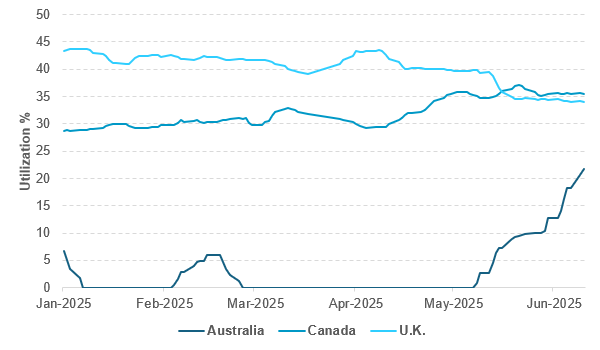
EXHIBIT #1: IFLOW UTILIZATION OF AUSTRALIAN AND CANADIAN GOVERNMENT BONDS
Source: BNY
Productivity challenges have been a major issue throughout the U.K. and Commonwealth countries, with Canada struggling with weak growth and high inflation over the past decade. With demographics no longer politically viable as a key growth driver, public investment to drive productivity growth remains the only feasible solution, effectively mirroring the U.K.’s growth structure. The primary risk stems from potential shocks in Canada-U.S. trade relations, though severe tariffs would likely trigger rapid disinflation due to the U.S.'s outsized influence on Canada’s growth and external position. Consequently, sovereign bonds have performed relatively well for cross-border investors despite the Bank of Canada’s inflation caution, with CAD weakness enhancing valuation attraction and confirming minimal inflation pass-through concerns. Notably, the BoE and ECB initially adopted similar positions on tariffs but have since retreated, likely due to expectations of less severe final tariffs or increased resilience during the suspension phase. Potentially severe supply shocks with stagflationary effects would be most acute in the U.S. In contrast, Australia’s productivity struggles have been explicitly identified by the Reserve Bank of Australia as limiting its easing capacity: wage growth remains robust relative to fundamentals, despite non-tradables driving headline inflation losses. This has resulted in consistently poor external flows into Australian government debt, with no month of net inflows in nearly a year. Short utilization in sovereign markets – a measure of stagflation expectations – shows Australia experiencing material increases. Although absolute levels remain lower than in Canada and the U.K., the larger gains and concerning trajectory should worry the recently re-elected Labour government as markets price in further productivity deterioration.
Risk sentiment has turned negative, with the focus on the impasse in U.S./Iran talks. Yesterday’s 4% rise in oil % has been reversed by 1% today, but USD’s weakness stands out, with the index at 98.25 while gold remains bid. The dollar moves are linked to renewed tariff talk from Trump as the July 9 deadline nears. EUR’s breakout, up 0.5%, is grabbing headlines, while JPY gained 0.5% even though a trade deal remains far off. KRW put on over 1.1% on a more hawkish sounding BoK, which issued a warning on property markets. TWD gained 0.9% on renewed FX hedging by life insurers of their long U.S. bonds. Another factor hitting USD overnight was the push by Texas Senator Cruz to end the Fed paying interest on reserves – something that would save the central bank money and likely bring about a reduction in foreign bank holdings. In the EMEA session, U.S. gains continued despite disappointing U.K. GDP for April and the ECB warning on tariff uncertainty. The fear of the day is a stagflationary mix of higher tariffs, higher energy prices and lower growth. However, this will be met with more data today that likely won’t fully justify pullbacks, as PPI is expected to hold flat at 3.1%, putting core PCE near 2.7% y/y, while jobless claims are forecast to remain below the 250,000 ceiling, leaving unemployment at 4.2%. Markets may be in risk-off mode, but they aren’t displaying much volatility, marking today as just another pre-summer rollercoaster event. This should be the key for trading: the lack of respect for a larger washout in positions rests on headline surprises, which have become used to the current cadence from the U.S. president and the reactions from the rest of the world.
President Donald Trump said he intends to set unilateral tariff rates in next one to two weeks and would be open to extending the deadline for nations to cut deals with his administration before higher levies take effect. Trump commented that U.S. is getting a total of 55% tariffs (20% tariffs on fentanyl, a 10% “reciprocal” tariff and then an average of 25% for tariffs that were already in place before this year), against a 10% import tariff for China. S&P Mini -0.381% to 6006, DXY -0.43% to 98.207, 10y UST -1.8bp to 4.403%.
In a speech today, the ECB’s Isabel Schnabel highlighted how rising global fragmentation and tariff conflicts are driving economic uncertainty, though euro area growth remains stable, inflation is projected to return to target and monetary policy is “in a good place”. With inflation moderating, the ECB’s tightening cycle is nearing its end, easing financing conditions. Growth is supported by private consumption and fiscal spending on defense and infrastructure, which is helping to counteract tariff shocks. Schnabel noted that inflation remains sensitive to energy and FX developments, while labor markets are resilient and wage pressures are easing. She warned of fragile inflation expectations, declining export competitiveness and structural labor shortages due to aging. Emphasizing the need for innovation-led growth and deeper EU integration, she advocated for a digital euro to preserve monetary sovereignty, as foreign firms are increasingly dominating euro area payments. Euro Stoxx 50 -0.799% to 5350.05, EURUSD +0.584% to 1.1554, BBG AGG Euro Government High Grade EUR -1.6bp to 2.781%.
Chinese Vice-Premier and lead negotiator He Lifeng, speaking at the inaugural China-U.S. economic and trade consultation mechanism meeting in London (June 9-10), emphasized that the talks were guided by the June 5 consensus between the two nations’ leaders. He reiterated China’s clear and consistent stance: the U.S.-China economic relationship is mutually beneficial, and a trade war benefits no one, declaring China doesn’t want a fight but isn’t afraid of one.” He called for dispute resolution through equal dialogue and principled cooperation. Looking ahead, He urged both sides to build on recent agreements with sincerity and action, reduce misunderstandings and maintain communication to stabilize bilateral economic ties and contribute to global certainty and stability. CSI 300 -0.062% to 3892.2, USDCNY -0.17% to 7.1781, 10y CGB +1.6bp to 1.702%.
U.K. monthly GDP is estimated to have fallen by 0.3% in April 2025, following growth of 0.2% in March 2025. Real GDP is estimated to have grown by 0.7% in the three months to April 2025, compared with the three months to January 2025, largely driven by growth in the service sector in this period. Monthly services output fell by 0.4% in April 2025, following growth of 0.4% in March 2025, and was the largest contributor to the m/m fall in GDP; however, it grew by 0.6% in the three months to April 2025. Production output fell by 0.6% in April 2025, following a fall of 0.7% in March 2025, but grew by 1.1% in the three months to April 2025. Construction output grew by 0.9% in April 2025, following growth of 0.5% in March 2025, and was up 0.5% in the three months to April 2025. FTSE 100 -0.026% to 8862.08, GBPUSD +0.519% to 1.3566, 10y gilt -3.4bp to 4.518%.
U.S. May PPI – consensus up 0.2% m/m, 2.6% y/y from -0.5% m/m, 2.4% y/y in April – this matters for core PCE but after yesterday’s CPI will struggle to move markets.
U.S. weekly initial jobless claims expected to stay elevated at 240k (247k last week), with continuing claims expected to be little-changed at 1.910 million from 1.904 million.
U.S. Treasury 30y $22bn bond auction – this is key for duration focus but after yesterday’s CPI and strong U.S. 10y note sale few expect much trouble.
Mood: Investors’ risk-on mood continues, with strong demand for equities and easing appetite for core sovereign bonds. Aggregate net buying of core sovereign bonds is back at the levels seen in late March prior to “Liberation Day”.
FX: Notable flows are strong JPY inflows vs. PLN outflows. USD, EUR and GBP posted light outflows, against inflows in the rest. LatAm currencies were broadly sold, while flows in APAC currencies were mixed and light.
FI: U.S. Treasurys and Eurozone, Chinese and New Zealand government bonds posted good buying, against selling in Canadian, South African and South Korean government bonds.
Equities: EMEA region equities were sold, against buying flows in APAC equities. Flows in the Americas were mixed. South Korea, Peru and Taiwan equities posted the most buying, while South Africa stood out with the only sizable outflows within iFlow universe.
“The best surprise is no surprise.” – Charles Kemmons Wilson
“Never tell people how to do things. Tell them what to do and they will surprise you with their ingenuity.” – George S. Patton
Italy’s labor market strengthened in Q1 2025, with hours worked rising 1.0% q/q and 1.1% y/y, outpacing GDP growth (+0.3% q/q, +0.7% y/y). Employment increased by 141,000 (+0.6%), led by permanent hires (+143,000) and self-employed numbers (+18,000), offsetting a drop in temporary contracts (-20,000). The unemployment rate held steady at 6.1%, while inactivity fell sharply (-157,000), lifting the employment rate to 62.7% (+0.4 percentage points). Year-on-year, jobs rose by 432,000 (+1.8%), driven by permanent contracts (+4.0%) despite ongoing declines in temporary (-6.7%) and self-employed (-0.4%) positions. Labor costs surged 1.5% q/q and 4.6% y/y, with wages and social contributions both climbing amid contract renewals and the expiry of contribution relief. FTSEMIB -0.766% to 39872.57, EURUSD +1.005% to 1.1553, 10y BTP -2.6bp to 3.42%.
Norway’s economic outlook remains firm into Q2 and Q3 2025, supported by rising exports, especially in aquaculture and defense-related manufacturing, despite global trade tensions. Contracts expect strong growth in manufacturing, retail and tourism, while construction remains the weakest sector but may stabilize in the autumn. Services growth is easing slightly amid uncertainty, though IT and military demand remain robust. Consumer durables sales are rebounding, and retail is the only sector planning increased 2025 investment. Labor market pressures have eased slightly: 35% of firms report full capacity use and 23% cite labor shortages. Employment is projected to rise, and wage growth is expected to come in at 4.5% in 2025 and 4.0% in 2026. Profitability has improved overall, and economic conditions are most favorable in Norway’s oil-producing western regions. OSE -0.214% to 1607.43, EURNOK +0.035% to 11.5689, 10y NGB -2bp to 4.059%.
Netherlands’ inflation fell to 3.3% in May 2025, down sharply from April, largely due to a 20.3% y/y drop in international flight prices, reversing the 20.8% increase seen the month before. Price falls for bungalow park stays also contributed, as May 2025 had fewer holiday days than May 2024, reducing seasonal tourism-driven price pressure. Month-on-month, consumer prices dropped by 0.5%, though this was influenced by seasonal volatility. On a harmonized basis (HICP), Dutch inflation slowed to 2.9% in May from 4.1% in April; the flash estimate had suggested 3.0%. Eurozone inflation also eased, falling from 2.2% in April to 1.9% in May, reflecting broader regional disinflation trends. AEX -0.416% to 931.61, EURUSD +0.584% to 1.1554, 10y NGB -2.9bp to 2.718%.
U.K. total goods and services trade deficit widened by £4.9bn to £11.5bn in the three months to April 2025 because of a larger rise in imports than exports. The trade in goods deficit widened by £4.4bn to £60.0bn in the three months to April 2025, while the trade in services surplus is estimated to have narrowed by £0.5bn to £48.5bn. FTSE 100 -0.026% to 8862.08, GBPUSD +0.519% to 1.3566, 10y gilt -3.4bp to 4.518%.
U.K. May RICS house price balance down -8% from -3%; however price expectations for the next 12 months remain in positive territory, with a net +34% of respondents expecting prices to rise. The housing market that remains subdued, though signs are emerging that the worst may be over for now. While buyer demand and sales activity remain in negative territory, sentiment around the near-term outlook is showing tentative signs of improvement. FTSE 100 -0.026% to 8862.08, GBPUSD +0.519% to 1.3566, 10y gilt -3.4bp to 4.518%.
Turkey’s industrial production rose 3.3% y/y in April 2025. Among the main sectors, there were rises of 1.3% for mining and quarrying, 0.3% for manufacturing and 8.8% for electricity, gas, steam and air conditioning supply compared with April 2024. On a monthly basis, however, total industrial production fell 3.1% from March. Mining and quarrying declined by 2.5% and manufacturing by 3.4%, while energy output edged up 0.2%. The data suggest annual growth remains positive, but momentum weakened sharply m/m in April. BI 100 -1.04% to 9585.38, USDTRY +0.366% to 39.3133, 10y TGB +23bp to 33.22%.
South Africa’s mining production fell 7.7% y/y in April 2025, led by sharp declines in PGMs (-24.1%), gold (-2.5%) and coal (-1.7%). Iron ore was the only major positive contributor, rising 5.3%. On a monthly basis, seasonally adjusted mining output rose 0.6%, following a 3.6% gain in March and a 3.9% drop in February. Over the three months to April, production declined by 2.7%, with PGMs down 13.2% and iron ore up 10.3%. Mineral sales rose 0.7% y/y in April, driven by strong growth in gold (+57.6%) and manganese ore (+66.6%), while PGMs (-20.1%) and iron ore (-25.9%) weighed on the total. Seasonally adjusted mineral sales rose 6.7% m/m but fell 8.5% over three months. JSE TOP40 +0.186% to 88759.48, USDZAR +0.792% to 17.8705, 10y SAGB +4.7bp to 10.161%.
Australia’s June consumer trimmed mean inflation expectation surged to 5%, the highest since July 2023. The higher inflation expectation means a risk of higher headline inflation ahead, dampening expectations of aggressive near-term RBA easing. ASX -0.102% to 4810.51, AUDUSD -0.092% to 0.6504, 10y ACGB -4.5bp to 4.238%.
The Australian Council of Financial Regulators commented that although riskier asset prices had largely recovered from their sharp declines following the initial U.S. tariff announcements in early April, financial markets remain vulnerable to further shocks in the current international policy environment. In the housing market, the council observed that while lender and borrower resilience is currently high, this strength could be eroded over time if lending standards deteriorate and households respond to an actual or anticipated easing in financial conditions by accumulating excessive debt.
New Zealand May total card spending rose 0.3% m/m, the first m/m increase of the year. The non-retail (excluding services) category increased by $34mn (1.5% m/m). This category includes medical and other health care, travel and tour arrangement, postal and courier delivery, and other non-retail industries. The services category was down $0.7mn (0.2% m/m). This category includes repairs and maintenance, and personal care, funeral and other personal services. NZX 50 +0.342% to 12649.1, NZDUSD +0.1% to 0.6038, 10y NZGB -5bp to 4.57%.
Japan Q2 Business Outlook Survey (BSI) Large All Industry dropped to -1.9 q/q from +2, the first negative reading since Q1 2023. Large manufacturing industry fell to -4.8 from -2.4, while large non-manufacturing sector fell into negative territory, at -0.5 from 4.1. Overall, the fall in the BSI does not bode well for Japanese GDP. Elsewhere, May Tokyo average office vacancies dropped further, to 3.56% from 3.73%. Nikkei -0.646% to 38173.09, USDJPY +0.925% to 143.81, 10y JGB -1.5bp to 1.452%.
Japan weekly portfolio flow data as of June 6, 2025 showed investors net sold small foreign bonds at ¥-459bn. Japanese investors’ selling of foreign equities accelerated at ¥-1,489bn, the most sold since ¥1,602bn in the week ending November 4, 2022. Foreigner investors net bought a low ¥220bn of JGBs, after ¥1,165bn the week prior. Foreign investors posted ten straight weeks of buying in Japanese equities, but at a lesser pace of ¥180bn vs. ¥336bn the previous week, to bring the YTD tally to a positive ¥1,158bn.