Market Movers: Focused Pressure
Market Movers highlights key activities and developments before the U.S. market opens each morning.
Market Movers highlights key activities and developments before the U.S. market opens each morning.

Bob Savage
Time to Read: 8 minutes
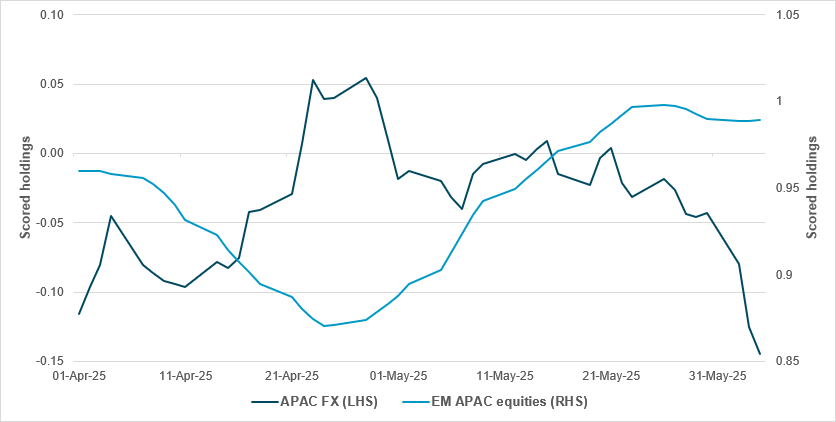
EXHIBIT #1: APAC FX UNDERHELD POSITION UNWINDING COULD MEAN EQUITY HOLDING LOSSES
Source: BNY
Yesterday’s call between Presidents Trump and Xi marks another step toward stabilizing the world’s most important bilateral trade relationship. While this is a positive for the global economy, the muted equity market reaction suggests some form of rapprochement was already priced in. As highlighted by this week’s iFlow Carry reaching positive statistical significance, markets may be nearing a crowded positioning in risk-on trades – whether in equities or FX. Much of the recovery flow over the past month has targeted APAC equities, raising the question of where the next wave of good news might come from. Deals with the U.S. may follow, but these may also be largely priced in, making the bar low for profit-taking. Among low-yielding markets, the most heavily bought equity markets were all in APAC. Any unwinding of these positions could significantly impact FX flows and aligns with our view that the carry trade may reverse. We believe recent net sales of many low-yielding APAC currencies were not to fund carry trades directly, but to hedge equity inflows, particularly into export-reliant APAC names. TWD’s and HKD’s experience last month highlights the challenge for central banks in managing these inflows. However, intervention ultimately occurred, and most asset holders were likely able to re-hedge comfortably once central bank resistance eased.
Risk sentiment is mixed as investors await more U.S. labor market data, a call between Trump and Musk, and the restart of China/U.S. trade talks. However, the economic data overnight didn’t help the mood, with Germany’s Bundesbank downgrading forecasts for 2025 to zero from 0.2% growth. German trade data confirm a hit to exports following the April tariffs, while French industrial output surprised to the downside. EUR lost ground but USD gained 0.2% overnight, still leaving the dollar down a significant -0.5% for the week. The focus on Tesla share selling calmed overnight on talk of a Trump/Musk call, as their public break-up led to talk of impeachment, contract terminations and more. The RBI cut surprised in its size, but the shift to neutral matches the storyline of the ECB with its cut yesterday. The rest of the world has eased into the tariff policy risks, whereas the U.S. has not. Inflation in the rest of the world has been better-contained, while the U.S. has been stuck. The main focus for investors in the day ahead is on U.S. labor markets, where the weaker ADP, ISM jobs, higher layoffs from Challenger and higher May average jobless claims have pushed the whisper number for non-farm payrolls to 110,000. Anything below 75,000 will spur more hopes of FOMC easing, but wages and the breakdown of jobs by sector will paint a fuller picture. We are also about to enter the blackout period, leaving markets to watch the press for special reports. The risk of weaker U.S. hard data continues, and the drop in nowcast growth for Q2 reflects this story over the week. Whether U.S. markets find more comfort in FOMC easing or worry about it acting too late reflects the monetary vs. fiscal conflict, which shows up most clearly in rates. For U.S. bonds, the supply next week with 10y and 30y issues will temper any moves. The ability for equities and bonds to trade in the same direction rests on the data along with the policy guidance, with more Trump tweets, trade talks and the now important CPI/PPI numbers to come next week.
RBI surprised the market with a 50bp rate cut in the repo rate to 5.5% and a 100bp reduction in the cash reserve ratio to 3.0%, set to release a liquidity boost of INR 2.5tn. However, the overall RBI tone was not dovish. The RBI changed its monetary policy stance to neutral from accommodative. It also commented that monetary policy is left with very limited space to support growth and it will be carefully assessing the incoming data to chart out the future course of monetary policy action. It revised down its inflation trajectory for Q1 and Q2 2025/26 to 2.9 and 3.4% y/y, respectively, vs. previous projections of 3.6% and 3.9% y/y in April 2025. Overall 2025/26 inflation is forecast to come in at 3.7% y/y vs. 4.0% y/y previously. The GDP growth projection is unchanged at 6.5% y/y (Q1: 6.5, Q2: 6.7%, Q3: 6.6% and Q4: 6.3%). SENSEX +0.88% to 82158.65, USDINR -0.082% to 85.7262, 10y INGB +3.4bp to 6.28%.
Germany’s exports fell by 1.7% m/m in April 2025 to €131.1 billion, while imports rose 3.9% to €116.5bn, leading to a trade surplus of €14.6bn. Compared with April 2024, exports decreased by 2.1% and imports increased by 3.8%. Exports to non-EU countries dropped 4.8%, especially to Russia (-5.3%). In contrast, exports to the EU grew slightly. Import growth was broad-based, with notable increases from EU and non-EU countries alike. The slowdown in exports reflects weaker external demand, while import growth signals some resilience in domestic consumption and supply replenishment. DAX -0.19% to 24277.45, EURUSD -0.254% to 1.1416, 10y Bund -4.2bp to 2.54%.
Germany’s industrial production fell by 1.4% m/m in April 2025, following a revised 2.3% rise in March. Year-on-year, output was down 1.8%. The downturn was broad-based: pharmaceutical output plummeted 17.7% and machinery fell 2.4%, while energy-intensive industries declined by 2.1%. Investment and intermediate goods production fell by 2.3% and 1.9%, respectively. In contrast, construction output rose 1.4% and food industry production climbed 5.7%. Compared with February, overall production in the past three months rose slightly (+0.5%), despite April’s drop.
Euro area GDP grew by 0.6% q/q in Q1 2025, accelerating from 0.3% in Q4 2024, while employment rose 0.2% over the same period. Year-on-year, GDP increased by 1.5% and employment by 0.7%. Within member states, Ireland recorded the strongest quarterly GDP growth (+9.7%), followed by Malta and Cyprus. Major contributors to growth included household consumption (+0.2 percentage points), gross fixed capital formation (+0.4 percentage points) and net exports (+0.3 percentage points), while inventories detracted slightly. Employment levels remained stable across most of the EU, though hours worked shrank by 0.3% q/q. Labor productivity rose 0.8% y/y in the euro area, driven by gains in both output and employment. Euro Stoxx 50 -0.11% to 5404.59, EURUSD -0.254% to 1.1416, BBG AGG Euro Government High Grade EUR -1.6bp to 2.781%.
U.S. May non-farm payrolls estimated at 126k from 177k – with the whisper number flipping from 150k two weeks ago to 110k. The U.S. unemployment rate is expected unchanged to be at 4.2%, with participation unchanged at 62.6%. Average hourly earnings expected to rise 0.3%, from 0.2%.
U.S. April consumer credit expected to come in at $10bn, from $10.172bn.
Fedspeakers: Governor Bowman, newly confirmed as Vice Chair for Supervision, gives a speech on regulation with Q&A.
Canada May unemployment expected up 0.1% to 7.0%, with -15k jobs.
Mood: iFlow Mood drifted further into risk-on territory, driven by easing demand for sovereign bonds. Equity buying momentum continues.
FX: Notable flows were South Korean won inflows, against outflows for THB, TWD, MXN and AUD. Mixed and light flows in the rest of the iFlow Universe. CAD is overheld, with a new high in scored holdings, while JPY holdings eased further.
FI: The trend of U.S. Treasury buying vs. selling of Eurozone government bonds continued. Elsewhere, Brazilian and Mexican sovereign bonds posted a pickup in demand. In APAC, Chinese and Singapore government bonds were bought, against ongoing outflows in India.
EQ: U.S., Czech and Colombian equities were most sold against buying flows in Poland, Hungary, New Zealand, Japan, South Korea and Hong Kong. Within U.S. equities, the utilities sector posted the most buying, against selling in the consumer discretionary, consumer staple and health care sectors.
“Having nerves and feeling the pressure just gets you focused and gets your concentration level where it needs to be. I harness that nervous energy into a positive.” – Tom Lehman
Euro area retail trade volumes rose by 0.1% m/m in April 2025, while EU-wide volumes increased by 0.7%. Compared with April 2024, retail sales rose by 2.3% in the euro area and 2.8% in the EU. Food, drink and tobacco sales led growth across both regions, up 0.5% and 0.9% m/m, respectively, while non-food product sales were mixed. Automotive fuel sales rose strongly, up 1.3% in the euro area and 1.7% in the EU. Among member states, Poland (+7.5%), Slovakia and Sweden (both +2.4%) posted the largest monthly gains, while Germany (-1.1%) and Malta (-1.0%) saw notable declines. Euro Stoxx 50 -0.11% to 5404.59, EURUSD -0.254% to 1.1416, BBG AGG Euro Government High Grade EUR -1.6bp to 2.781%.
Hungary’s industrial production fell 5.0% y/y in April 2025 based on working-day adjusted data, with output over the first four months of the year down 4.5% compared to the same period in 2024. However, seasonally and working-day adjusted figures showed a 1.5% m/m increase from March 2025. Most manufacturing subsectors recorded annual declines, including transport equipment, electrical equipment, and food, beverages and tobacco. The only major area to show growth was computer, electronic and optical products. Despite the monthly gain, the overall trend remains subdued, reflecting persistent weakness in Hungary’s industrial base. The data suggest that while short-term output may be stabilizing, broader year-on-year comparisons still point to a contracting industrial sector. Budapest SI -0.095% to 96467.42, EURHUF +0.07% to 403.31, 10y HGB +1bp to 7.03%.
Czechia’s trade surplus in goods reached CZK 23.2 billion in April 2025, down CZK 6.9 billion y/y. The fall was mainly due to a wider trade deficit in crude petroleum and natural gas (CZK -5.7bn), a shift from surplus to deficit in electrical equipment (CZK -5.3bn) and a lower surplus in fabricated metal products (CZK -3.3bn). Positive contributions came from refined petroleum products (deficit narrowed by CZK 3.1bn), motor vehicles (surplus rose by CZK 2.9bn) and computer, electronic and optical products (gap narrowed by CZK 2.9bn). Exports fell 1.1% y/y, while imports rose 0.6%. The trade surplus from January to April totaled CZK 106.2bn, down CZK 6.9bn y/y. Prague SE -0.089% to 2154.91, EURCZK -0.218% to 24.749, 10y CZGB +0.9bp to 4.234%.
U.K. house prices fell by 0.4% in May 2025, following a 0.3% increase in April, bringing the average price to £296,648. Annual growth slowed to 2.5% from 3.2% in April, while quarterly prices declined by 0.3%. Northern Ireland led regional growth with an 8.6% rise, followed by Wales and Scotland at 4.8%. Among English regions, the North West and Yorkshire & Humber both posted 3.7% gains, while London recorded just 1.2% growth, though it remains the most expensive region at £542,017. Housing activity weakened: mortgage approvals fell 4.9% m/m, property transactions plunged 63.5% from March, and RICS survey data pointed to falling buyer demand and sales. FTSE 100 +0.019% to 8812.68, GBPUSD -0.236% to 1.3538, 10y gilt -2.1bp to 4.595%.
Japan’s coincident index (CI) for April 2025 showed a mixed outlook. The leading index dropped sharply by 4.2 points to 103.4, its third consecutive monthly decline, suggesting a weakening in future economic momentum. The coincident index (CI), which reflects current economic conditions, edged down by 0.3 points to 115.5, marking its second straight monthly fall. This decline was driven by weaker shipments of capital goods (excluding transport equipment) and lower export volumes, partially offset by gains in consumer durables and industrial shipments. Meanwhile, the lagging index rose by 1.3 points to 112.5, continuing a positive trend. The Cabinet Office maintained its assessment that the economy is “showing signs of bottoming out.” Nikkei +0.498% to 37741.61, USDJPY +0.405% to 144.11, 10y JGB -1.2bp to 1.455%.
Japan April real household spending unexpectedly declined to -0.1% y/y from 2.1% y/y. The overall spending trend is shifting higher from the lows in 2023 and 2024. Looking into the details, real household income turned flat or non-negative for the first time this year, while real disposable income rose to 0.9% from -2.5% y/y in March. There was a notable pickup in spending on housing (10.9% y/y), but a sharp drop in fuel spending (-1.2% y/y).