Global Currency Volatility Surges on Asset Repricing
FX: G10 & EM, published every Thursday, provides a detailed analysis of global foreign exchange movements in major and emerging economies around the world together with macro insights.
FX: G10 & EM, published every Thursday, provides a detailed analysis of global foreign exchange movements in major and emerging economies around the world together with macro insights.

Wee Khoon Chong
Time to Read: 5 minutes
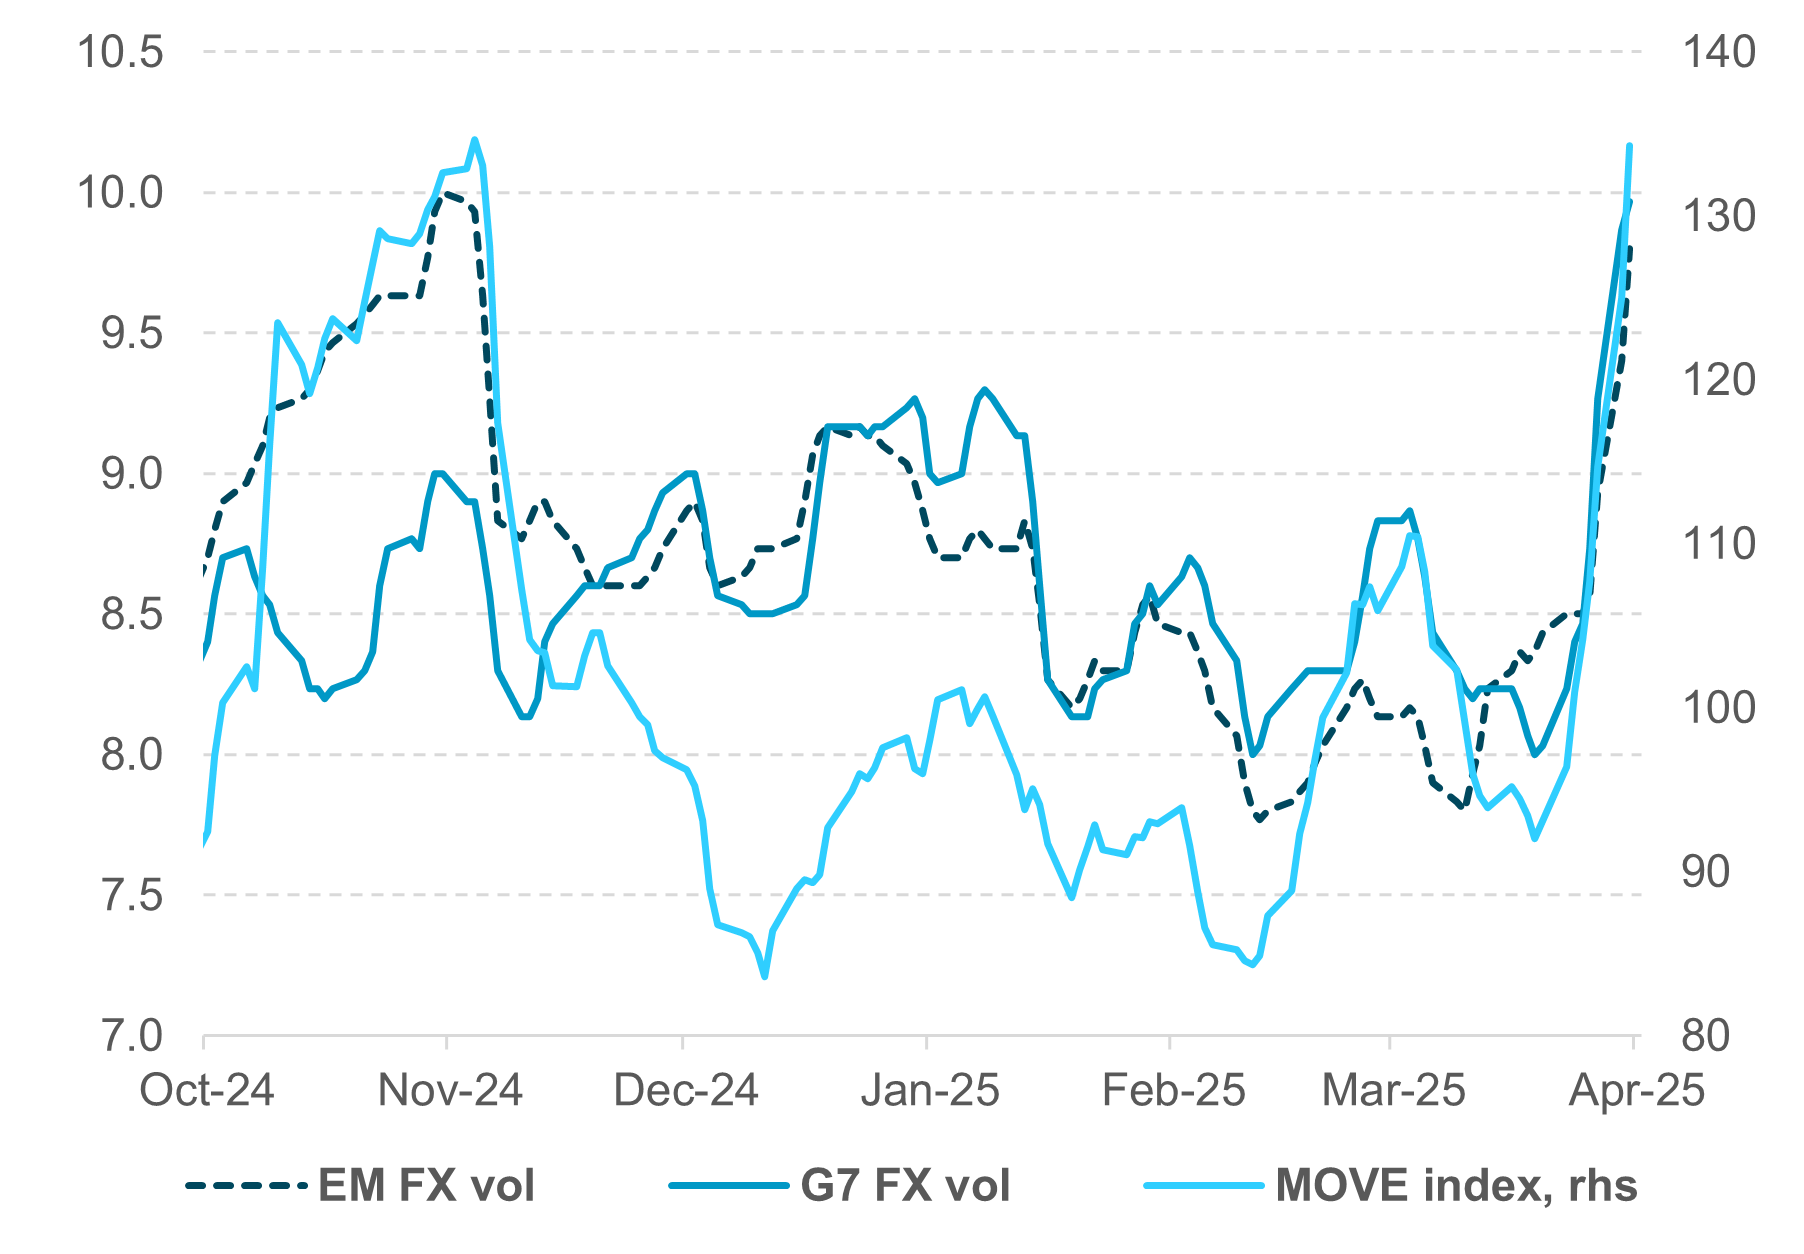
EXHIBIT #1: RISING VOLATILITY ACROSS THE G10 AND EM COMPLEX
Source: Source: BNY Markets, Bloomberg
Our take
Tariff uncertainty and heightened volatility have led to a surge of risk aversion. The sharp asset repricing has triggered some capitulation and the liquidation of trading patterns, with significant intraday volatility across asset classes in foreign exchange, equities and fixed income. This market stress can be observed in a widening of the cross-currency basis, a widening of credit spreads, including on higher-rated investment-grade corporate bonds, and greater equity and currency volatility. The volatility this week has been indiscriminate, with no currency or region spared. As shown in Exhibit #1, both emerging market and G7 currency volatilities have been moving in tandem compared with the more common differentiation of market volatility in a particular region. For example, emerging market FX was more volatile in Q4 2024, before being overtaken by the G7 region in the first quarter of this year. This situation was exacerbated by the response of the U.S. bond market. In contrast to the flight to quality bid on bonds, the U.S. Treasury curve bear steepened significantly, with 2-10y curve at 70bp, nearly 30bp steeper on the month, and 30y U.S. Treasurys hitting a high of 5% before settling around 40bp higher on the month.
This led to a surge in bond volatility, with the MOVE index, which measures U.S. bond market volatility, soaring past its November 2024 highs. Indeed, the MOVE index is at its highest level since September 2023, when the U.S. Federal Reserve telegraphed that it might keep rates higher for longer.
Forward look
At the time of writing, there is no sign of global trade tensions easing, with the U.S. imposing a record 125% import tariff on China, and China retaliating with tariffs as high as 84% on U.S. products. In response to U.S. tariffs, the European Union has approved retaliatory tariffs on around €21bn of U.S. goods, and Canada is reported to be imposing a 25% tariff on certain vehicle imports from the U.S. In other words, tariff uncertainty is here to stay, not to mention the risks of a further tightening of trade restriction in critical sectors.
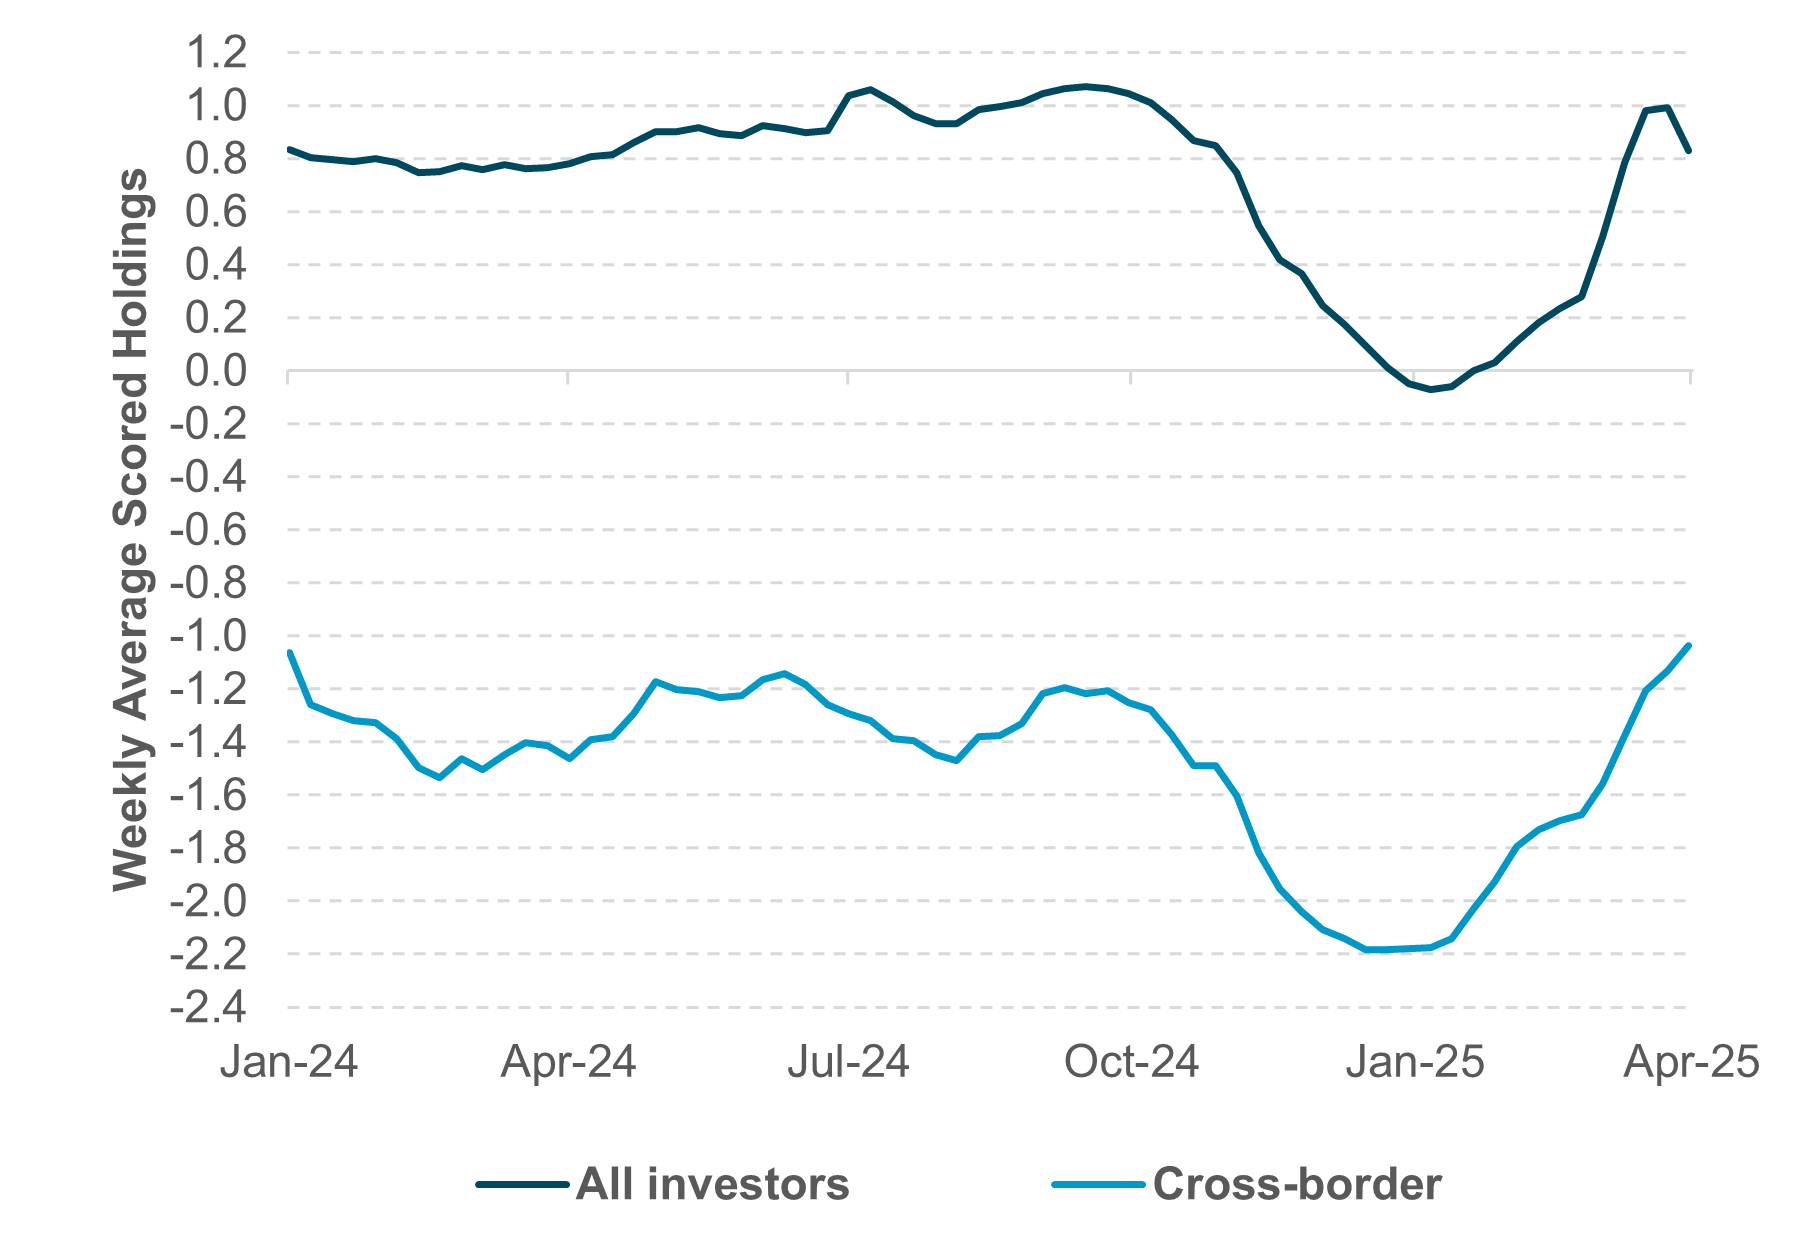
EXHIBIT #2: EURO SCORED HOLDINGS
Source: BNY Markets, iFlow
Our take
The ECB policy meeting next week will be crucial for determining the direction of travel for the euro in the near term. ECB members seem to be shifting toward further rate cuts despite the less dovish tone at the March meeting, saying the trade war will have a “non-negligible” direct impact on the economy and warning about the disinflation threat from the euro’s strength. Euro appreciation this year has been spectacular, from testing 1.01 in early February to moving above 1.10 in April, a gain of nearly 6% year to date. Looking at the pricing dynamic of the euro in recent days, we have noticed an unusual dislocation, with EUR/USD going higher and a narrowing of the bond spread. The 2-year Eurozone and U.S. Treasury yield spread narrowed this week, driven by a lower Eurozone yield and a higher U.S. Treasury yield. This dislocation might continue for technical reasons but is typically not sustainable.
Forward look
Looking at iFlow, aggregate euro flows have been strong. iFlow data, especially from cross-border transactions, showed persistent short covering in Q1 2025, at almost as fast a pace as the liquidation that occurred in Q4 2024. As shown in Exhibit #2, euro scored holdings from cross-border investors, at around -1, are narrower than at the beginning of 2024. Looking at the euro as a whole, the currency’s high valuation might have resulted in some selling pressure. Indeed, iFlow showed weekly euro outflows for the first time this week after 11 straight weeks of inflows since mid-January 2025. Trading will continue to be volatile up ahead given the downside growth risk in the Eurozone, the direction of monetary policy and continued cross-border investor demand for the euro as a diversification play.
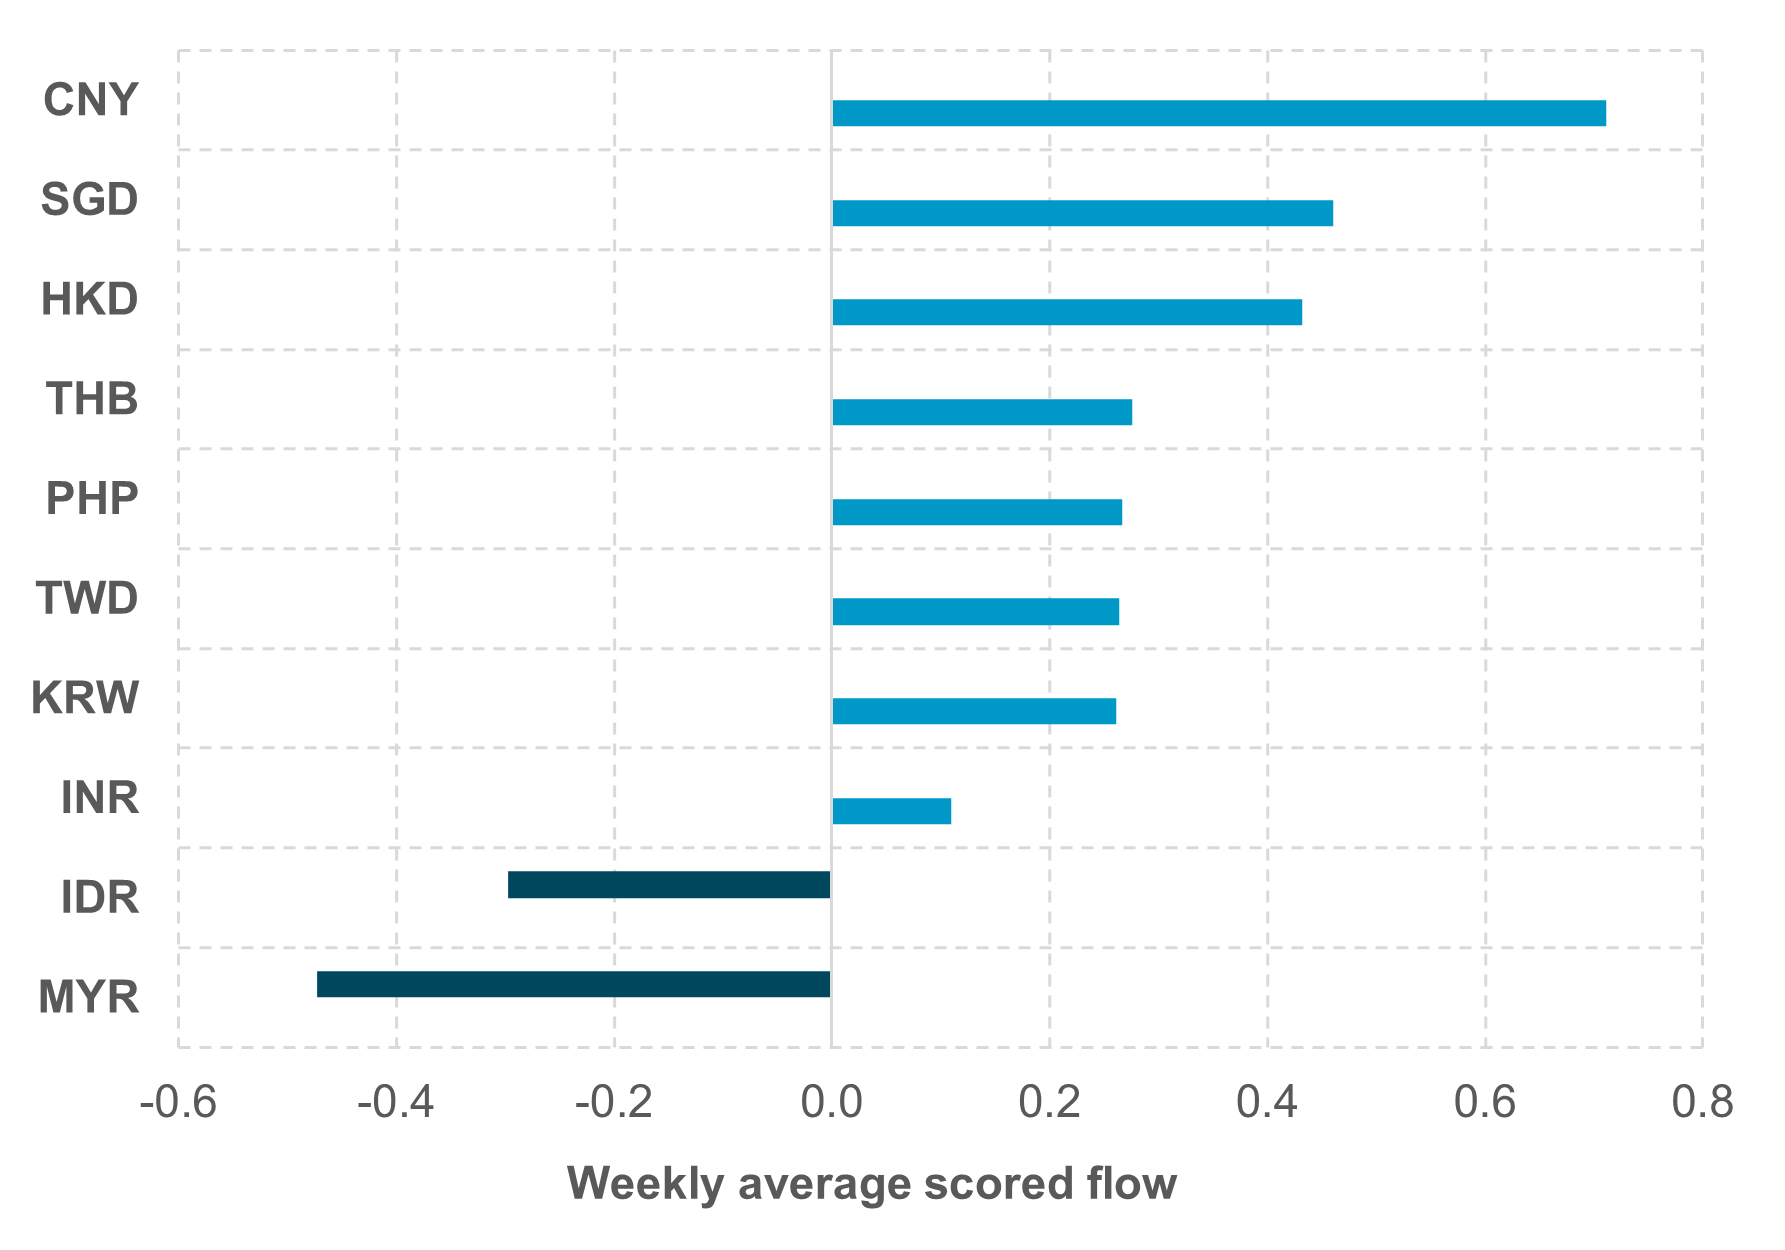
EXHIBIT #3: APAC WEEKLY AVERAGE SCORED FLOW
Source: BNY Markets, iFlow
Our take
The reciprocal tariffs imposed by the U.S. hit Asia hard, especially China, which was slapped with a minimum tariff of 125%. Most APAC countries face high reciprocal tariffs, with the exception of Singapore, which is subject to the minimum tariff of 10%. Other APAC countries saw high tariff rates, too, including Vietnam at 46%, followed by Thailand (36%), Taiwan and Indonesia (32%), India (26%), South Korea (25%), Malaysia (24%) and the Philippines (17%). Though there might be some consolation in the 90-day period for lower 10% reciprocal tariffs on non-retaliating countries, tariffs will likely pose significant downside growth risks to the region. The Reserve Bank of New Zealand has said that the tariffs imposed by the U.S. and any retaliatory levies by other nations will adversely impact domestic economic activity.
APAC equities have experienced severe market volatility in recent days, including a 13% selloff on the Hang Seng Index, the bourse’s largest one-day selloff since October 1997. And Taiwan equities recorded a decline of 10% on Monday, the biggest one-day drop on record. Foreign investor sentiment about equities has been bearish and shows no signs of improving. This was especially true in South Korea, where foreign investors have sold over $6bn in equities so far in April, more than the previous high of $5.7bn net sold in September 2024. Similar selling pressure can be seen across the APAC region, including in India and Taiwan.
APAC foreign exchange price action has been volatile as markets must navigate between risk-off and a capital outflow-triggered selloff against the softer U.S. dollar-induced rallies in foreign exchange. Capital outflows and uncertainty have won the argument. This and the loosening of the PBoC’s grip on the Chinese yuan have exacerbated the downside risk for Asian currencies. China’s official daily CNY fixings breached 7.20 this week, the first time since September 2023 and USDCNH reached historic highs this week, with an intraday high of 7.4290.
Forward look
In the context of the acute market uncertainty, capital outflows and negative market technical features, the selloff in APAC currencies over the past week has been relatively contained. Indeed, looking at iFlow, the weekly average scored flows for APAC currencies has been broadly positive, led by CNY, HKD, KRW and SGD, with outflows in MYR and IDR (see Exhibit #3). The observed inflows cannot be entirely explained by the unwinding of hedges, as overall investor flows in the government bond complex have been positive. One primary stabilizing force in the region, in our view, is the stepped-up smoothing activities by regional central banks, notably Bank Indonesia, which intervened in onshore IDR and offshore NDF. A similarly firm intervention stance can be seen in Taiwan, where USDTWD is kept firmly at a critical level of 33.0. While the pressure continues for APAC currencies, we do not expect depreciation momentum to be unhinged. We will continue to monitor asset flows as a swing factor for Asian currencies.