Top vs. Bottom Lines
Equities provides an in-depth look each Friday at the factors shaping equities markets in developed and emerging economies around the world.
Equities provides an in-depth look each Friday at the factors shaping equities markets in developed and emerging economies around the world.

Bob Savage
Time to Read: 5 minutes
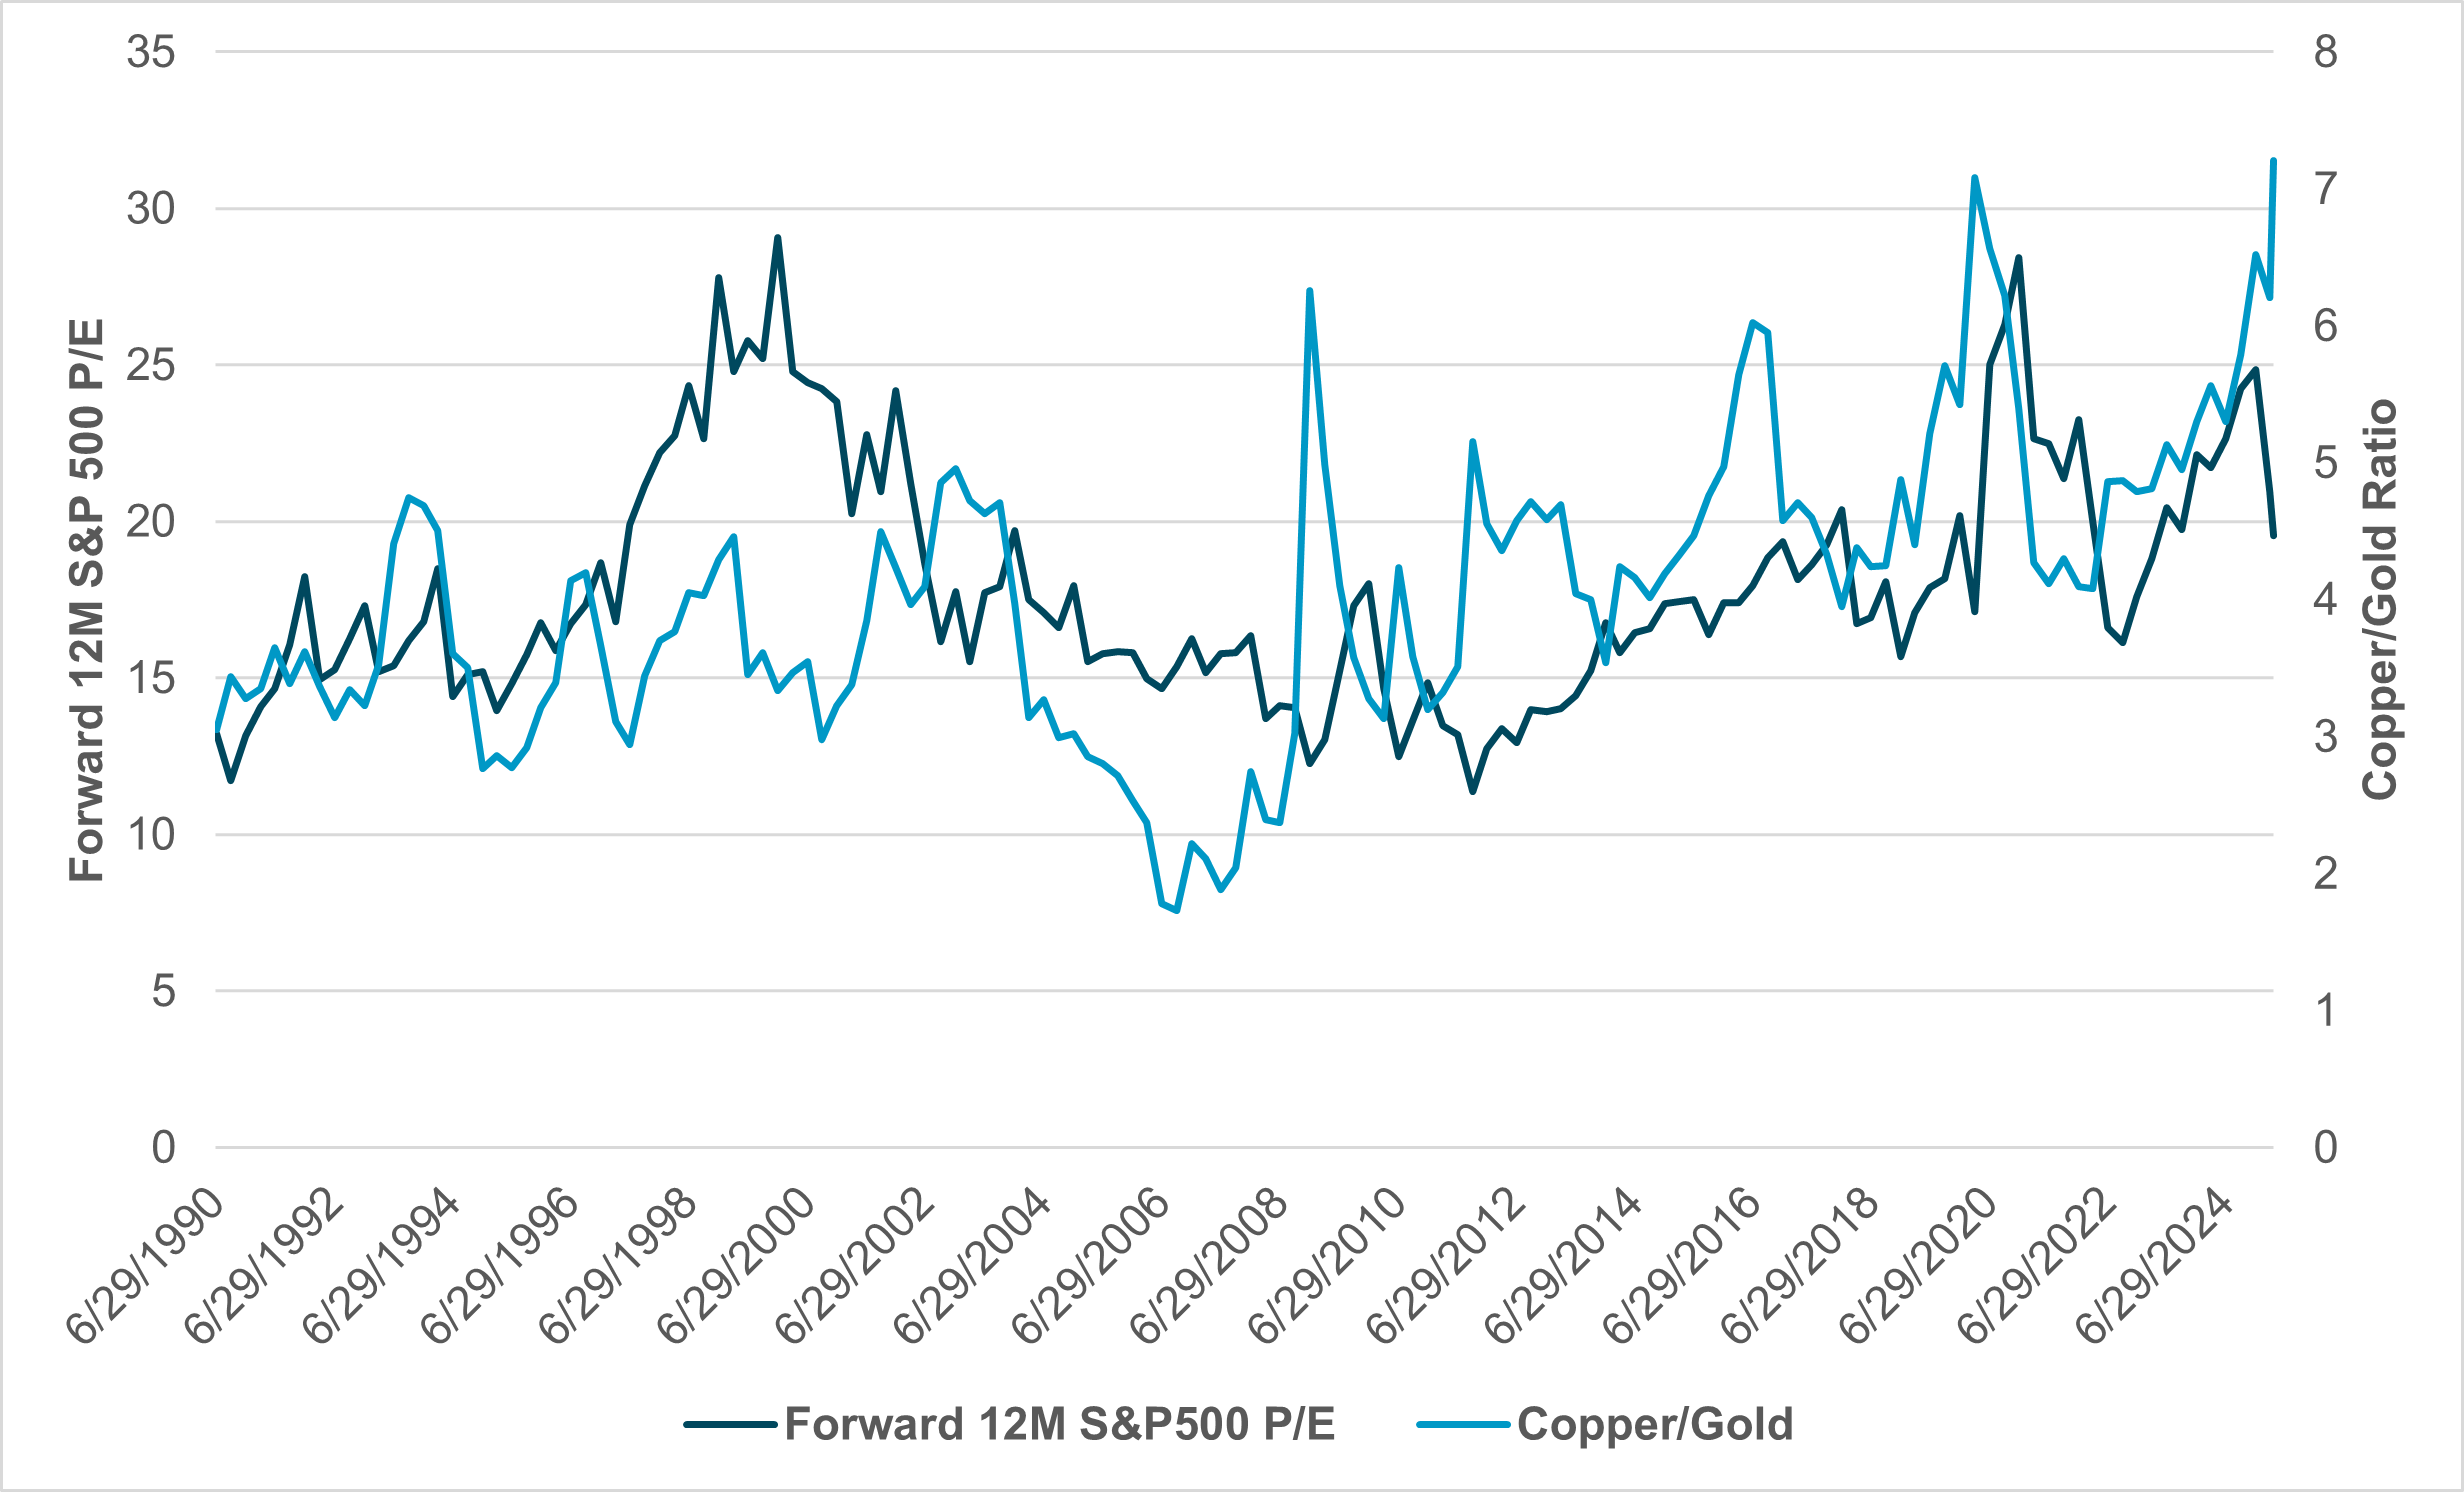
EXHIBIT #1: COPPER/GOLD AND FORWARD 12M P/E OF S&P 500
Source: Bloomberg, BNY
Gold is at record highs and copper is not. According to an old Wall Street adage copper has a PhD in economics because it is accurate at predicting global economic turning points. Gold, on the other hand, is seen as a hedging tool for policy mistakes. The current rally up in gold represents doubts about global fiat currencies and the growth outlook, which have been driving expectations of more fiscal and monetary policy support. Analysts also argue this reflects the cracks in USD reserve currency status. Gold flows from APAC show significant buying interest since April 2, while the price of copper has been erratic. After reaching a new high of $5.2160 per pound on March 26 on the back of supply worries and U.S. tariffs, it experienced a reversal on “U.S. Liberation Day,” with equity weakness driving down U.S. and global growth outlooks. The relationship between gold and inflation and corporate earnings expectations has been notable outside of a recession. The current erratic pattern of copper prices and their confusing relationship to global growth stands out in view of USD weakness. Nor is it clear what the gold/copper ratio means for corporate profits and longer-term values.
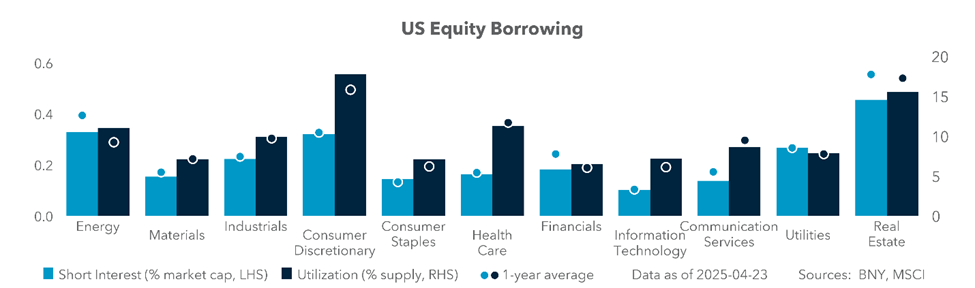
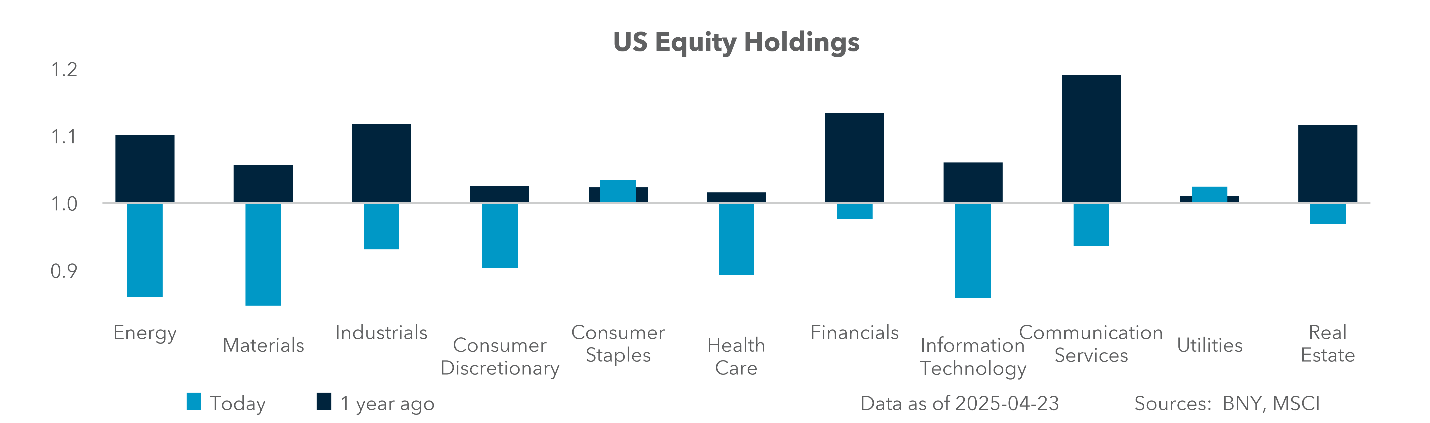
EXHIBIT #2: EQUITY BORROWING AND U.S. EQUITY HOLDINGS
Source: BNY iFlow
Our Take
Q1 earnings growth is still almost 7% y/y, although this is below the 5-year and 10-year running averages of 11.3% and 8.9%, respectively. The good news – if 7% holds as the average over the next three weeks – is that this will mark the seventh consecutive quarter of growth. This also contrasts significantly with the holdings of U.S. equities in iFlow. The best sector in the U.S. in terms of earnings is Health Care, with estimated earnings of 34.5%, according to FactSet, with Pharmaceuticals leading and Life Science Tools and Services lagging. The second-best earnings sector is expected to be IT at 14% y/y, with Semiconductors again leading the pack at +32%, while IT Services are expected to be negative at -10%. The sector most expected to underperform is Energy at -14.5% y/y, with oil price declines the biggest factor and Refining leading the drop at -109% y/y. Only Exploration and Storage are seen with gains, at 12%. When we look at the short positions from our securities lending data and compare that to earnings it’s clear that Energy Consumer Discretionary, Real Estate and Utilities are all seen as at risk by fast, leveraged investors. This is at odds with the expectations of the analyst community, while Energy is matching expectations.
Forward Look
Investors are waiting to buy a dip. Rising cash positions and significantly underheld positions are set up for a rally back in equities in the U.S. Notably, both domestic and cross-border holdings in the U.S. are below the longer-term average by 5-7%. The problem for defining the dip is that Q1 earnings and volatility are blocking value models. The role of gold as a USD alternative matters in the mix as investors see a risk of stagflation or recession ahead. The role of the FOMC in being late or too lax leaves the forward-looking earnings chart skewed to the downside.
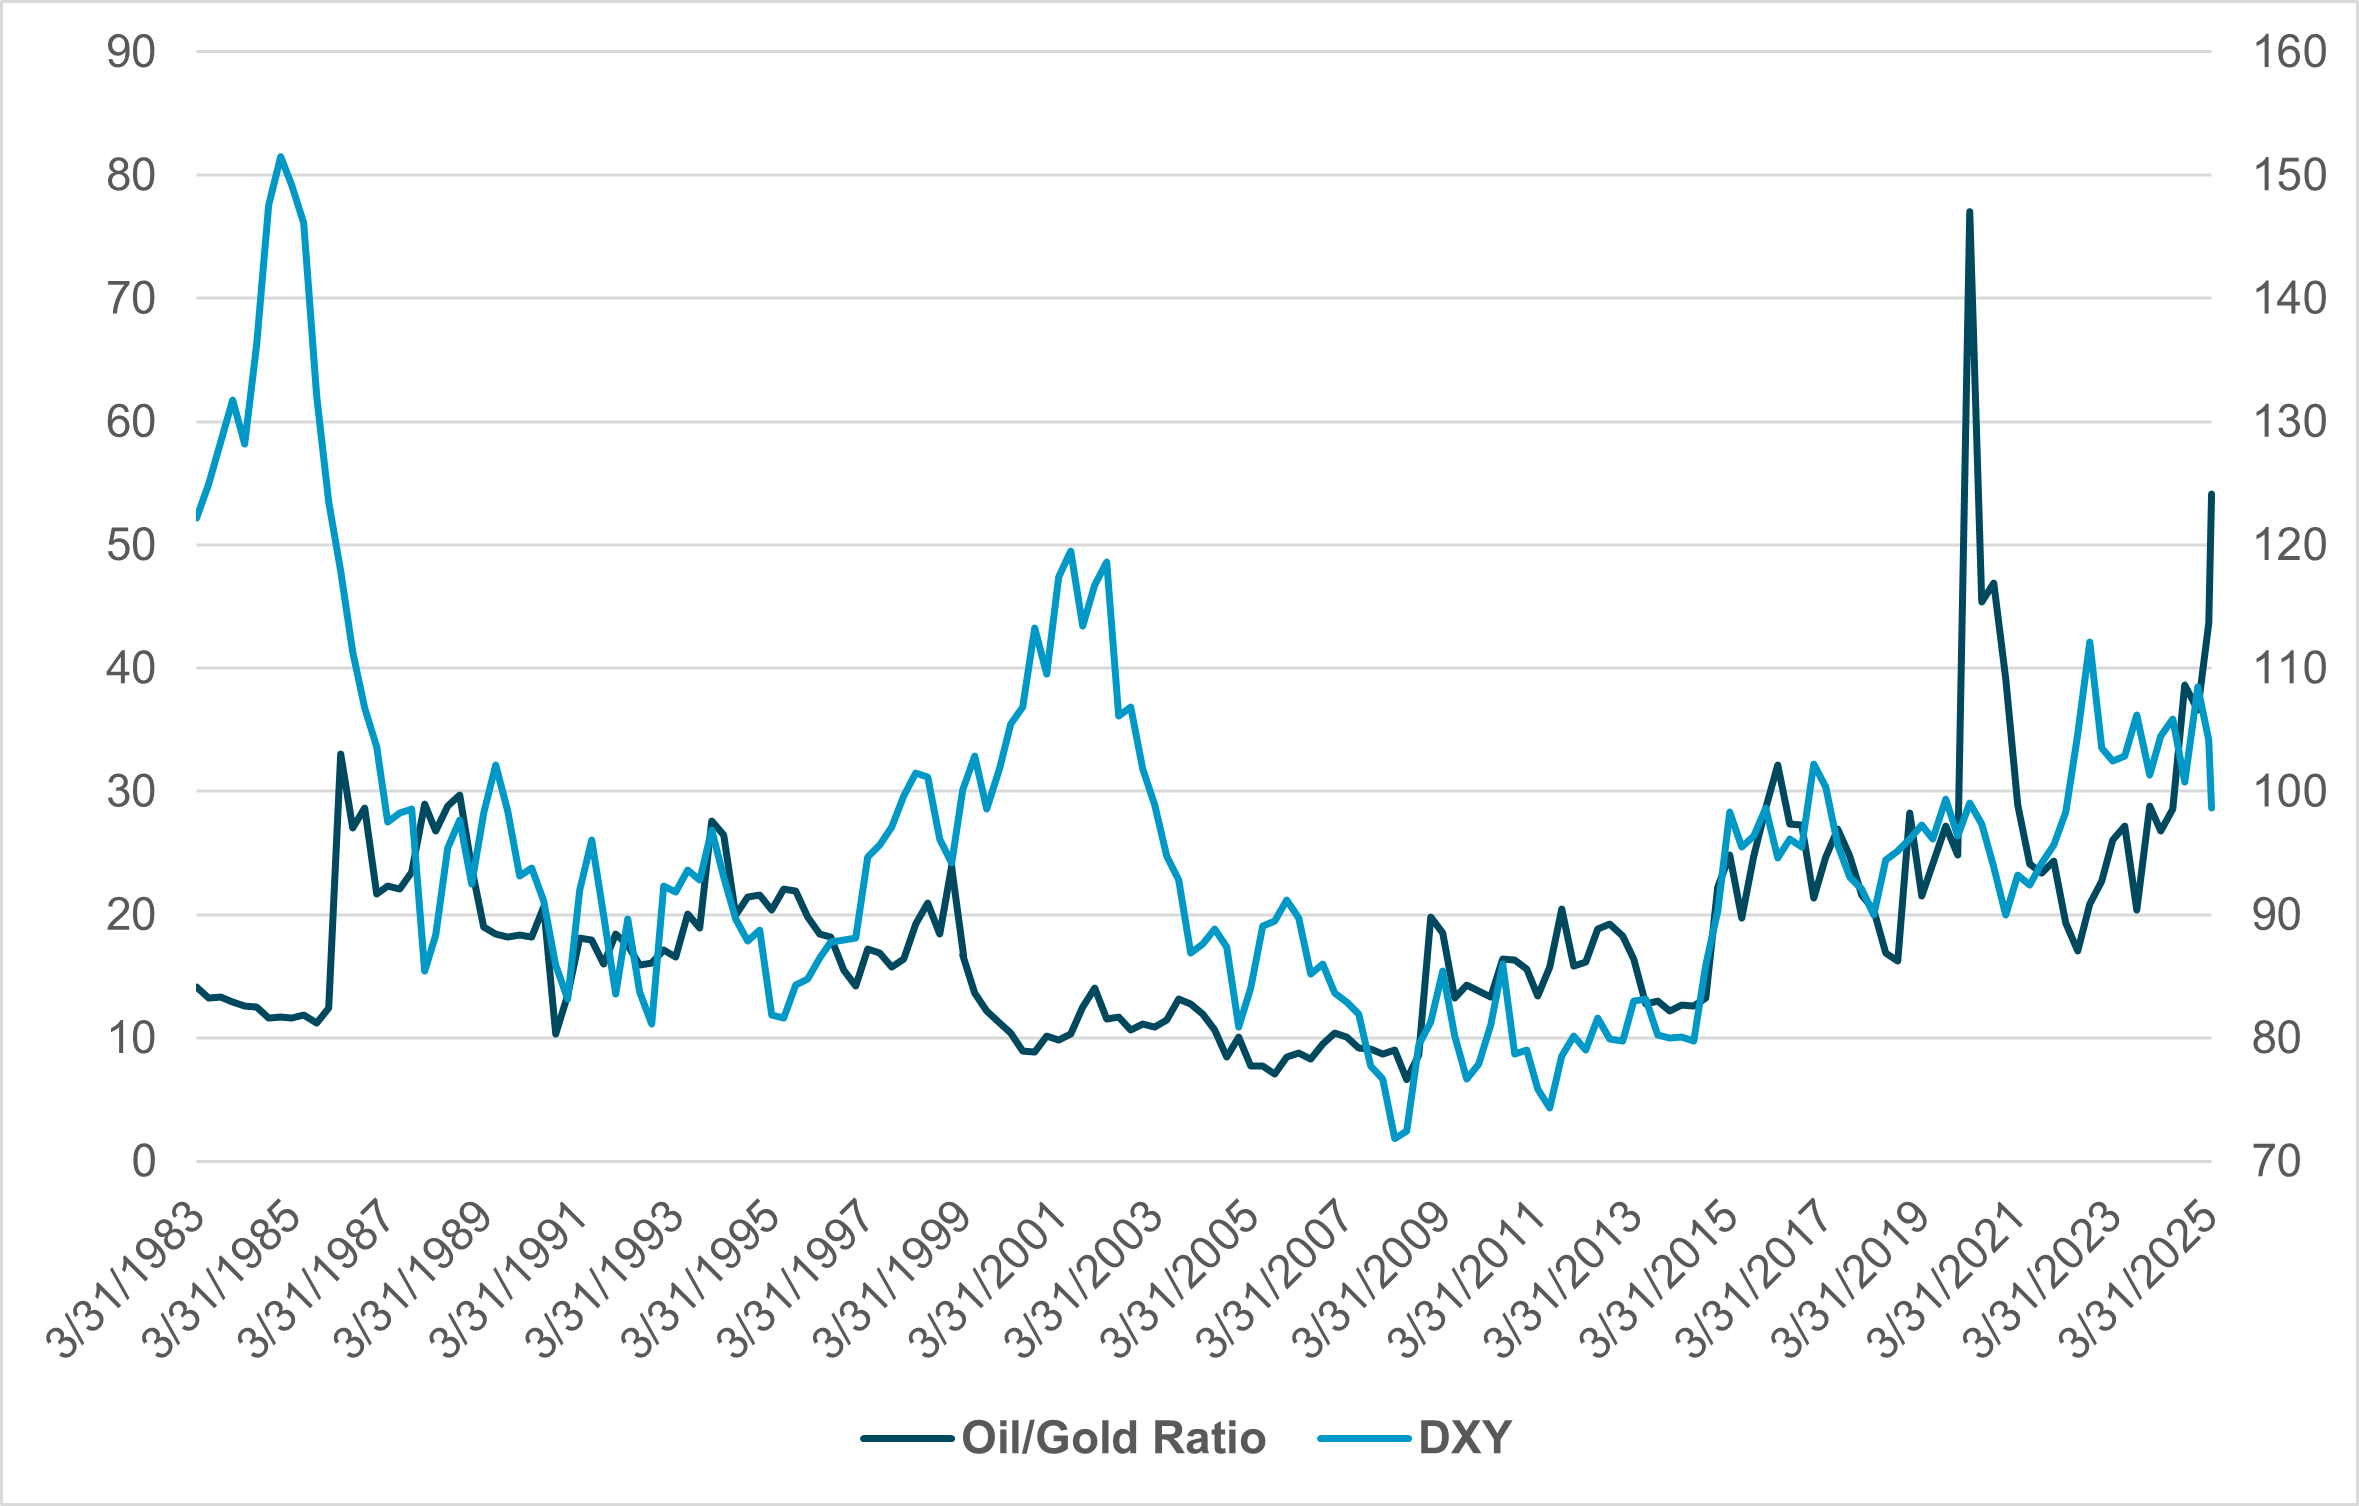
EXHIBIT #3: USD INDEX AND OIL/GOLD RATIO
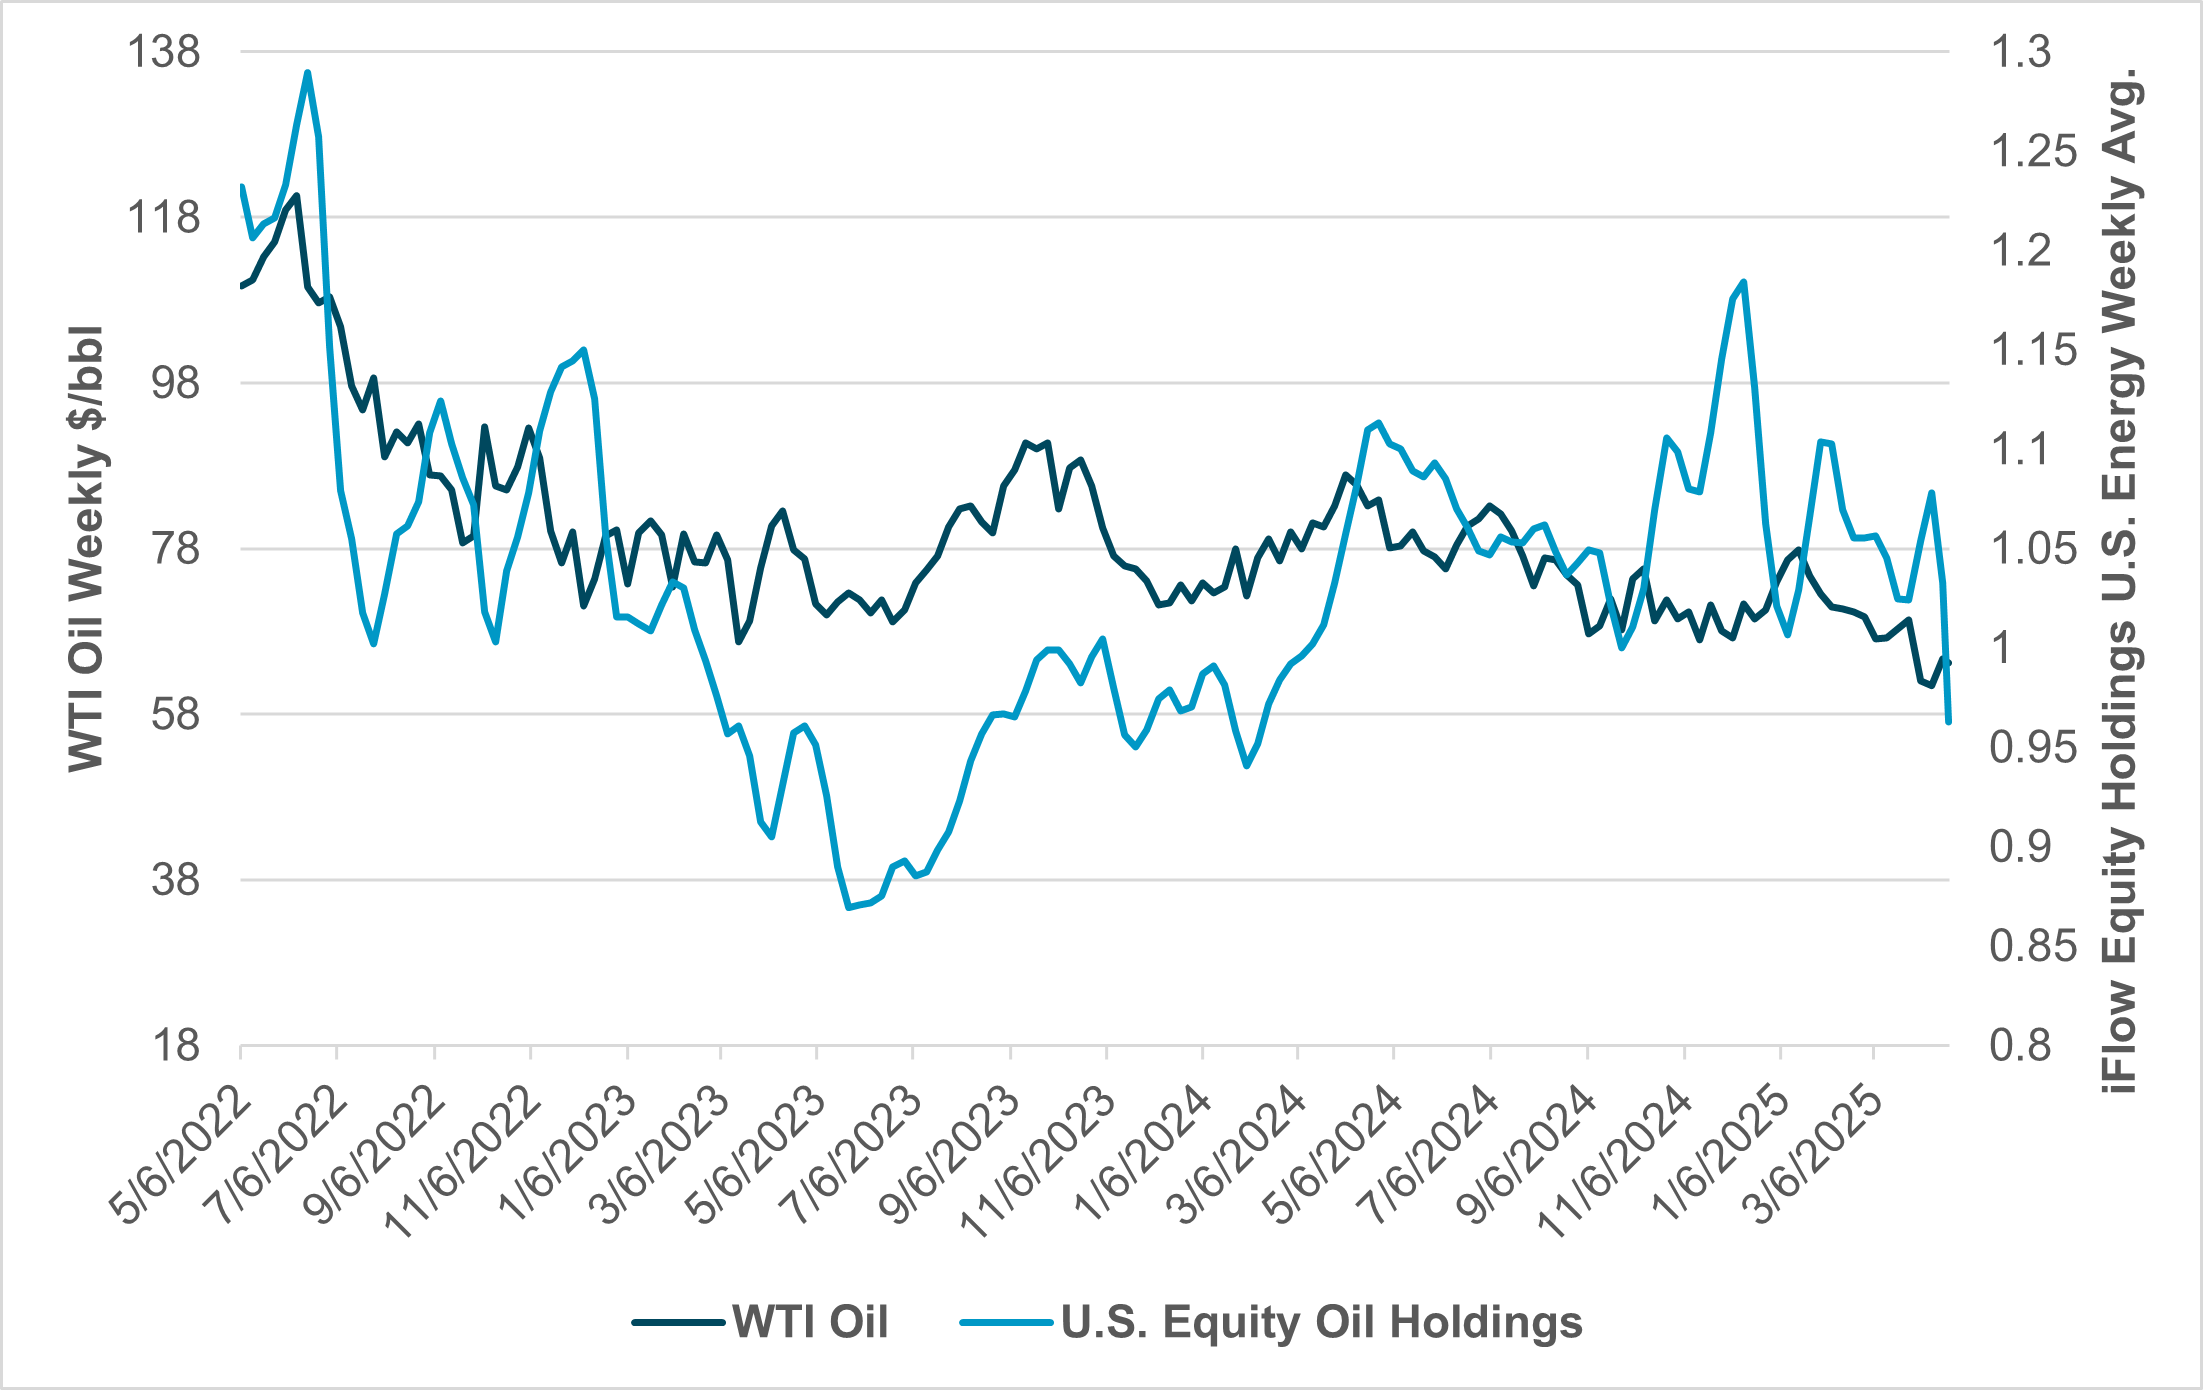
EXHIBIT #4: U.S. EQUITY HOLDINGS ENERGY SECTOR VS. WTI OIL PRICE
Source: Bloomberg, BNY
Commodity markets play an interesting role in the current environment as investors are caught between growth doubts because of U.S. tariffs and inflation fears. Gold’s role as an inflation hedge has been less correlated than it has been to currency debasement risks. The rise of QE and gold rekindled gold buying in 2010-2014 during the EU debt crisis and Fed QE. The Covid spike in money spending was another significant event. But the demand side of growth and inflation that flows from that is best linked to oil prices. The relationship of the USD to energy changed after the pandemic and the increase in oil prices matters to how the FX markets trade the dollar. The correlation between both energy sector holdings is interesting as oil going lower means the USD is lower.
Our Take
There are two main policies affecting energy sector performance. The first is the push by the Trump administration to encourage more oil exploration and active oil wells. The second is the link between demand for energy and global growth. Tariffs have, surprisingly, driven energy prices down. Another factor impacting the energy sector are the negotiations toward a peace deal in Ukraine and U.S.-Iran nuclear discussions, both of which are viewed as supportive of supply potential for the rest of the year. Our data show U.S. energy demand has been connected to utility and AI growth, with some spikes linked to electricity in 2024. There is also a connection between the performance of the energy sector and past U.S. recessions, and this may be a useful tool for monitoring the balance between price pressure and demand in Q2 outlooks.
Forward Look
When oil prices are higher than gold, markets expect growth and a recovery in S&P 500 earnings. Spikes in gold are usually a sign of inflation and weaker future demand. The experiences in 2009, 2015 and 2019 were notable, with the spike in 2020 due to the Covid pandemic historically large but short-lived. The current environment should give investors pause, as the increase is the second highest on record but is already longer than the one during the Covid pandemic, suggesting the current damage to growth ahead could be more significant. Time and margin pressures from a weaker USD and reduced growth expectations look likely to remain significant worries in the quarter ahead.
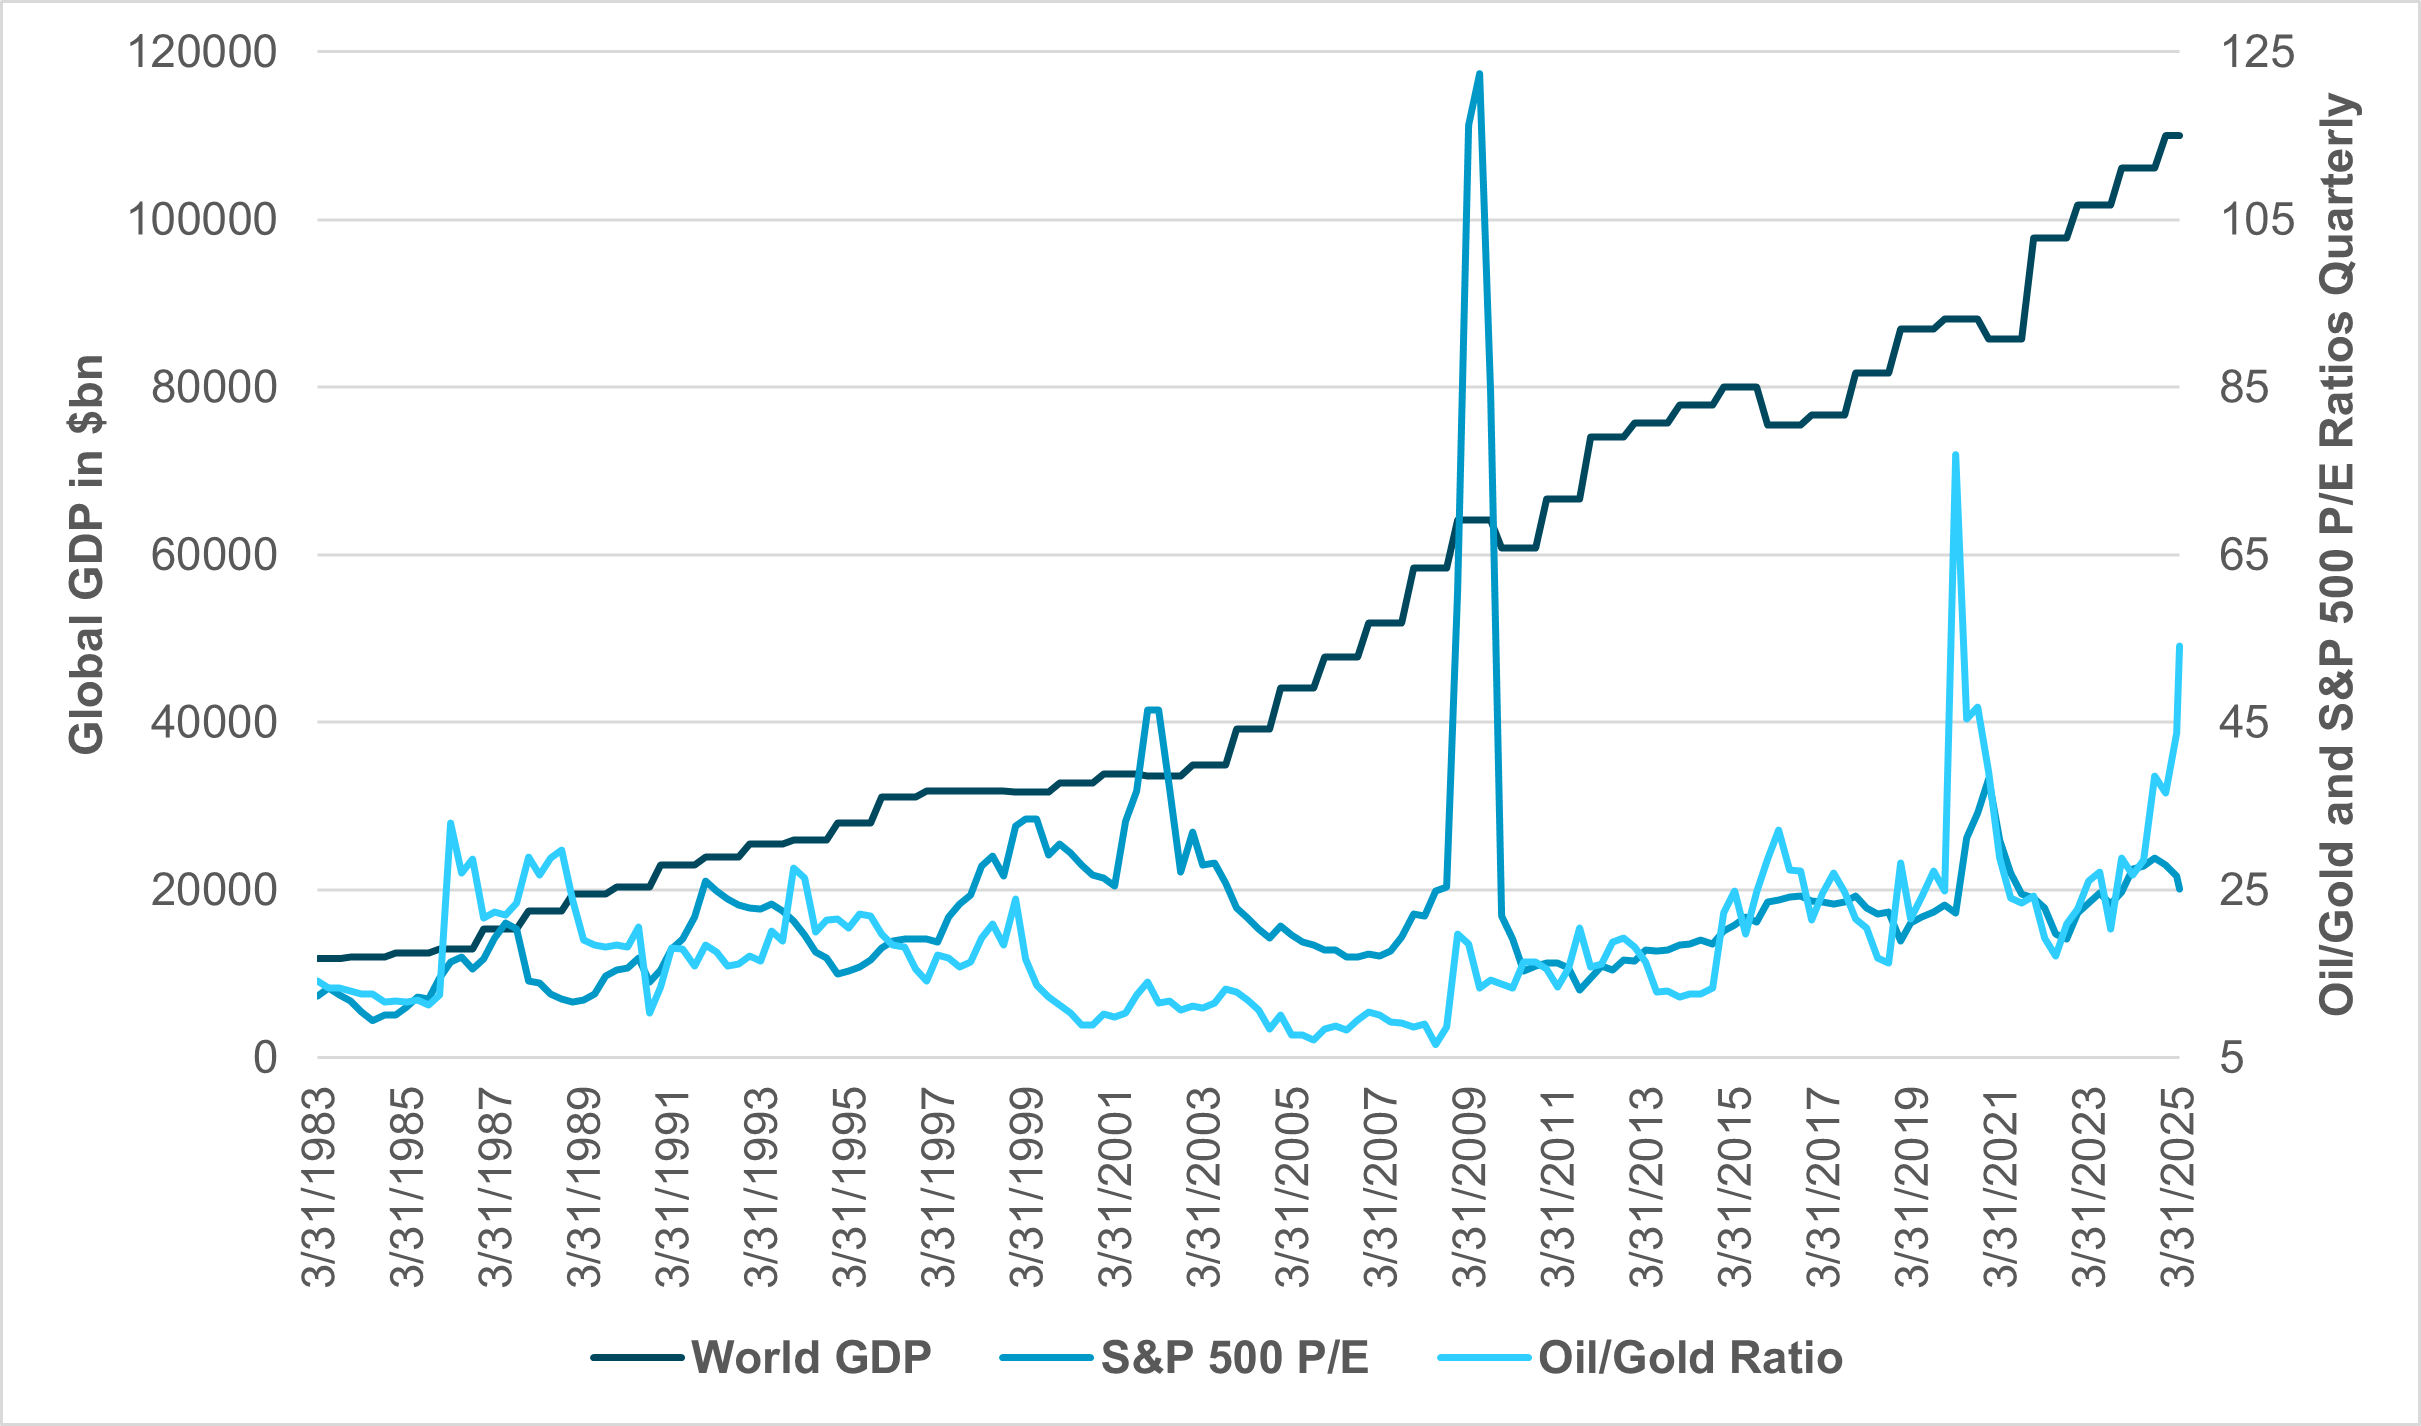
EXHIBIT #5: GLOBAL GDP AGAINST S&P P/E AND OIL/GOLD RATIO
Source: Bloomberg, BNY
First-quarter earnings have seen more focus on top-line misses than bottom-line beats, focusing attention on margins and how CEOs are approaching the second quarter, especially given the relationship between the USD and stagflation fears. The divergence between gold, at record highs, and copper, which is not, raises questions about global fiat currencies and growth prospects. Some attribute this to doubts about the USD’s reserve currency status, highlighted by significant gold buying in the Asia-Pacific region since April 2. Copper, after reaching new highs due to supply concerns and U.S. tariffs on March 26 at $5.2160 per pound, reversed course following “U.S. Liberation Day” and equity weakness, driving down U.S. and global growth outlooks. This confusion over copper prices stands in contrast to USD weakness. Energy and earnings of the sector should be a tiebreaker for how markets trade beyond the Q1 earnings season.