Start of Summer?
Equities provides an in-depth look each Friday at the factors shaping equities markets in developed and emerging economies around the world.
Equities provides an in-depth look each Friday at the factors shaping equities markets in developed and emerging economies around the world.

Bob Savage
Time to Read: 6 minutes
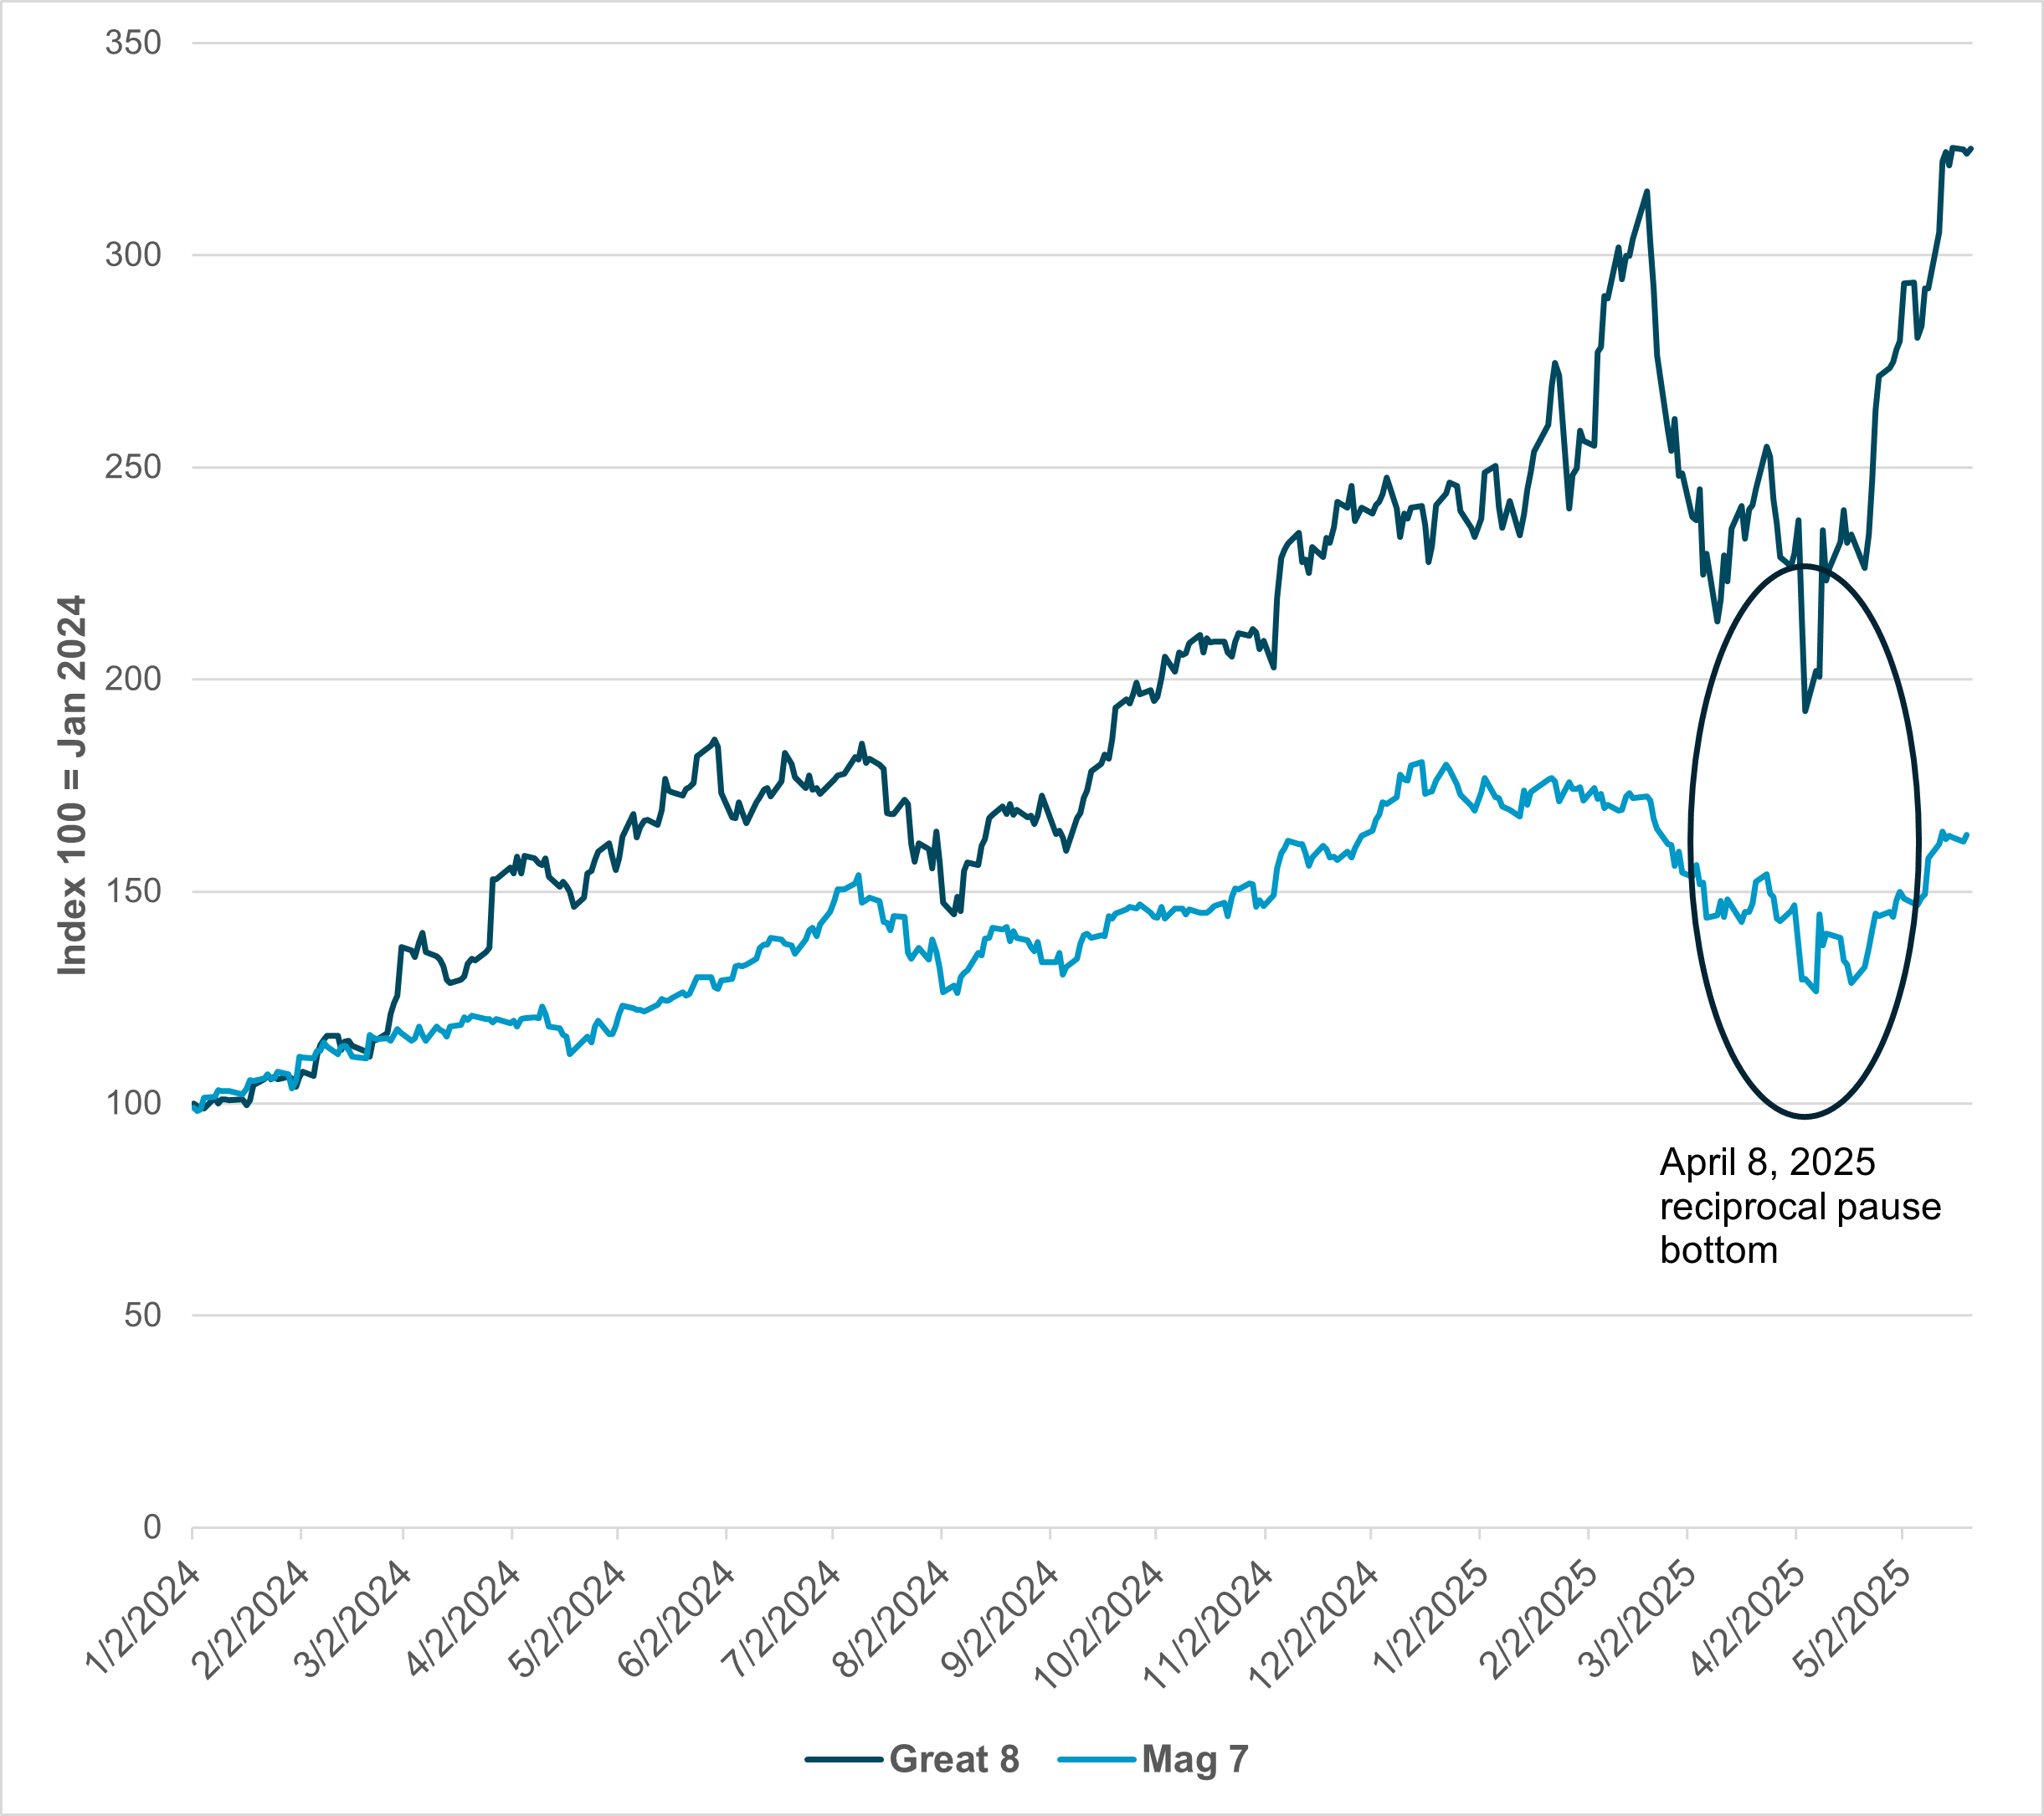
EXHIBIT #1: GREAT 8 VS. MAGNIFICENT 7 INDEX RETURNS
Source: BNY, Bloomberg
*Great 8 = cap-weighted NRG, MCHP, PLTR, STX, WDC, CEG, DELL, GEV
*Magnificent 7 = META, MSFT, NVDA, AAPL, GOOG, AMZ, TSLA
The new bull market for technology stocks has surprised many investors, but the rotation from the 2024 leaders to a new group of technology-linked companies is being lost amid rate volatility and uncertainty over trade deals and monetary policy. We highlight a new basket of S&P 500 stocks that has led the rally back in risk from April 8. This cherrypicked group has bounced the most from April 8 to May 21, increasing by 61.5% compared to 28% for the Magnificent 7 and 24% for the Nasdaq Composite. The Great 8 is comprised of five IT companies, two utilities and one industrial company. However, many doubt the durability of this rally because of asset allocation pressure as a result of higher U.S. yields, with the 30y yield over 5% this week. Confidence ahead will depend on how the new U.S. tax bill drives growth. Investors are still worried about risks for the rest of Q2 and beyond, but momentum pressure and the fear of missing out have clearly won out, as our flows show. Our Mood index bottomed out in April and tracks the recovery, albeit in slightly negative territory, suggesting some caution is still necessary for risk management in this time of heightened uncertainty. While investors have a limit to wait-and-see tactics, business leaders and policy makers take a longer view.
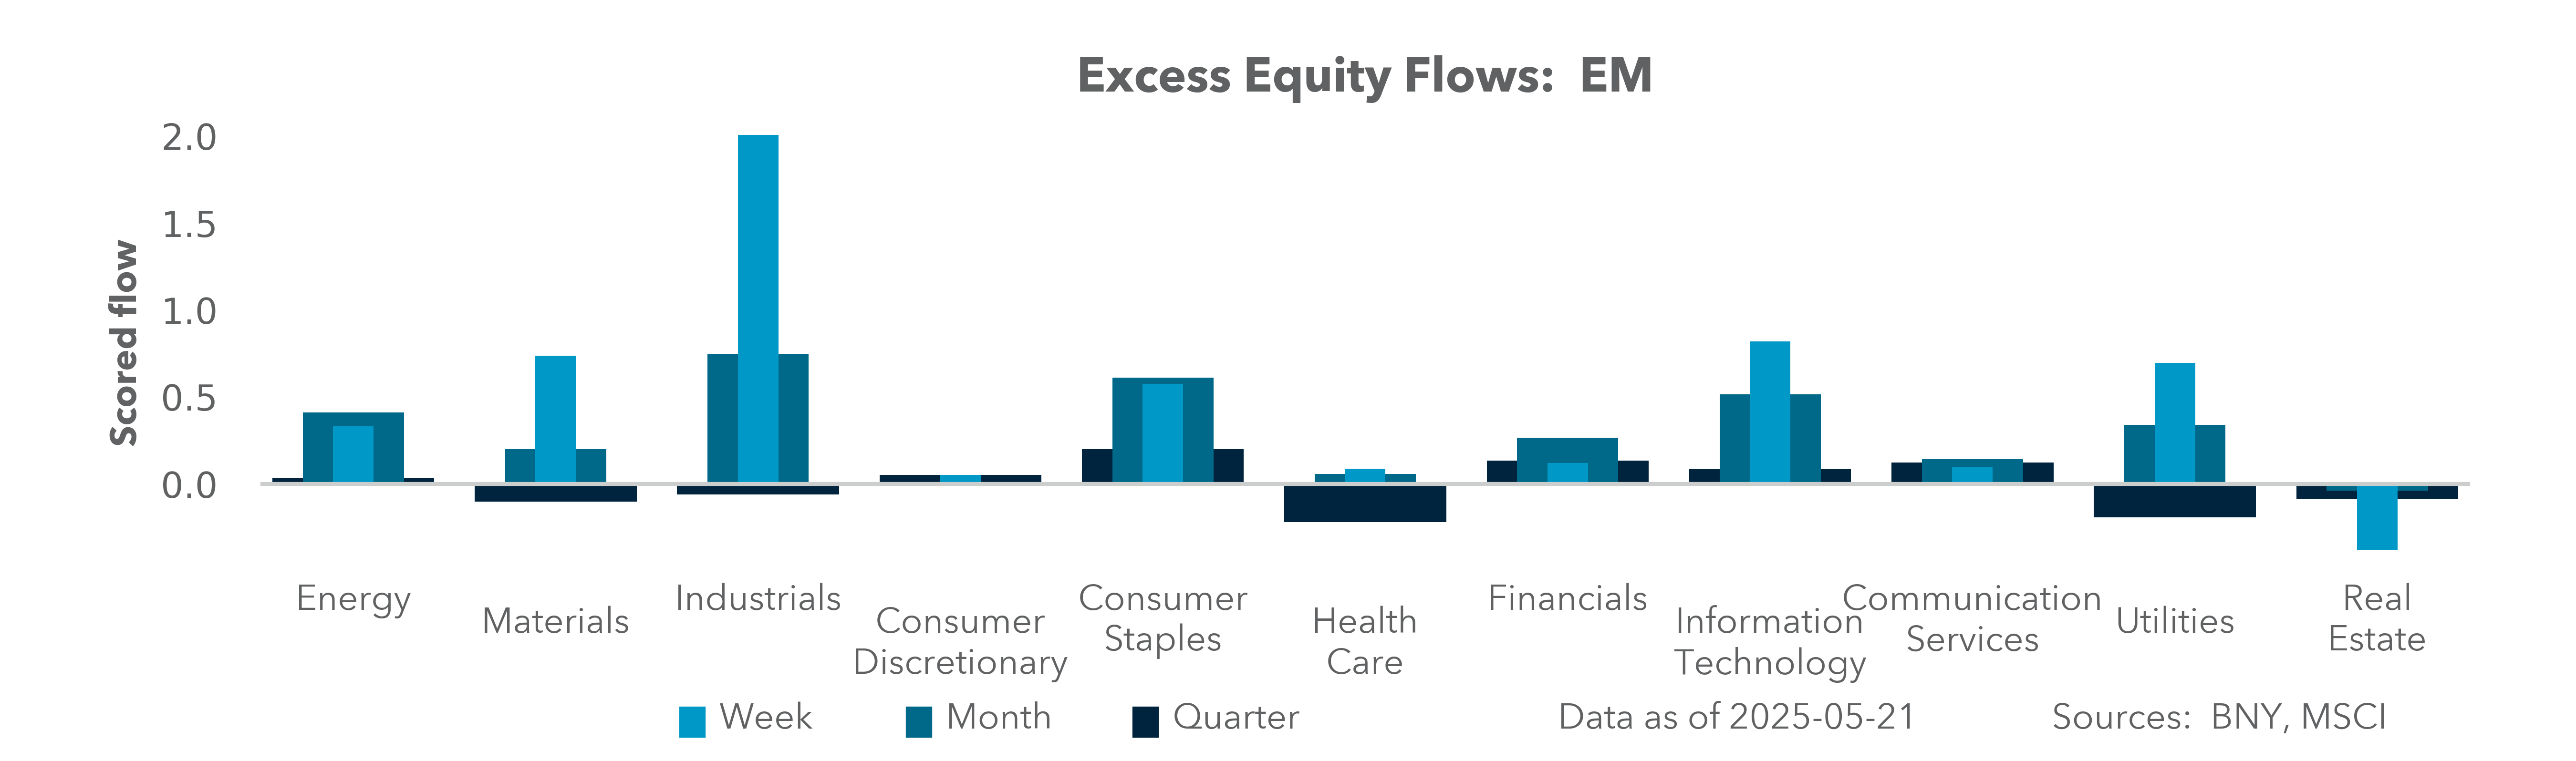
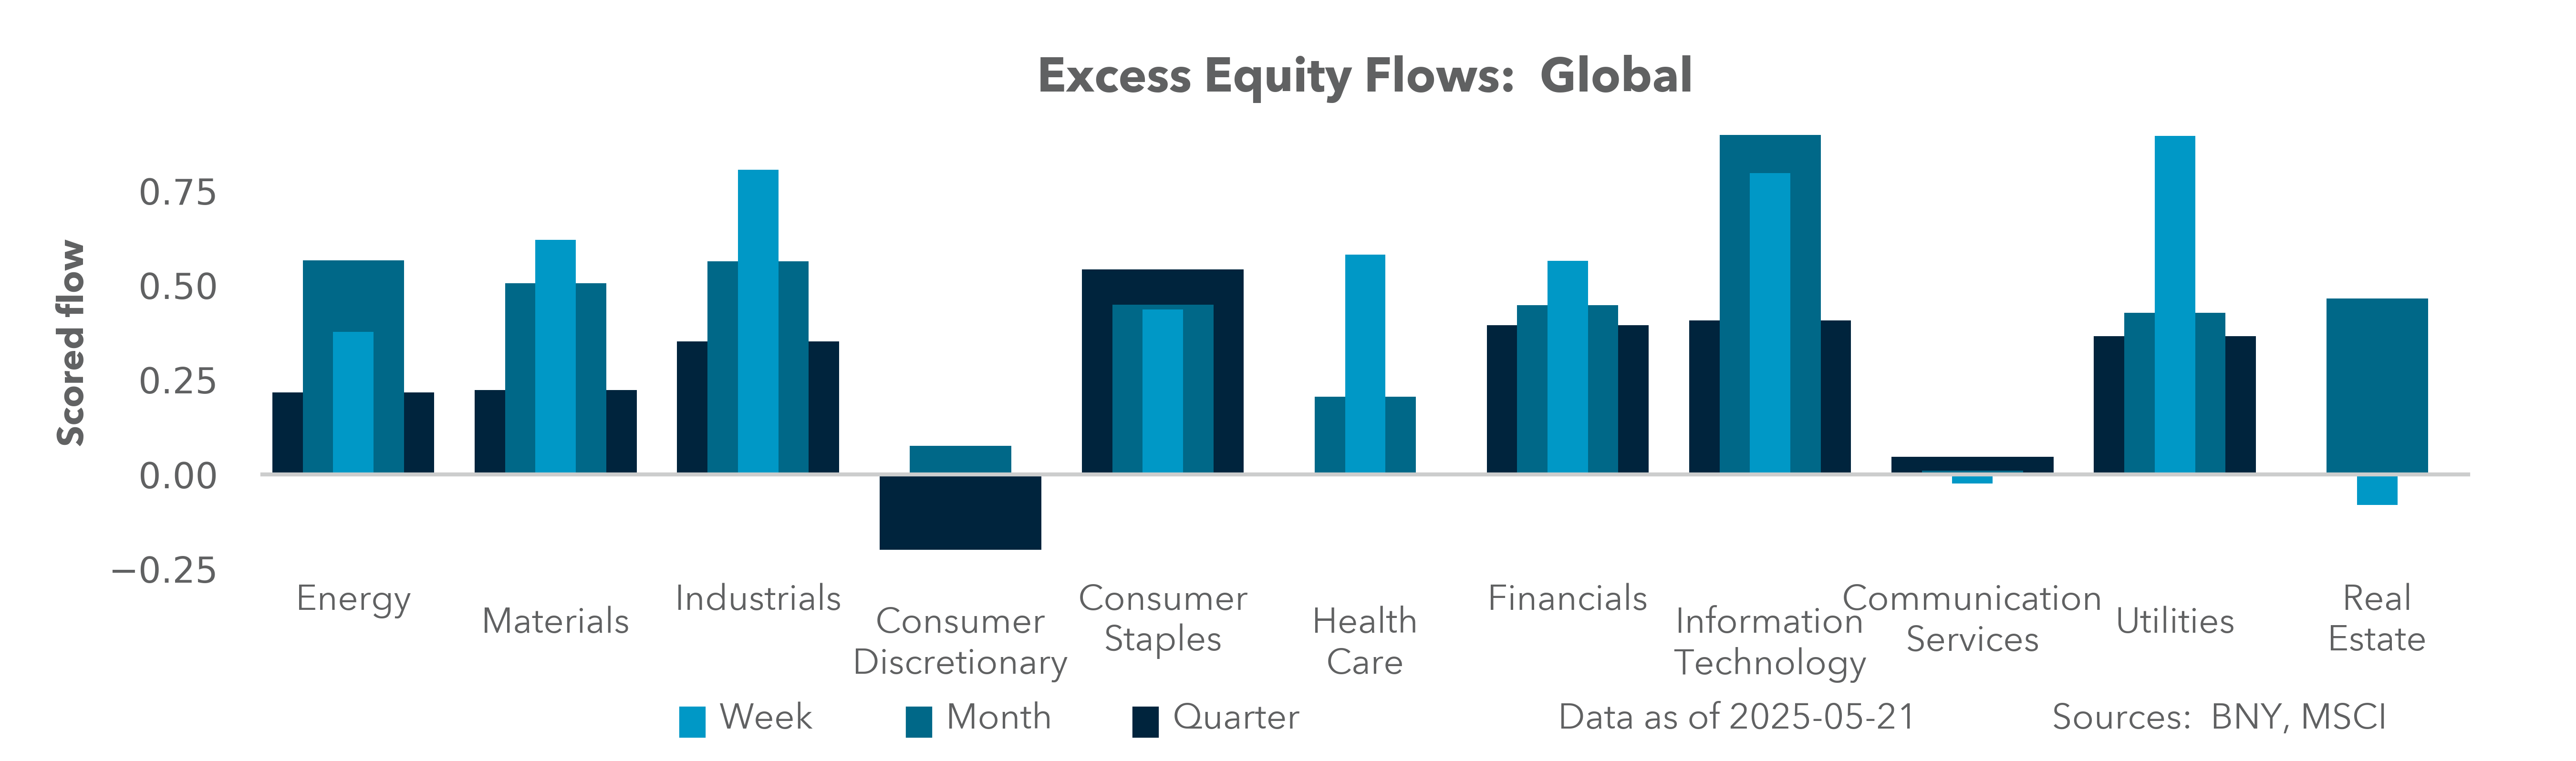
What our data show: The rally back in risk this week has been choppy, but our flows in developed markets were consistent for a sixth straight week. This highlights that the equities momentum has been global and concentrated in tech. The U.S. has seen robust inflows, with a weekly score of 1.40, up from a modest monthly score of 0.73. This shows that broad-based institutional demand is continuing following the initial round of retail buying from April 8-10. Tech shares dominated the flow, with a weekly score of 1.95, while health care bottomed out and bounced back with its score up 1.46 points, led by biotech. In the EU, France and Spain moved in lockstep, with France beating U.S. flows, with a very strong weekly score of 2.11, and Spain beating the U.S with a weekly score of 1.48. Together, the two countries demonstrate that the synchronized Eurozone strength in equities buying is continuing despite Germany’s weekly score of -2.48 on profit-taking in industrials and tech as tariff concerns rise. Also notable, Australia is showing sustained risk-on flows, with a weekly score of 1.46, despite a neutral monthly backdrop, indicating a shift in tactical positioning in the Asia-Pacific, with Taiwan leading as its weekly score is up 2.53 points.
Our Take
Investors have numerous fears, many of which are likely to extend into June, but relative value and beta factor strategies are working and dominating equities markets despite higher global rates. The list of worries is not yet a thematic basket driver:
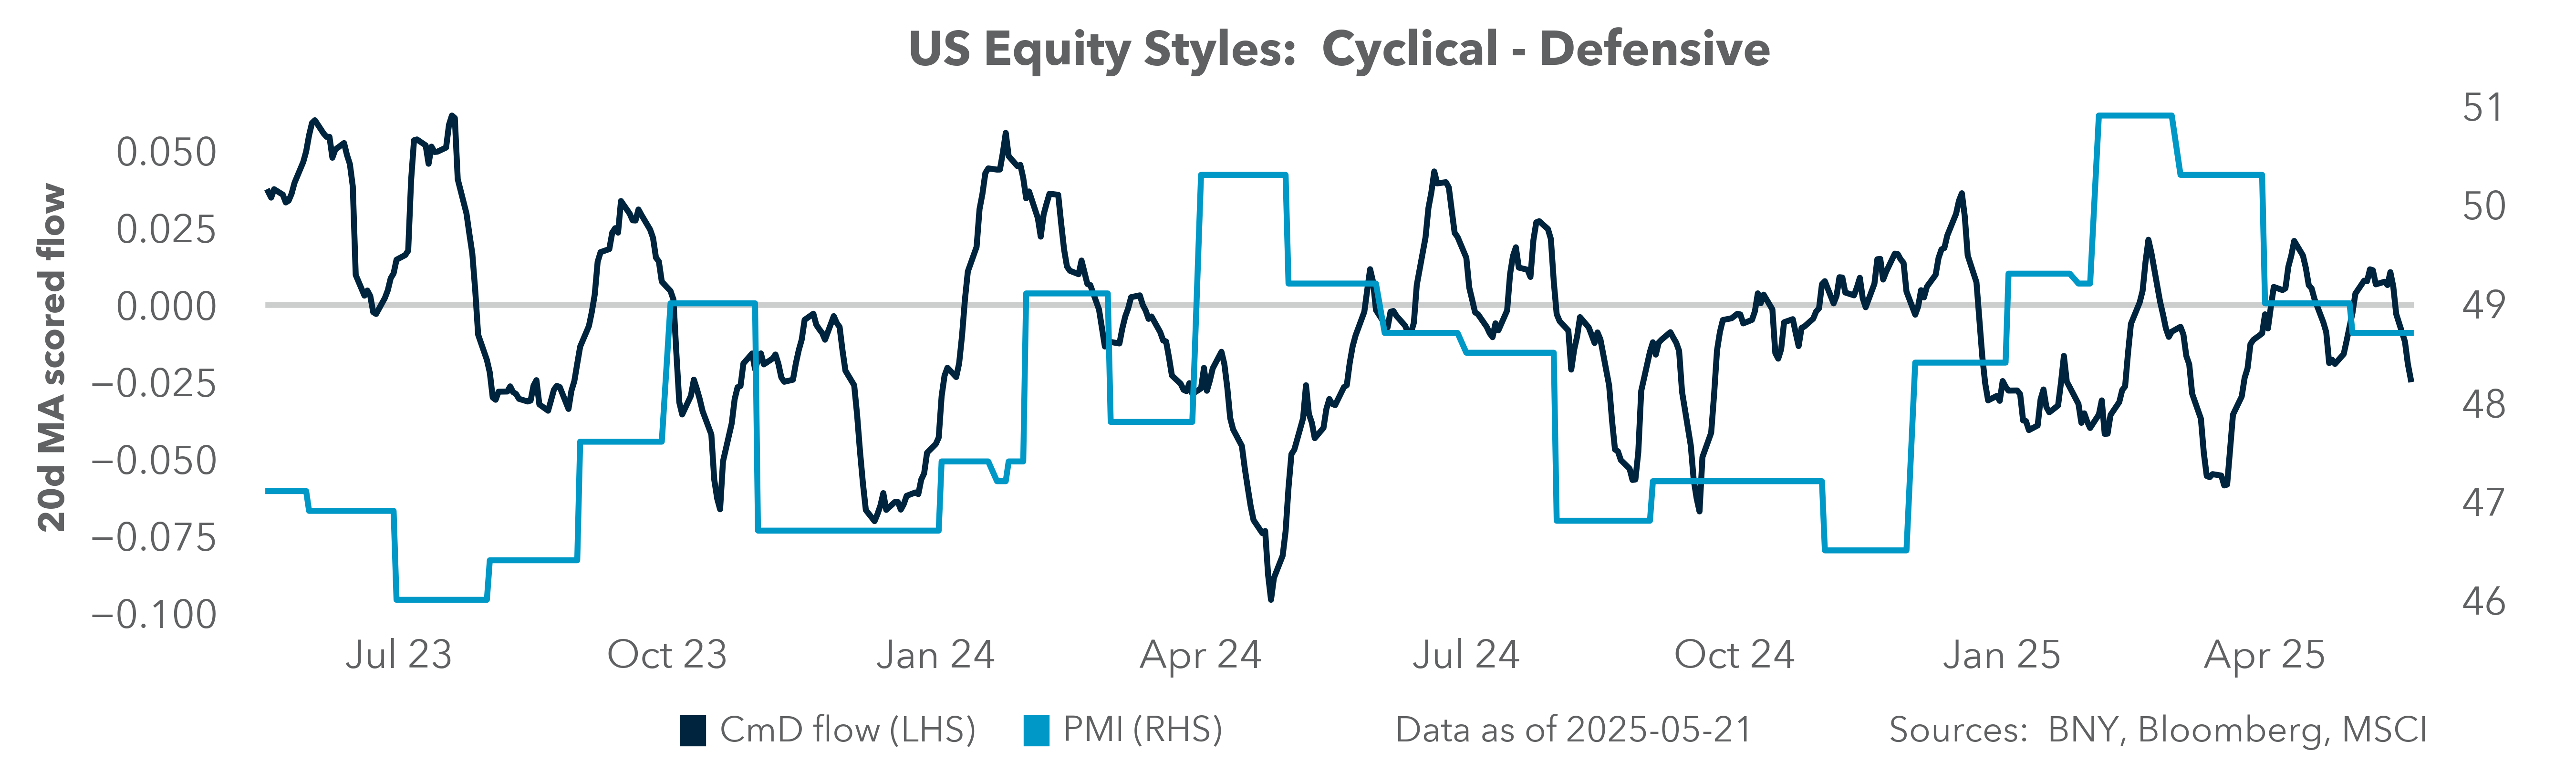
Against this backdrop, we see quantitative models of momentum, carry, growth and value performing positively for returns in equities. S&P 500 volatility, as measured by the VIX volatility index, is back below 20%, as liquidity measures normalize across other markets. iFlow U.S. factors show that both bonds and stocks are still being bought, with cyclical/defensive styles neutral and growth/value flows flat as well. Interestingly, leverage flows are rising despite higher U.S. rates.
Forward Look
The notable outperformance of the Great 8 against the Magnificent 7 basket of tech-related companies in the S&P 500 suggests that active management is still important to overall performance, particularly in a market where many beta strategies continue to work but not as well as they once did. The difference between the Magnificent 7 and Great 8 baskets of shares is volatility – with the Great 8 entailing higher risk, as shown by the drawdown of 122.5% from February 18 to April 8. This makes the Magnificent 7 high of 54.1% from December 17 to April 8 look modest in comparison. Market volatility will become an important driver for asset allocation and performance, but only when events drive fears higher – with these fears not currently clear enough to stop momentum.
EXHIBIT #2: U.S. CAPEX AND CURRENT ACCOUNT DEFICIT AS % OF GDP VS. GRW ETF
Source: BNY, Bloomberg
Logically, there should be some connection between capital spending and future returns. The health care sector has broken out of its sharp downside pricing and is now seeing significant upside pricing, led by biotechnology, which had three new patents. The biotech and medical devices industries were up 2.8% and 1.9%, respectively. Tech sector concerns were also in the news, with Q2 capex expectations falling by over 10%. However, the tech, communications and discretionary sectors are still the main drivers of overall capex spending in the U.S., accounting for 88% of the total.
Our Take
The correlation between capex and economic growth stands out, but the returns on investments in growth are uncorrelated. The new U.S. tax bill is seen as driving U.S. investments up 14.5% over the next four years, according to the Council of Economic Advisors. This would be an important lift to markets, with sliding capex and higher deficits dragging down shares in 2025. On the other hand, deficit risks are rising as a result of the new tax bill, as the Committee for a Responsible Federal Budget warns debt will amount to 7% of GDP in 2027.
Forward Look
The relationship between growth and capex broke down when the Magnificent 7 dominated U.S. stock returns starting in Q3 2023. Markets have only come back down since December, as the AI led boom stalled on valuation concerns. The impact of tariffs on growth has been modest, but companies need certainty in order to be able to invest in the future. We see more downside risk to growth, as the trade and budget deficits in the U.S. drive policy fears. The effects of the U.S. debt downgrade on U.S. equities shows up in the spread between blue chip shares and Nasdaq. The positioning risks for squeezes and sell-offs centers around health care and energy rallies against the financial and communications sectors. There is a clear sense that volatility across markets still matters more than simple momentum strategies for driving prices.
Our clients continue to buy the dip if not outright chase the tape. Our data reveal that the risk rally this week has been volatile, linked to rates, yet flows in developed markets have remained consistent for a sixth consecutive week, highlighting global momentum concentrated in tech. The role of asset allocation and bond yields is likely to be important through the holiday-shortened week ahead given month-end rebalancing. These are the three takeaways as we head into next week:
1. The Nasdaq’s bull market, with the index up over 20% since April 8, is being led by a “Great 8” basket (primarily IT, utilities and industrials). This group of stocks has gained 61.5% compared to the 28% increase in the Magnificent 7, fueled by global tech momentum despite concerns about U.S. yields and economic risks.
2. Developed markets had consistent equity inflows for the sixth week in a row, with the weekly iFlow score for the U.S. and France both standing out. This highlights the strong institutional demand in tech and health care (led by biotech), contrasted with profit-taking in Germany amid tariff concerns.
3. Despite quantitative models favoring momentum, carry, growth and value, the significant drawdown risk of the Great 8 (65%) compared to the Magnificent 7 (38%) suggests market volatility will drive asset allocation when events heighten fears, particularly given the downside risks to growth from higher rates balanced against hopes for tax cuts and deregulation.