Liquidity and Capex
iFlow > Equities
An in-depth look each Friday at the factors shaping equities markets in developed and emerging economies around the world.
iFlow > Equities
An in-depth look each Friday at the factors shaping equities markets in developed and emerging economies around the world.

Bob Savage
Time to Read: 7 minutes
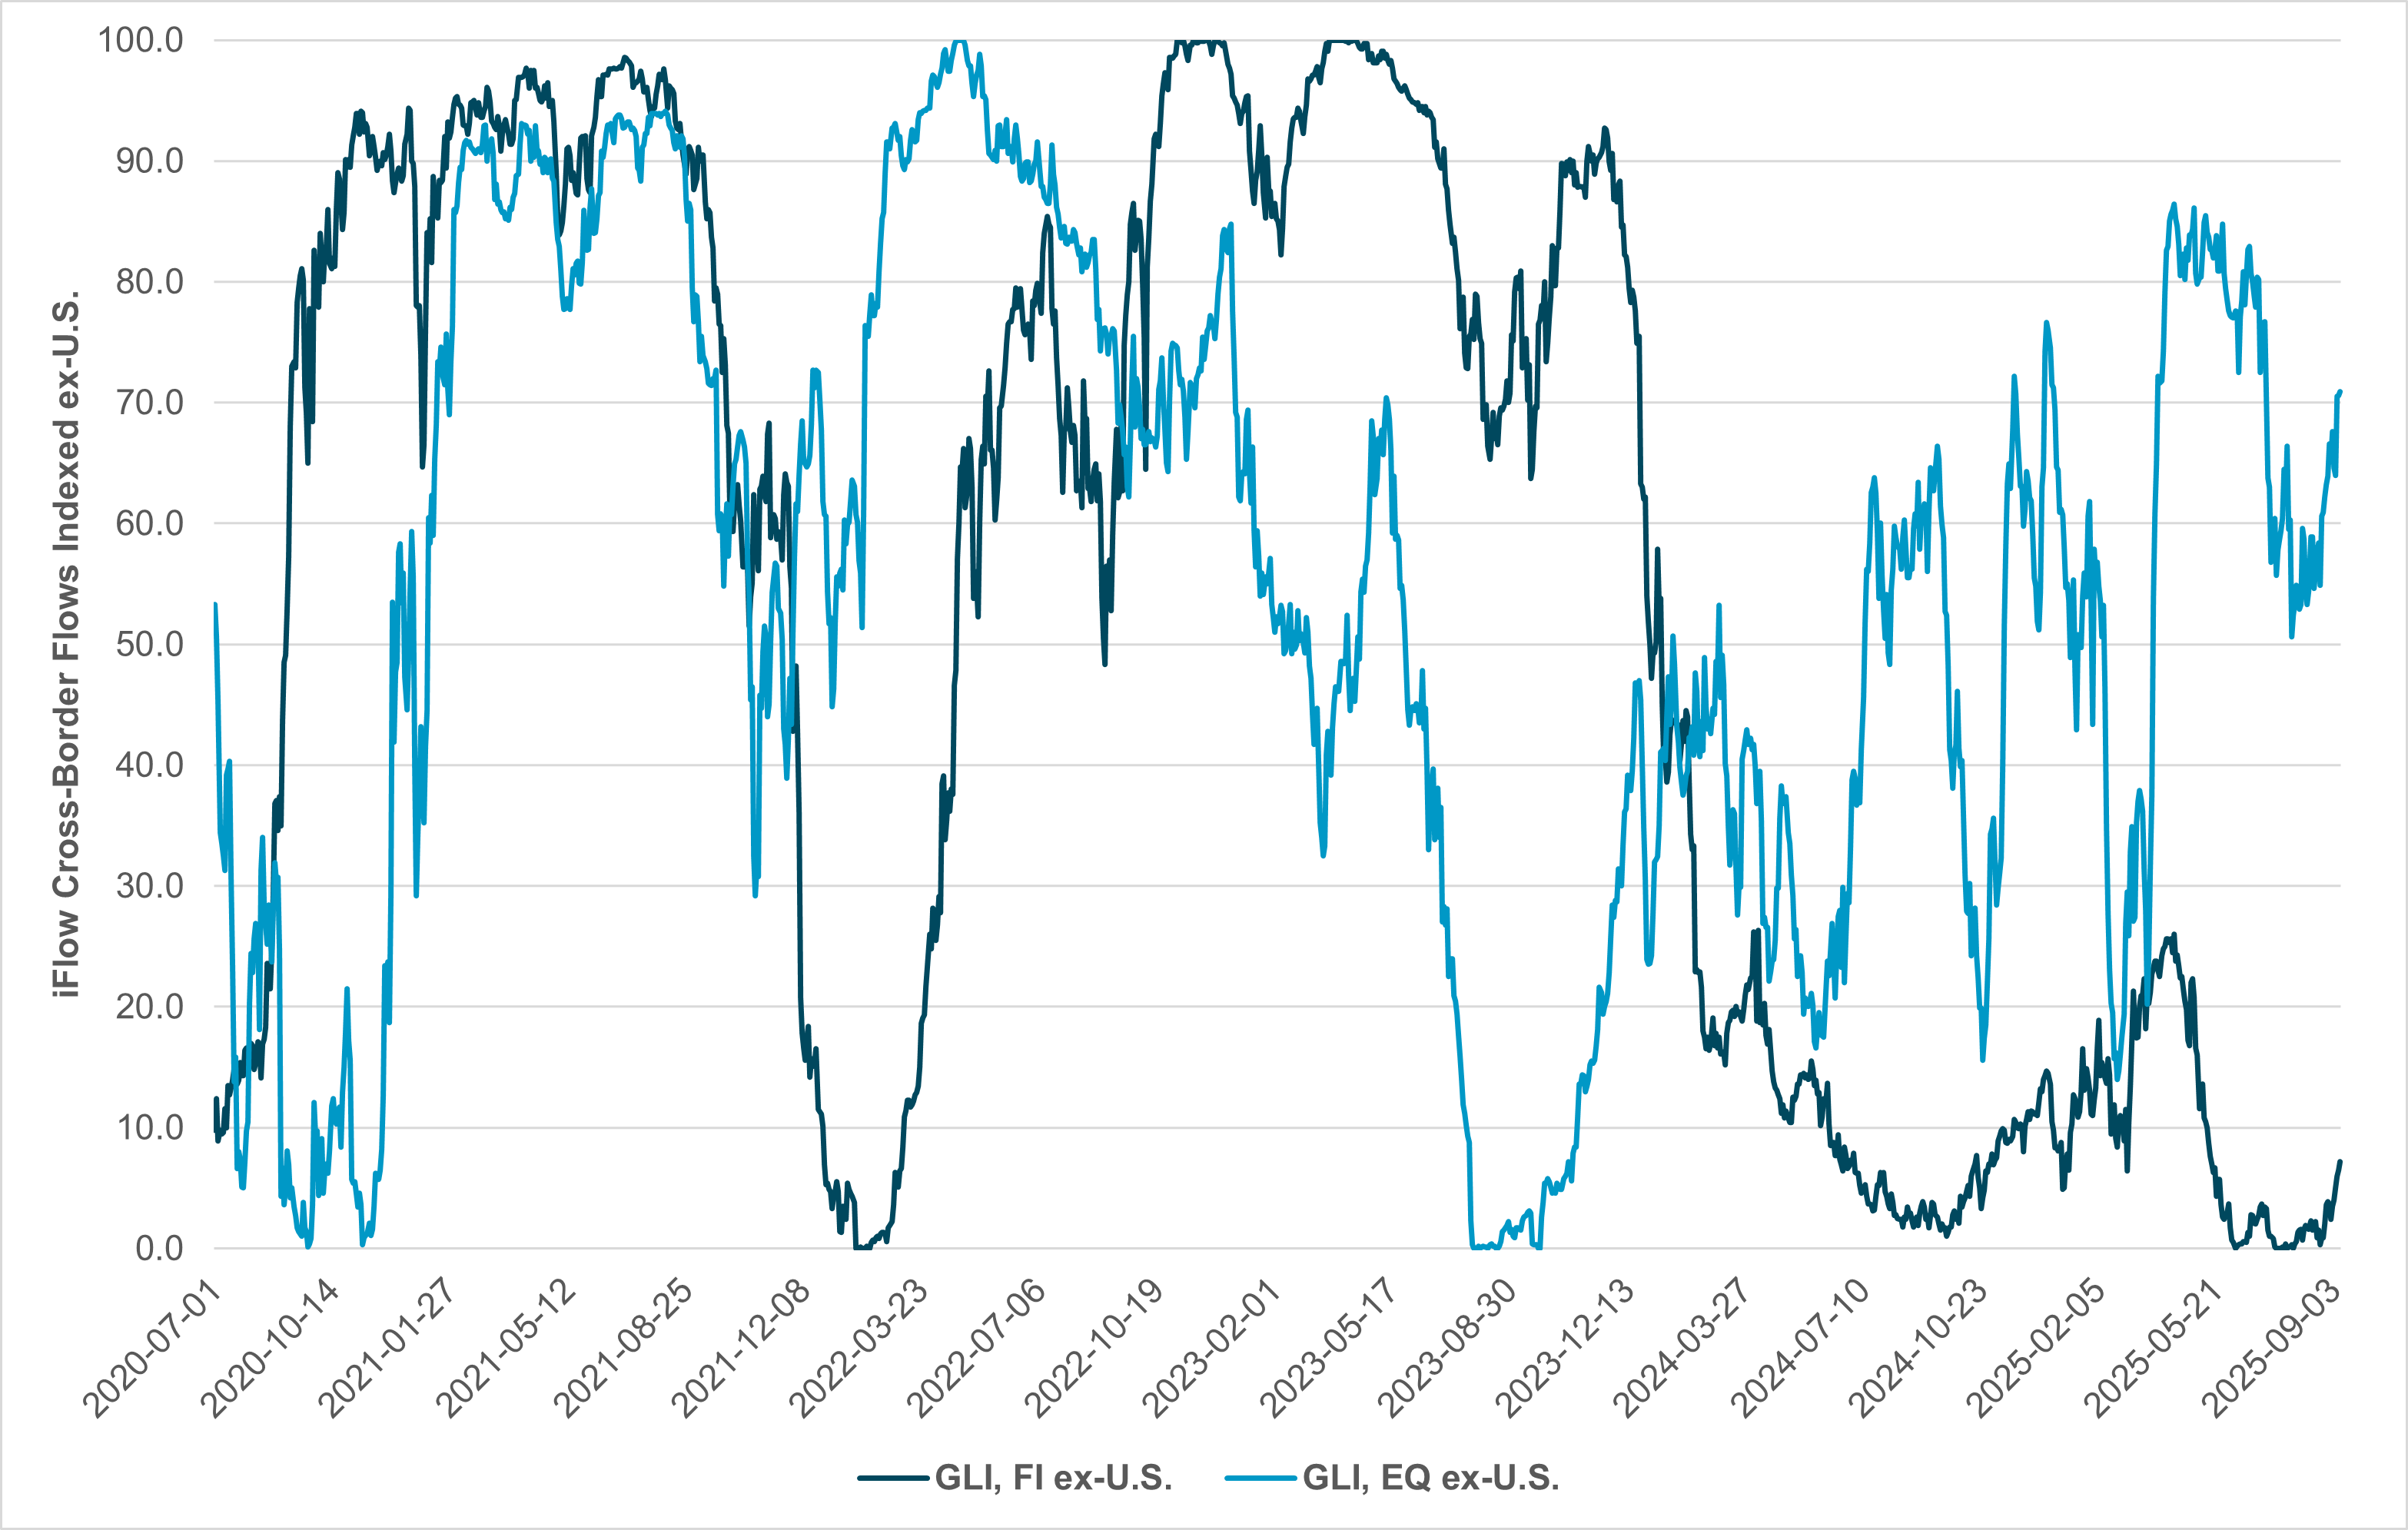
EXHIBIT #1: IFLOW GLOBAL LIQUIDITY INDEX (EX-U.S.) – CROSS-BORDER FLOWS OF BONDS AND STOCKS
Source: BNY
Equities surprised investors this week by extending their rally to reach historic highs, even as economic data continues to point to a weaker U.S. economy with slowing job creation and sticky inflation. There are six factors behind the stock market’s continued rise: 1) expectations of Fed easing (with three cuts now priced in through the end of 2025); 2) ongoing easy fiscal conditions in the U.S. and abroad; 3) expectations that Q3 earnings will climb further; 4) the belief that U.S. capex, linked to AI, and tax bills, will continue to increase; 5) strong U.S. consumer and corporate balance sheets; and 6) deregulation efforts by President Trump spurring growth. However, enthusiasm for shares remains tempered by inflation concerns, ongoing geopolitical tensions, doubts about Fed independence, the size of U.S. debt, and fears of a U.S. recession. There are conflicting views of U.S. growth. Nowcasts of Q3 GDP by the New York and Atlanta Fed put growth at 2–3%, while the blue chip consensus is 1%. The risk of stall speed growth despite Fed cuts seems underappreciated in stocks and overpriced in fixed income markets. Tracking global liquidity against the S&P 500 shows the current risks for investors as they balance higher valuations against the cost of not participating in the usual October sprint to year-end equity outperformance. Investors are once again talking about FOMO (fear of missing out) and TINA (there is no alternative) after the April retreat. Looking at global liquidity as a key support for continuing the U.S. rally, our iFlow cross-border flows globally show that Fed cuts are essential to keeping the mood intact.
Our take
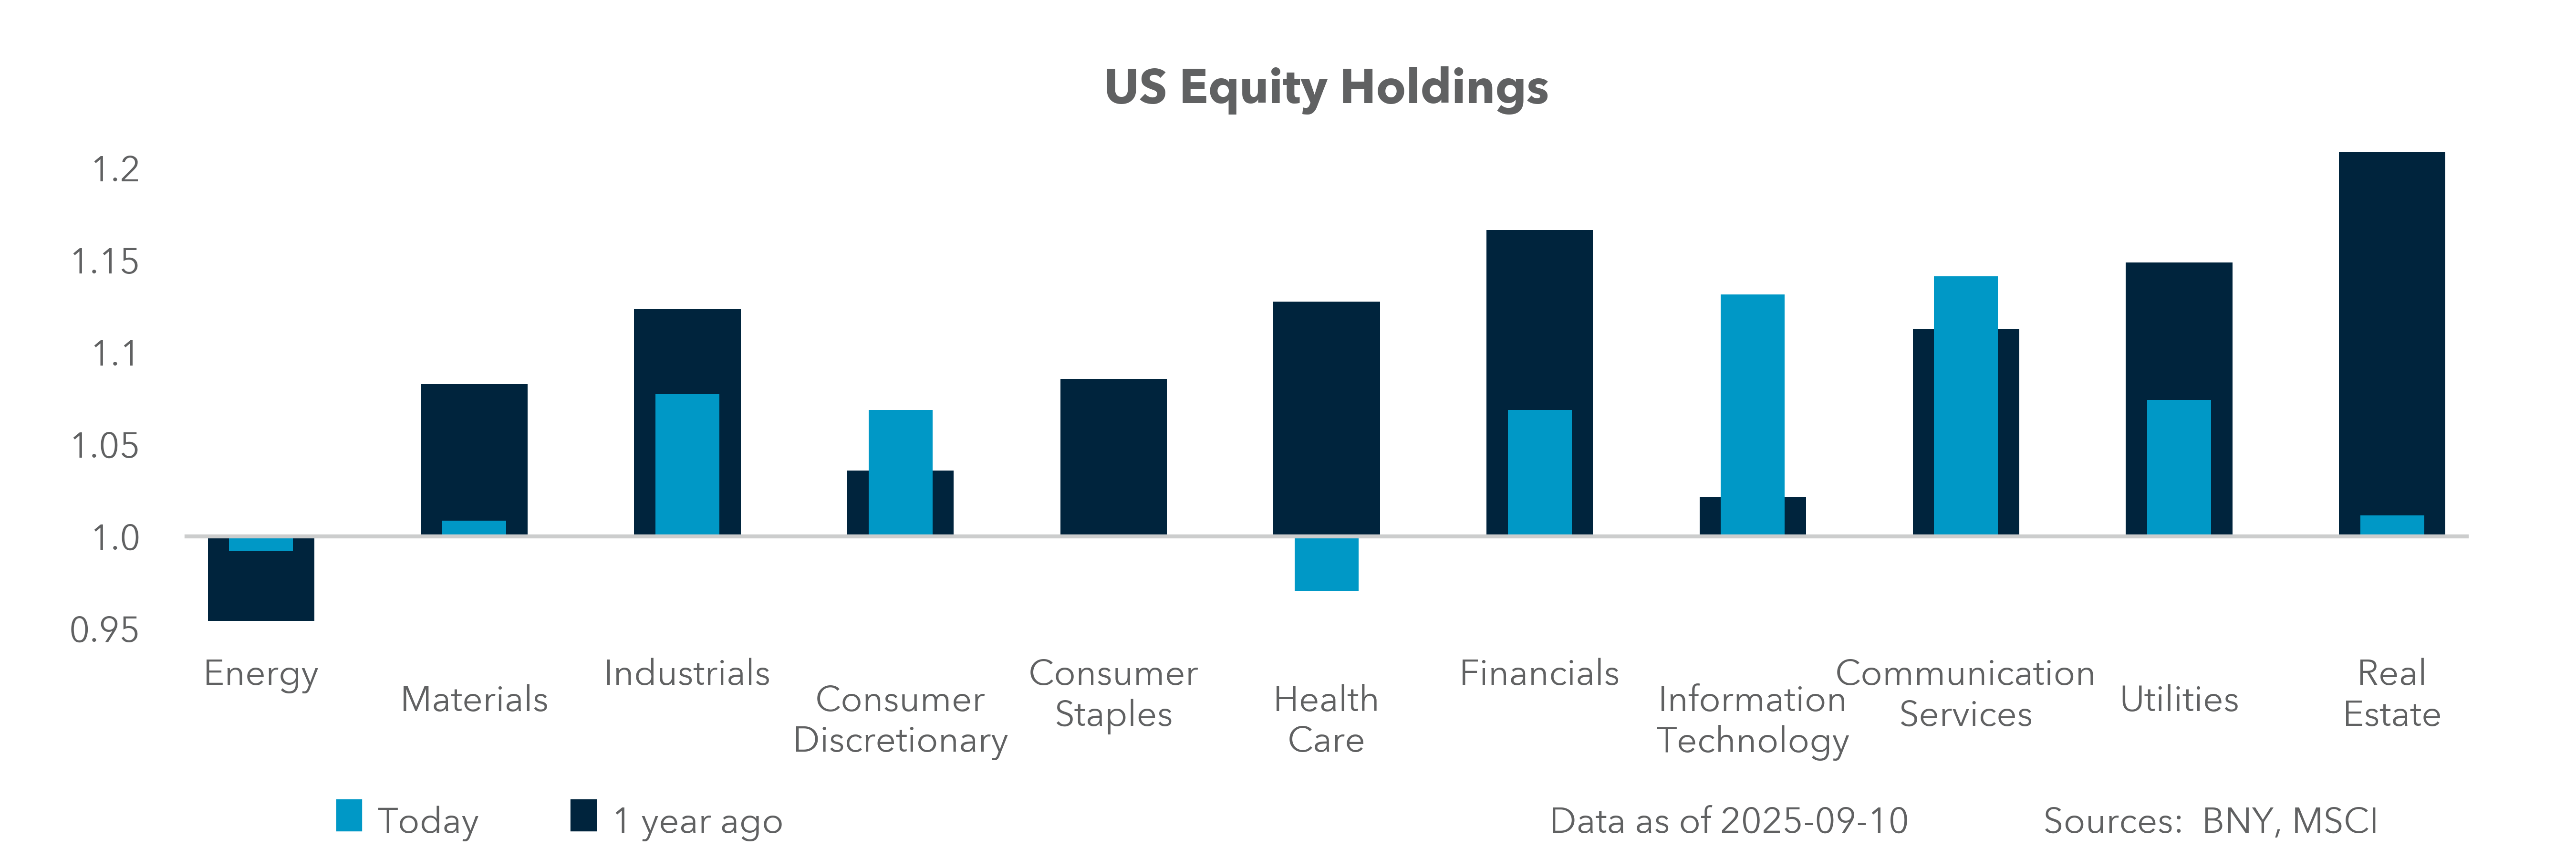
We created a global liquidity index to measure the excess flows outside of domestic investments for the world (excluding the U.S.) to see if foreign flows support current risk in U.S. markets. Exhibit #1 shows the indexed result of these flows. The broad trend since the Fed tightened policy suggests the rest of the world may be less inclined to share excess liquidity back to the U.S. markets, making any global liquidity expectation less powerful. It also further deteriorates the role of a weaker USD in helping exporters and adds to market concerns of AI concentration risks. The bridge between AI capex supporting U.S. growth into year-end and U.S. tax reforms for capital spending may be a key factor for rotation trades. Our flows show Industrials and IT rebounded in mid-August, while Energy and Materials improved but did not hold up. These are the sectors most likely to benefit from reform and deregulation. Notably, cross-border investors concentrated on IT, while domestic investors took a broader view. Bond buying by corporate and sovereign interests is more modest and had not been a factor since April until U.S. rate cut expectations shifted in late August.
Forward look
Foreign investors have bought U.S. equities but more selectively over the last two months. Tracking flows in line with the six factors behind the extension of the rally reveals the importance of Fed cuts. Increased capex is linked to the tax bill and the hope that the rest of the world will support U.S. soft-landing expectations. Following passage of the “Big, Beautiful Bill,” cross-border investors have meaningfully increased their relative weight in U.S. IT. This sector is now at 1.157 as of September 2025, up from approximately 1.03 in June, representing an overweight of +0.13 compared to the six-month mean. This is the strongest net gain among all U.S. capex-linked sectors, implying that a rotation trade on U.S. rates may trigger more interest in other sectors as well, with Industrials and Materials being the leaders. In Industrials, foreign exposure has also trended up, climbing to 1.053, about +0.04 over the six-month mean, though at a slower pace than IT. Meanwhile, Materials and catch-up trade shows up with 0.983, or +/0.10 over the six-month average, albeit it from a significantly lower base. The one sector to watch for liquidity from abroad and one with the least ownership is Energy, where cross-border investors – like domestic investors – are underweight.
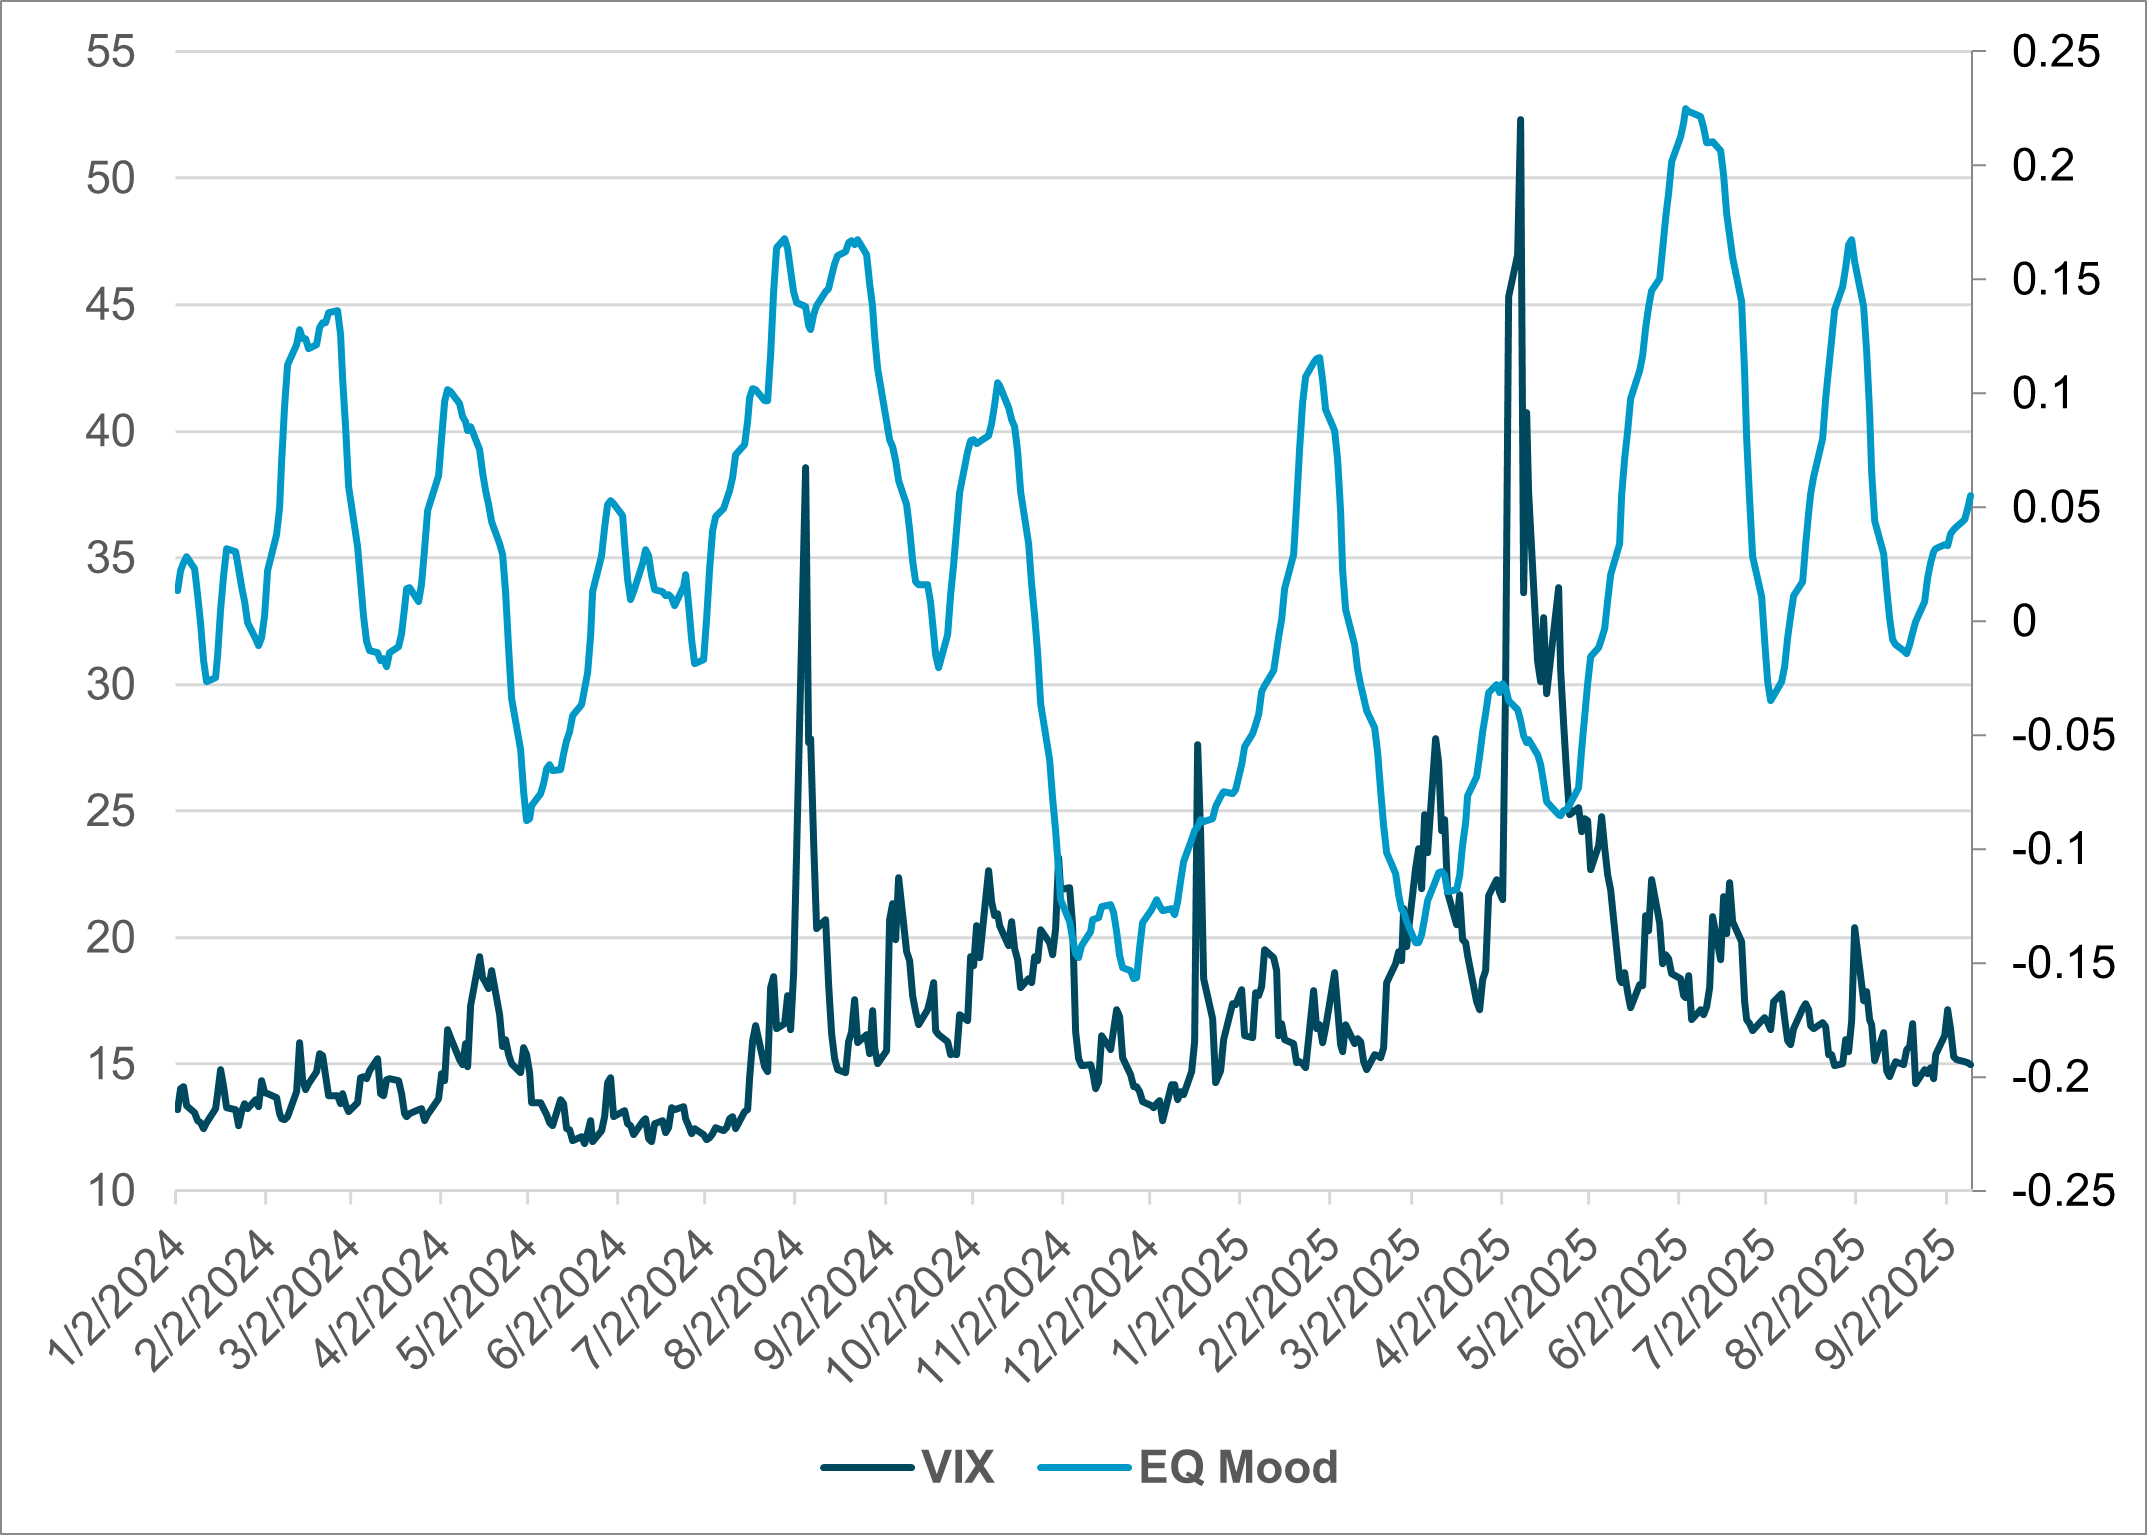
EXHIBIT #2: U.S. VIX VS. IFLOW EQUITY MOOD
Source: BNY, Bloomberg
Our take
The iFlow Mood index for global equities reveals the importance of Fed easing as a driver of stocks, with equities recovering significantly from negative levels in April to near neutral today. The global investor mood has been defensive for most of 2025, with the summer rally in in equities outstripping real money flows. The VIX index reflects the split between our flows and market fears. The recent market rally from August lows reflects the number of companies that will benefit from lower rates, particularly autos and housing. Our Mood index includes bill purchases as a negative risk response. Currently, however, we are seeing both a rally in equities and short-end fixed income buying as positives as investors put cash to work in the hope that Fed easing will lead to a soft landing for the U.S. economy as we move into 2026. Comparing global equity flows with the U.S. VIX reveals spikes in volatility. Summer selling in 2024 was a minor event for iFlow Equity Mood flows, while selling ahead of the “Liberation Day” VIX spike was significant in March 2025. The key takeaway is that U.S. future performance must be viewed against the rest of the world for context regarding the scope for any reversal.
Forward look
There are some hurdles between a rate cut next week and the extension of equity performance into Q3 earnings, quarter-end and the risk of a government shutdown. The pushback we see against a significant counter-seasonal rally starts with a tax payment liquidity squeeze on September 15, extending to the expectations for the pace and scope of Fed easing on September 17 and pivoting on the real economy and margins. Concerns about U.S. PPI declines reflecting wholesalers eating tariffs costs make any guidance on margins key. The setting for the next month is not like April, as the scope for equities to lead all risk is less obvious than it was during the uncertainty of “Liberation Day” tariff turmoil. The VIX response to selling after April has also changed the dynamic and weaker demand for insurance reflects the confidence in policy mixes today.
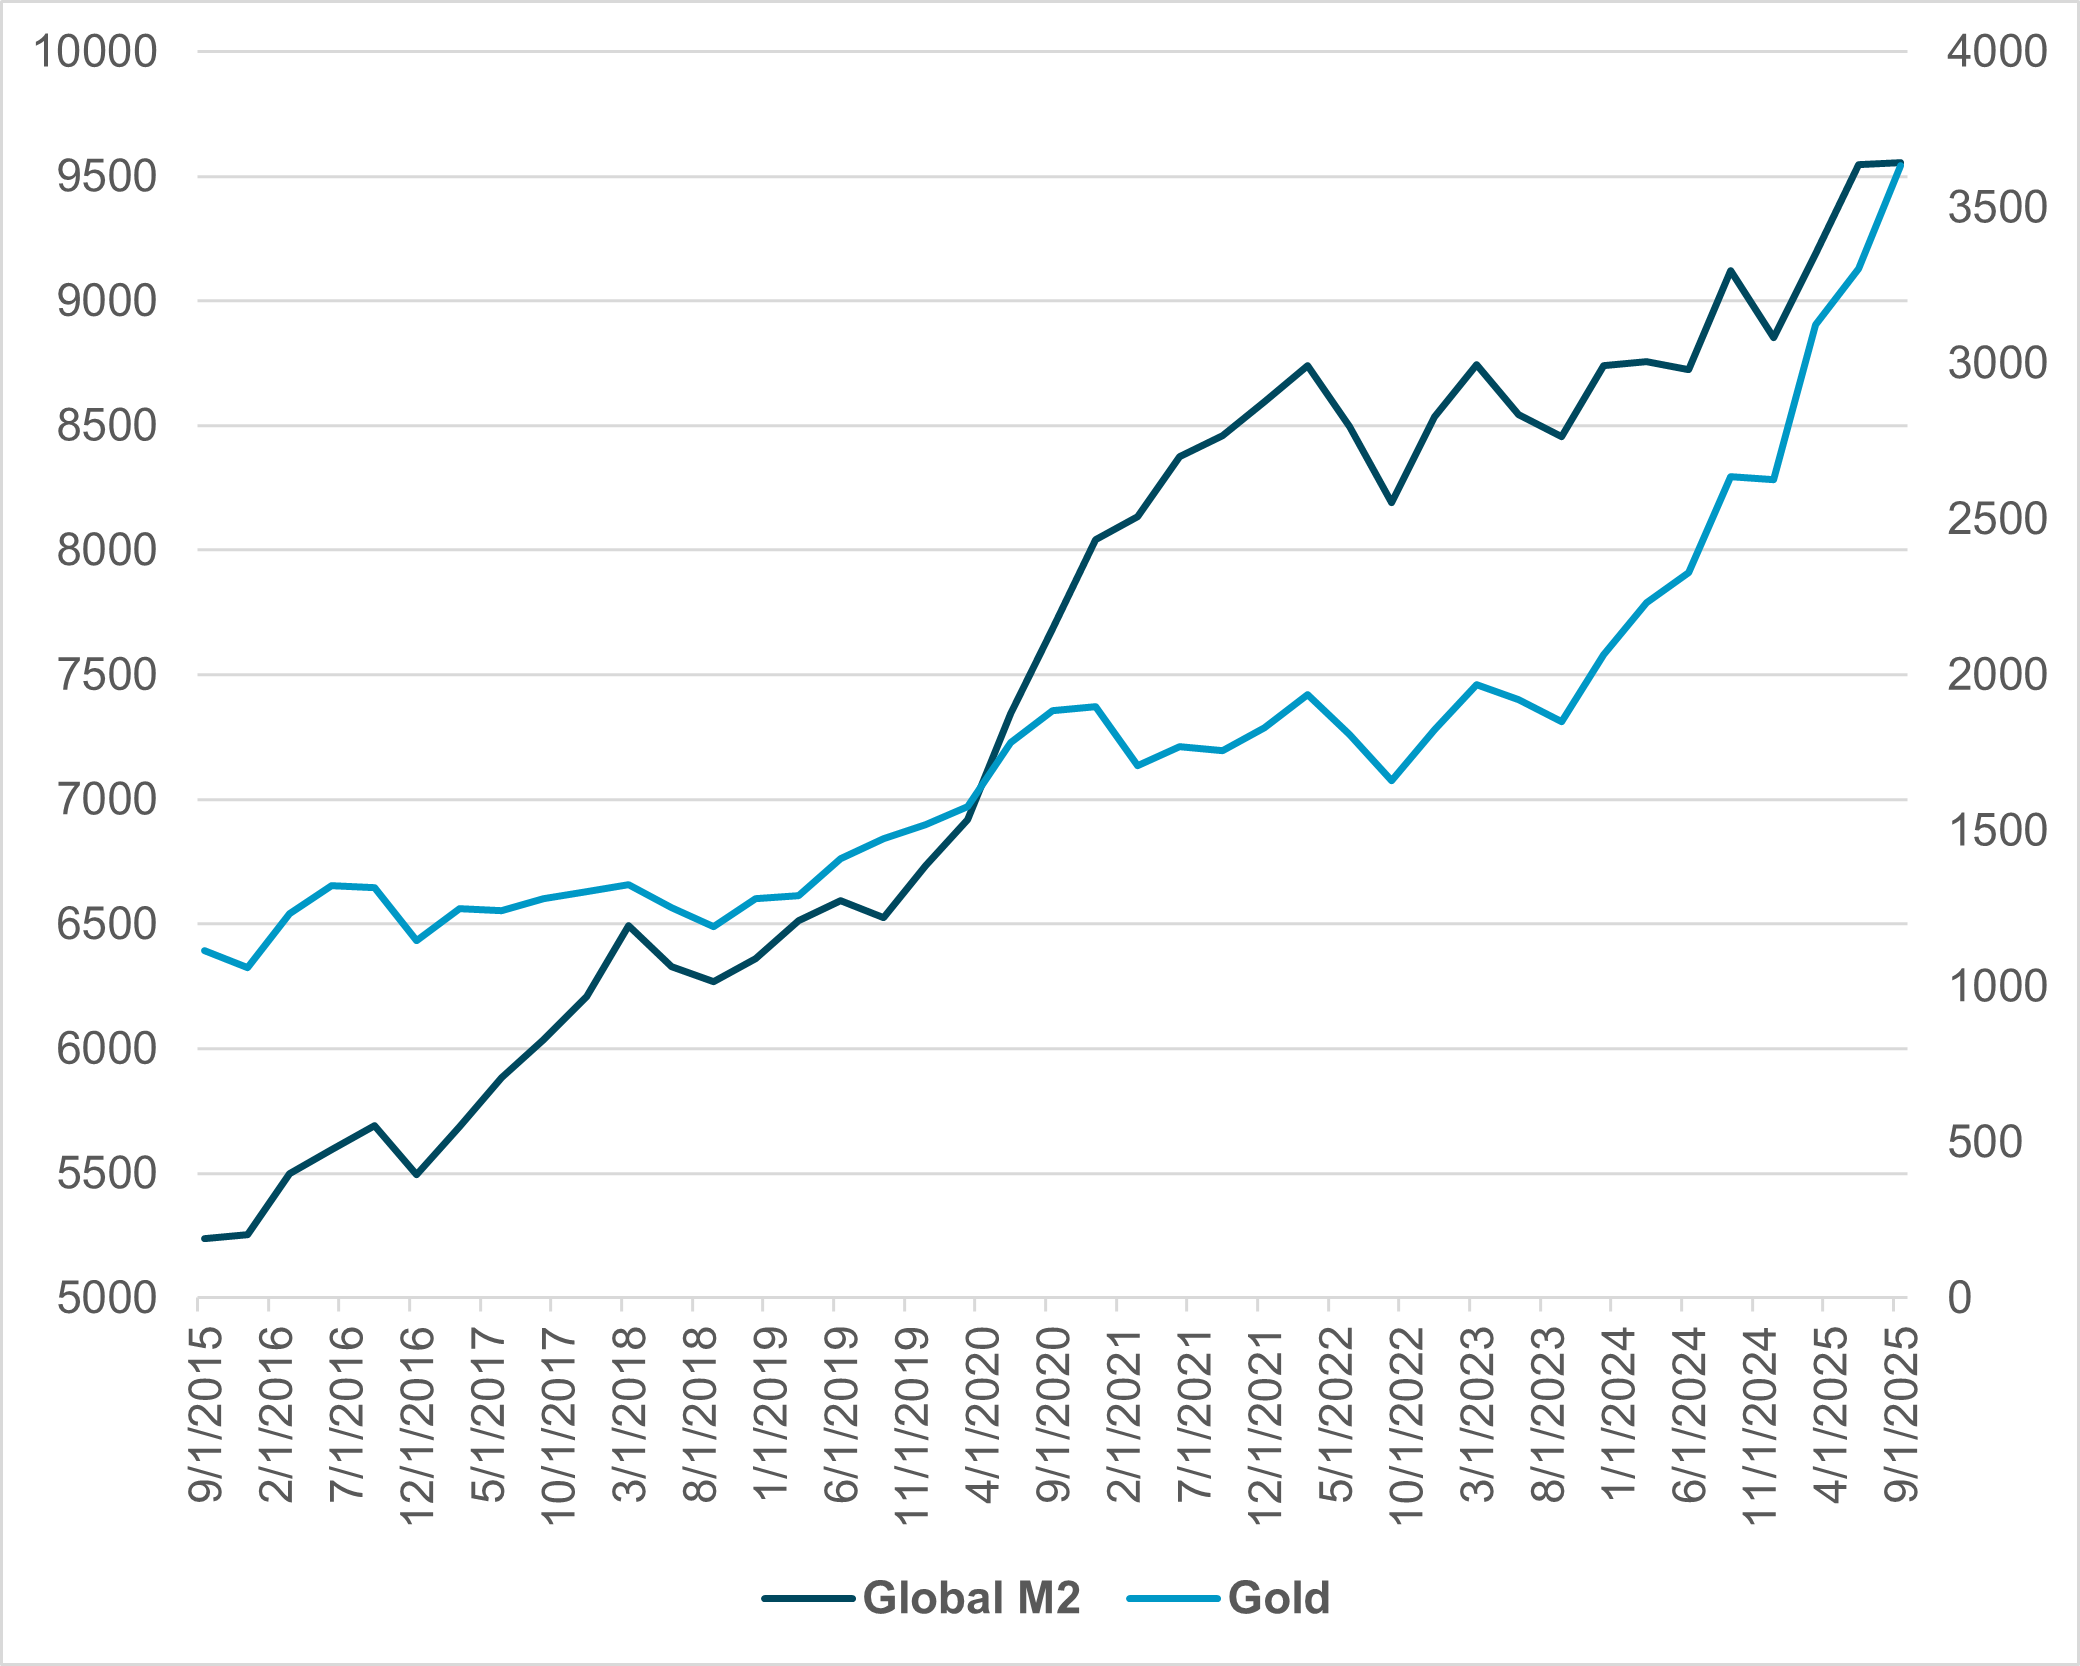
EXHIBIT #3: GLOBAL M2 AND THE PRICE OF GOLD
Source: BNY, BIS, Bloomberg
Our take
The contrast between easy credit and ample liquidity shows up most clearly in the price of gold. Gold is seen as a hedge against fiat currency debasement risks, inflation and volatility spikes. The rally in gold correlates best to the recent steepening of yield curves across developed markets. The money supply (M2) in developed markets and China has supported equity markets globally since the pandemic. Now, however, gold reflects doubts about fiscal and monetary policy ahead. A weak USD can only support the S&P 500 to a limited extent since it, too, reflects inflationary risk.
Forward look
There is an undercurrent of risk in the relationship between gold and M2. An increasing M2 supply in bad economic times is different from an increasing supply in good times. The spike in gold now reflects a number of factors. The first is doubt about duration in bonds and the long-term sustainability of debt in developed markets. Central bankers need to be able formulate extraordinary policy – from sharp rate cuts to quantitative easing – without increasing the risk of higher inflation and real rates. The question is, how much will rate cuts extend the rally in shares, generate higher margins and ease debt costs for leveraged businesses – and consumers.
In the month ahead, a Fed rate cut will be more important for U.S. equity markets than tax reform or deregulation. The “Big, Beautiful Bill” catalyzed some repositioning, but, as iFlow shows, U.S capex-sensitive sectors did not receive a strong, continuous allocation surge. This makes us cautiously optimistic about U.S. reindustrialization. However, iFlow signals only show incremental conviction, with no clear “crowded” trade. Top U.S. IT names (NVDA, AVGO, MSFT, ORCL) continue to exhibit robust trailing 12-month performance (with AVGO +150% y/y and NVDA +94% y/y), albeit with some normalization in Q3 price performance.
Foreign investors are driving a relative overweight into U.S. IT, with supportive (though less forceful) positioning in Industrials and Materials, and apathy toward Energy. Whether this mix works in the months ahead will depend on the success of Fed easing supporting a soft landing in 2026 and the rest of the world seeing ongoing easy liquidity.