Leadership and Melt-Ups
Equities provides an in-depth look each Friday at the factors shaping equities markets in developed and emerging economies around the world.
Equities provides an in-depth look each Friday at the factors shaping equities markets in developed and emerging economies around the world.

Bob Savage
Time to Read: 6 minutes
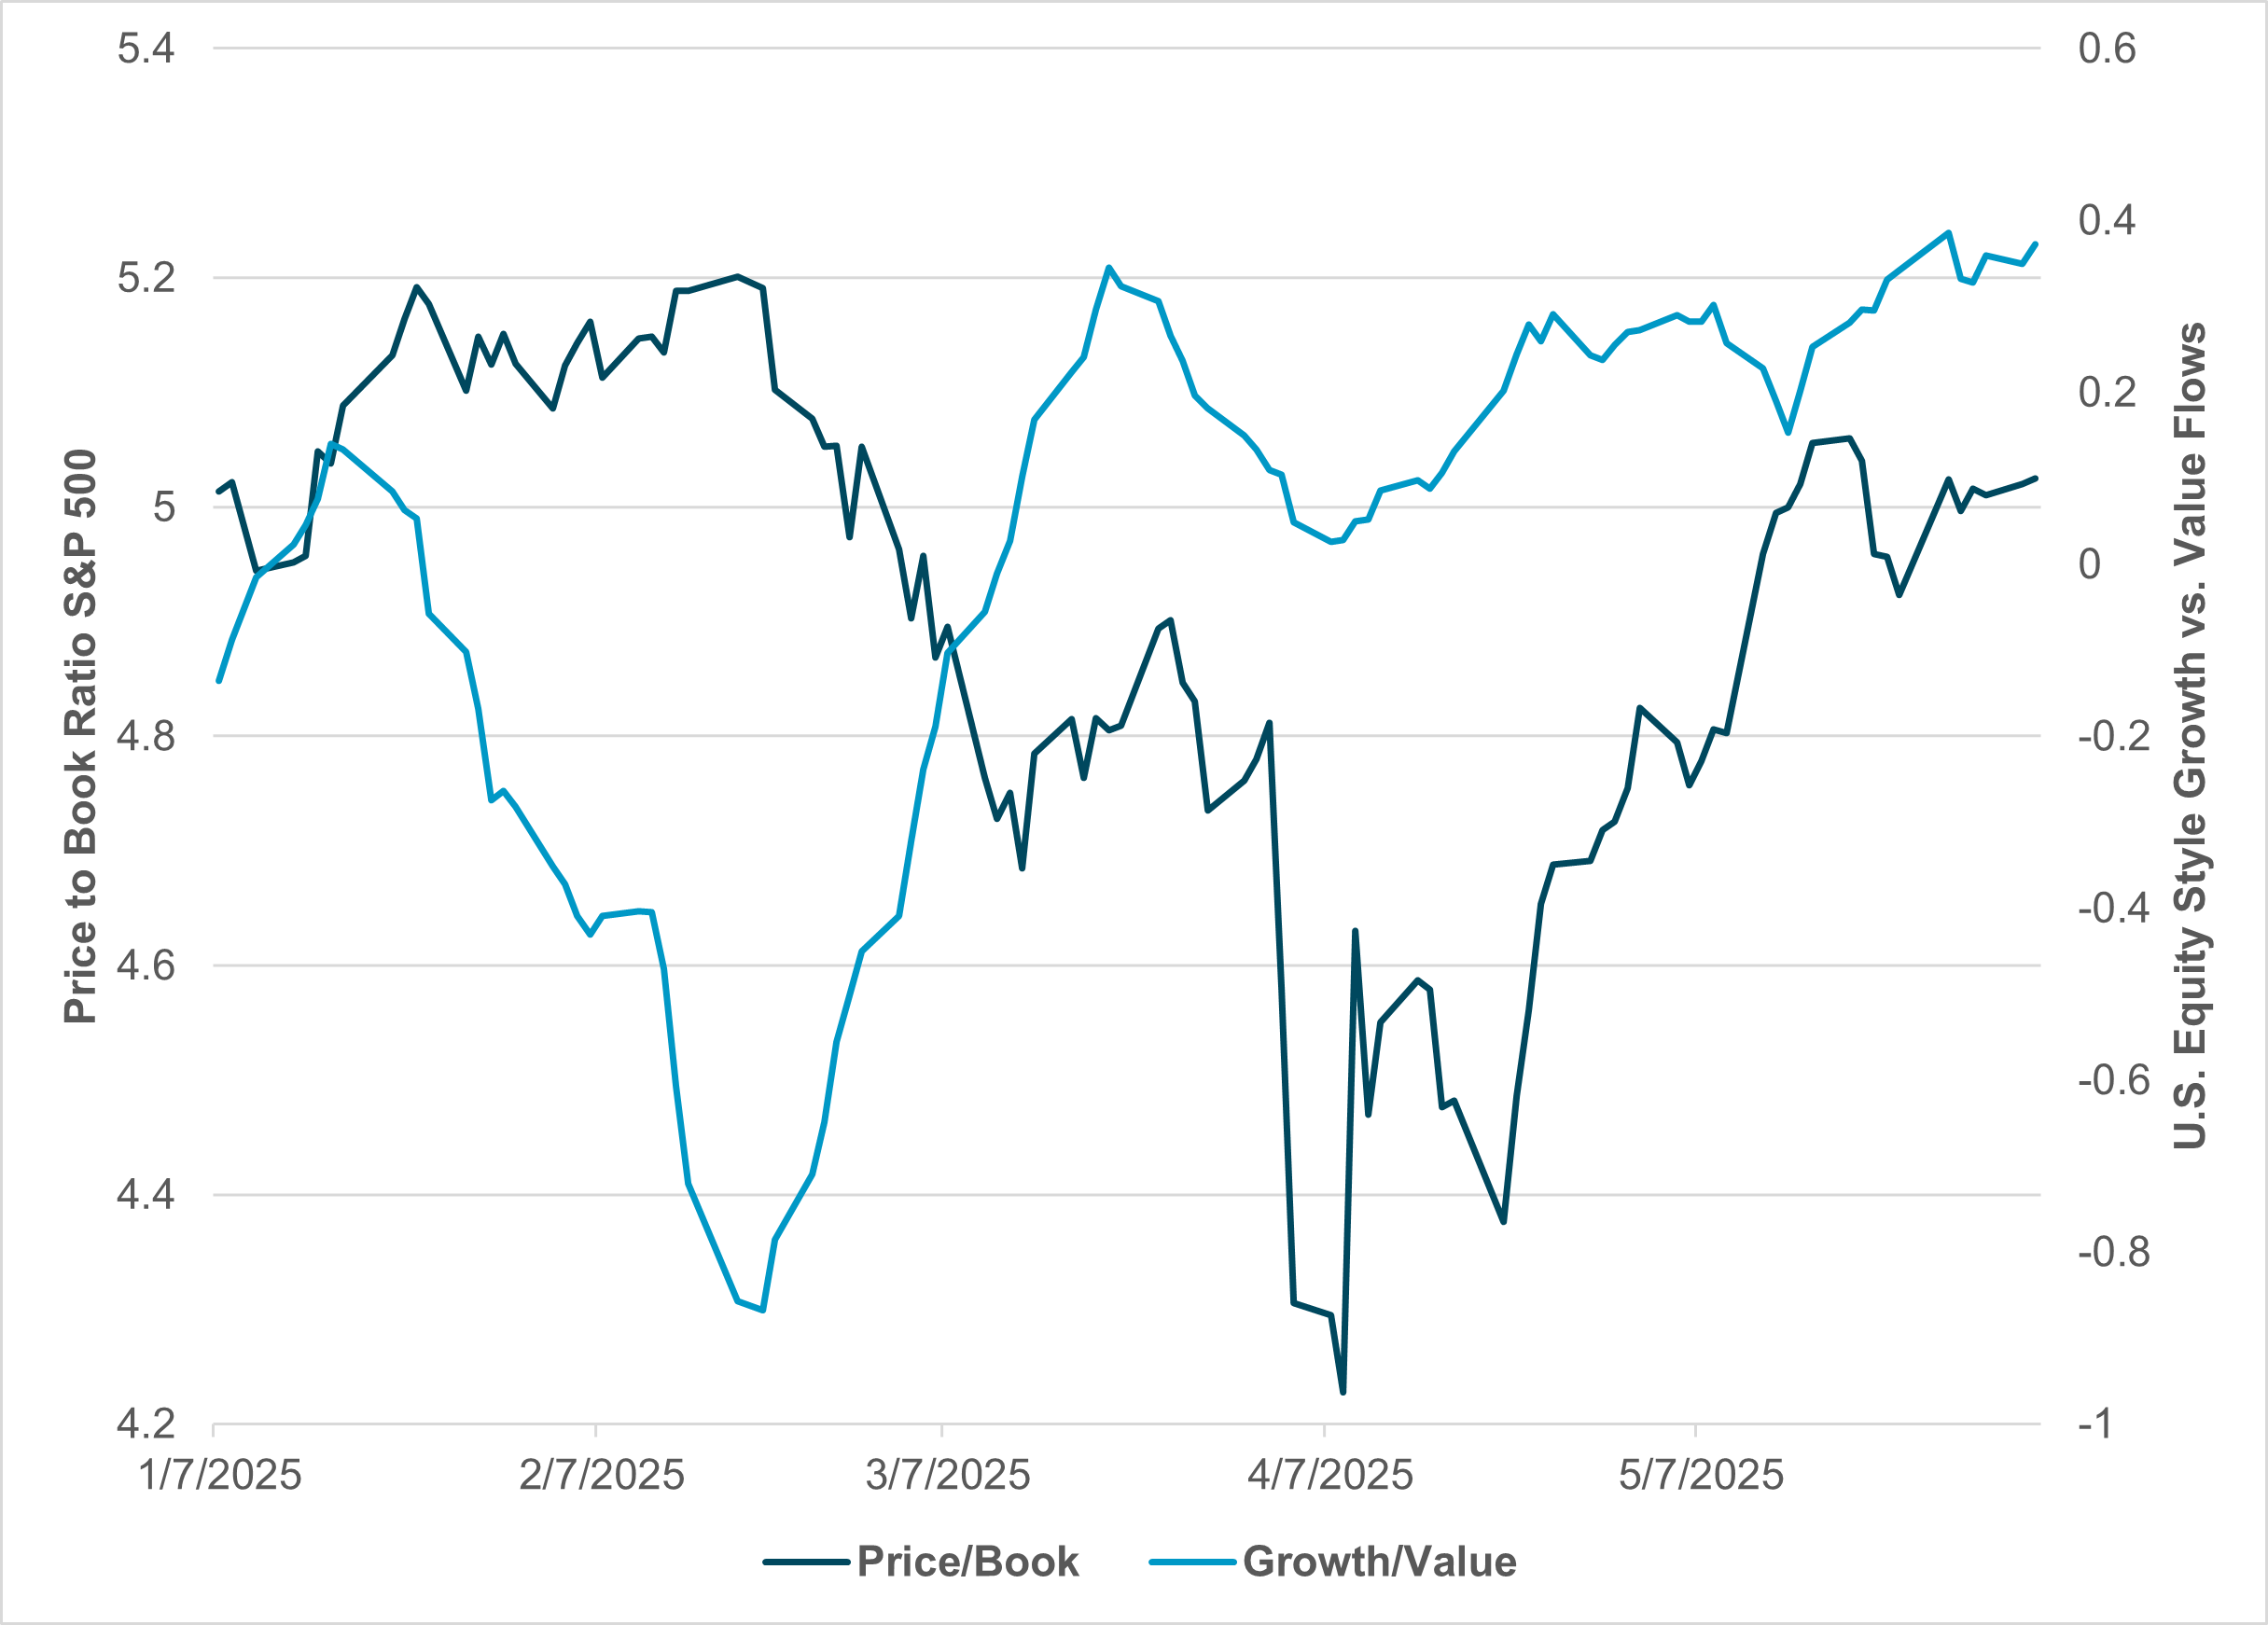
EXHIBIT #1: GROWTH AND VALUE VS. S&P 500 SECTOR FLOWS
Source: BNY, Bloomberg
Concerns about value and growth continue to swirl around equities globally and the U.S., in particular. One way of determining the value of equities is Tobin’s Q ratio, where Q is a company’s market value divided by the cost to replace its assets. In many models, book value calculations are used as the replacement cost. Using Tobin’s formula as a guide to value, we can see that April selling tested a ratio of 4, while it was near 2 during the start of the Covid-19 pandemic and 1.5 during the global financial crisis. A high of around 5 was recorded in 1999, 2021, December 2024 – and now. Growth beat value factors in the U.S., notably in February, but not in April. The current set of U.S. financial conditions – higher equities prices, a weaker USD and high cash holdings (20% or more) – are driving a return to risk. Furthermore, ongoing passive flows buying back U.S. assets mean correlations across markets are positive. The light switch for risk-on is boosting capital expenditure plans, particularly in IT, helping markets return to a secular AI boom narrative.
Our take
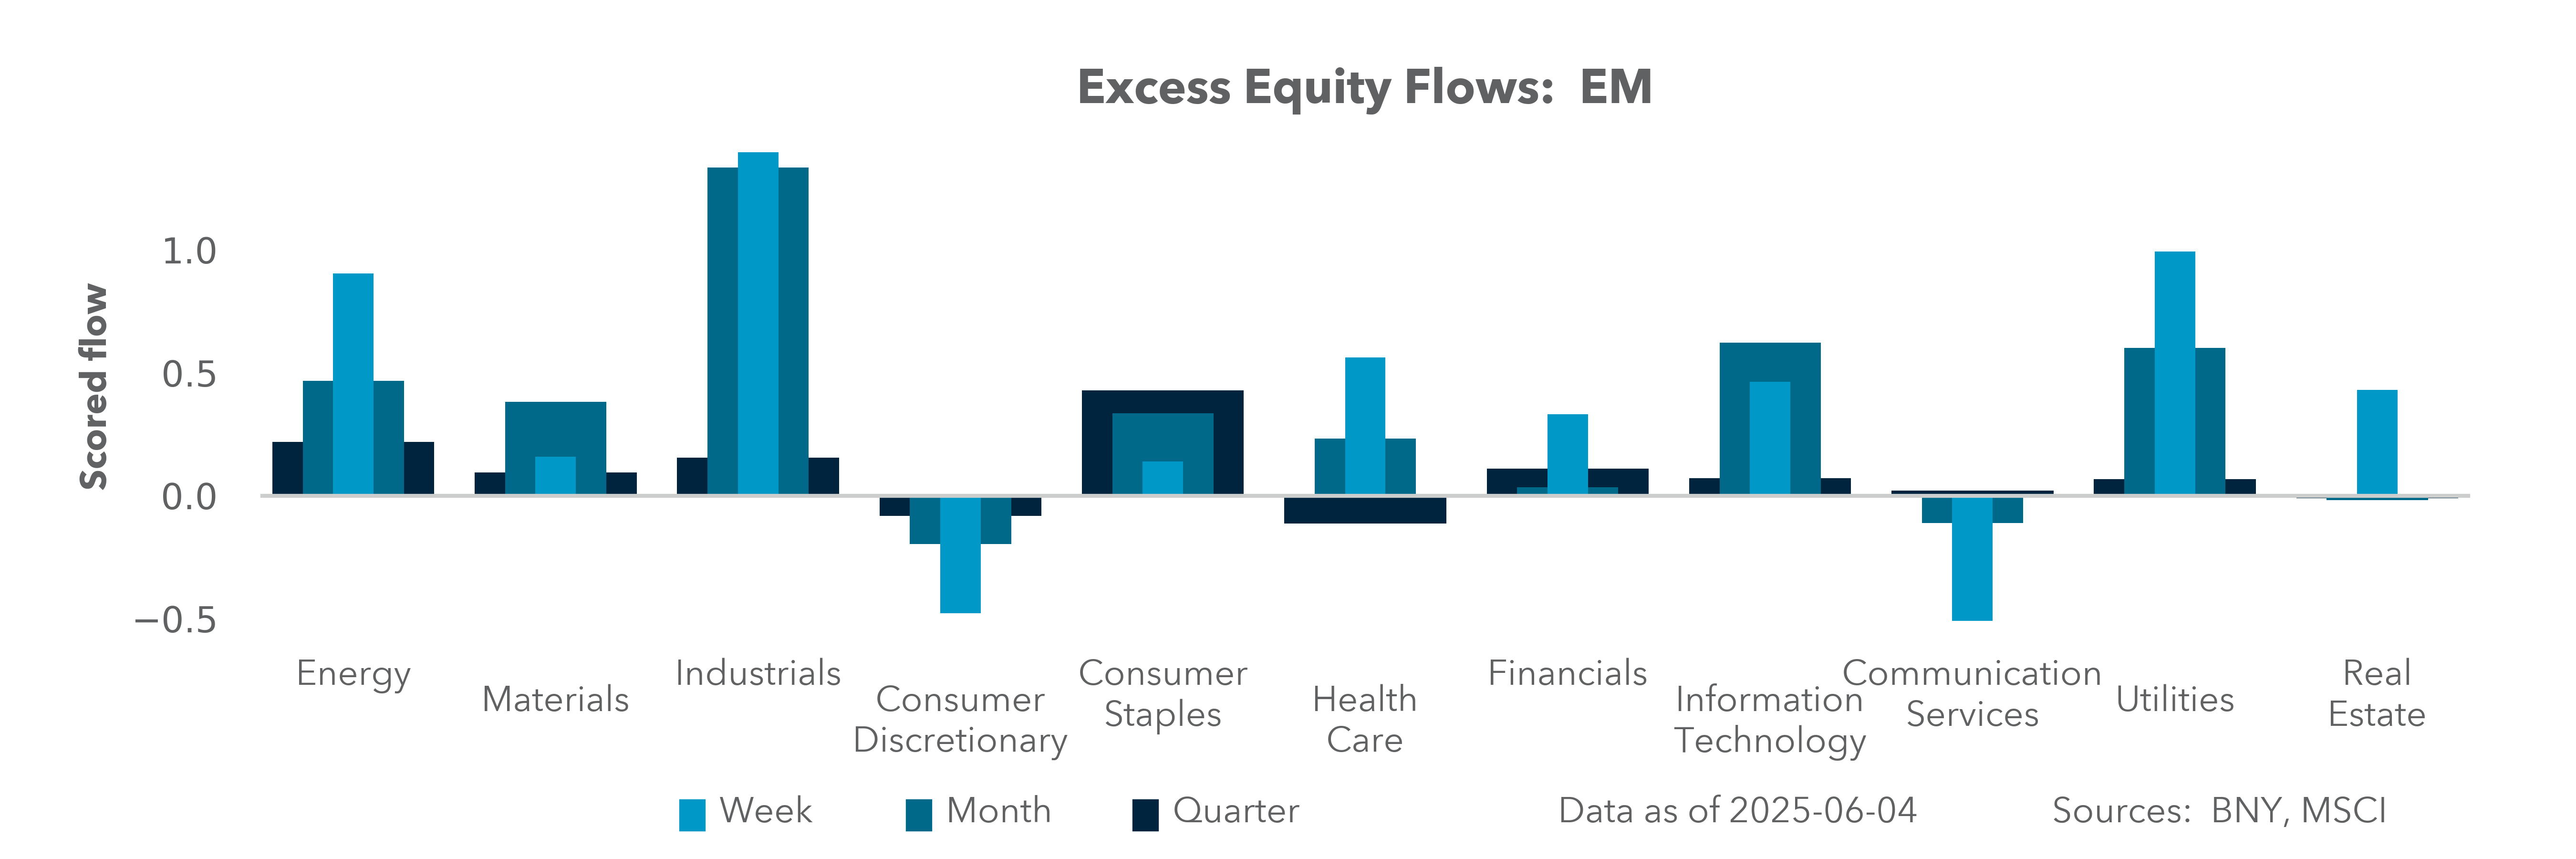
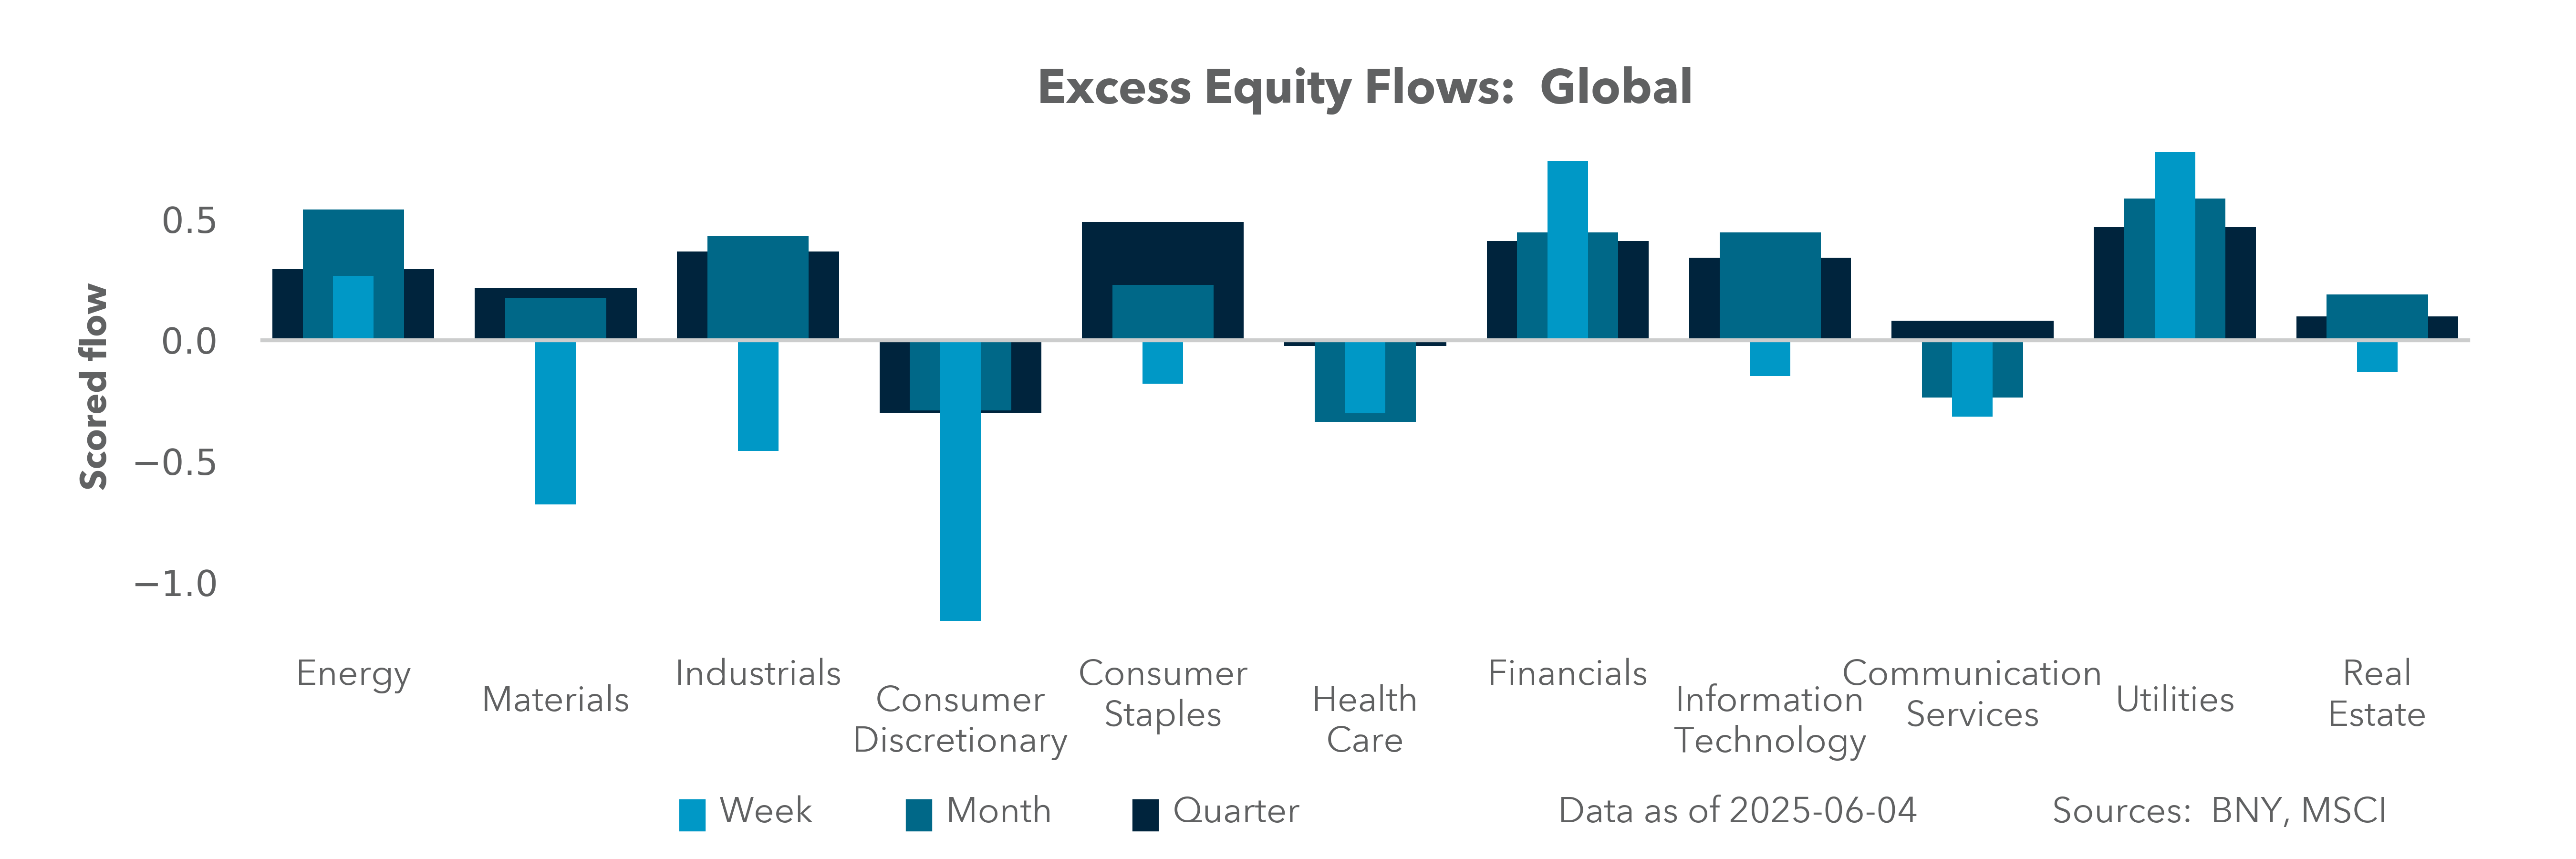
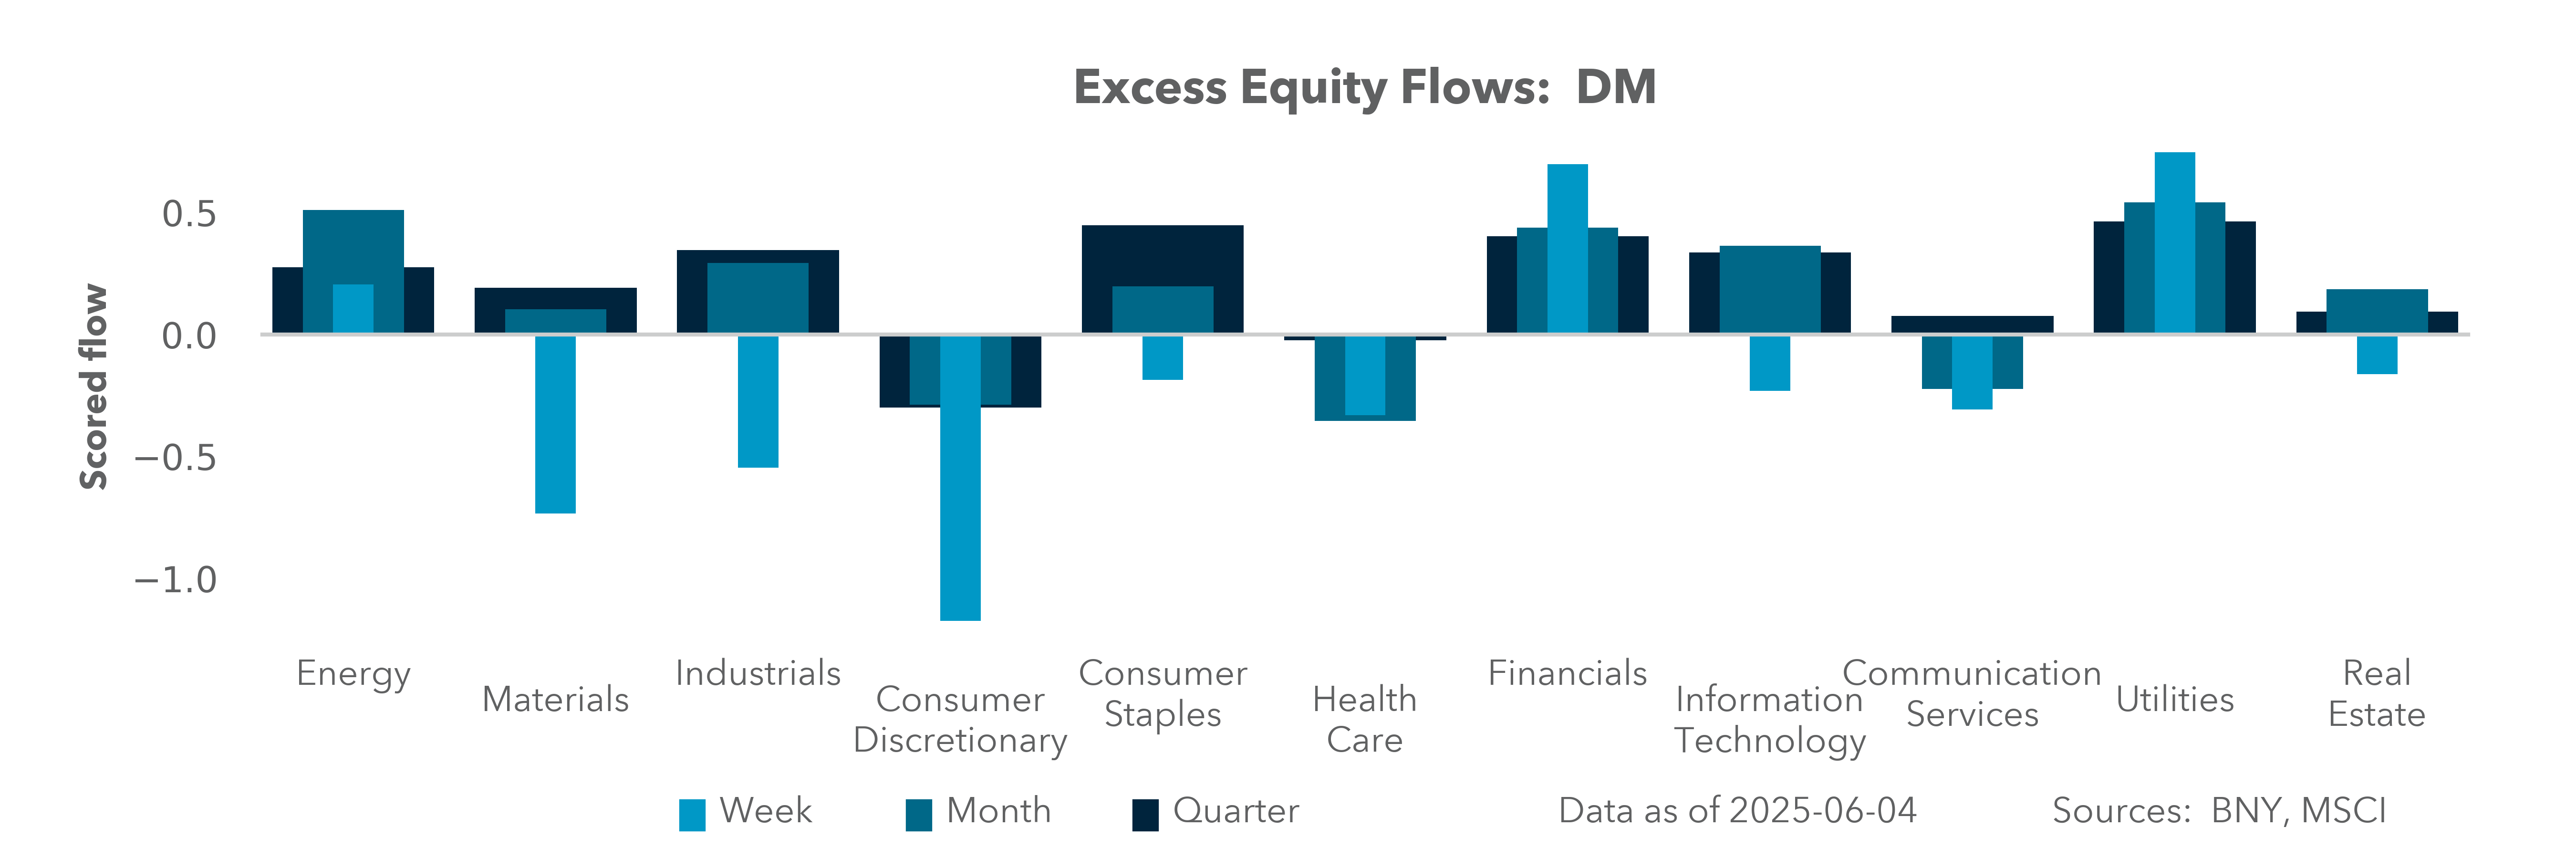
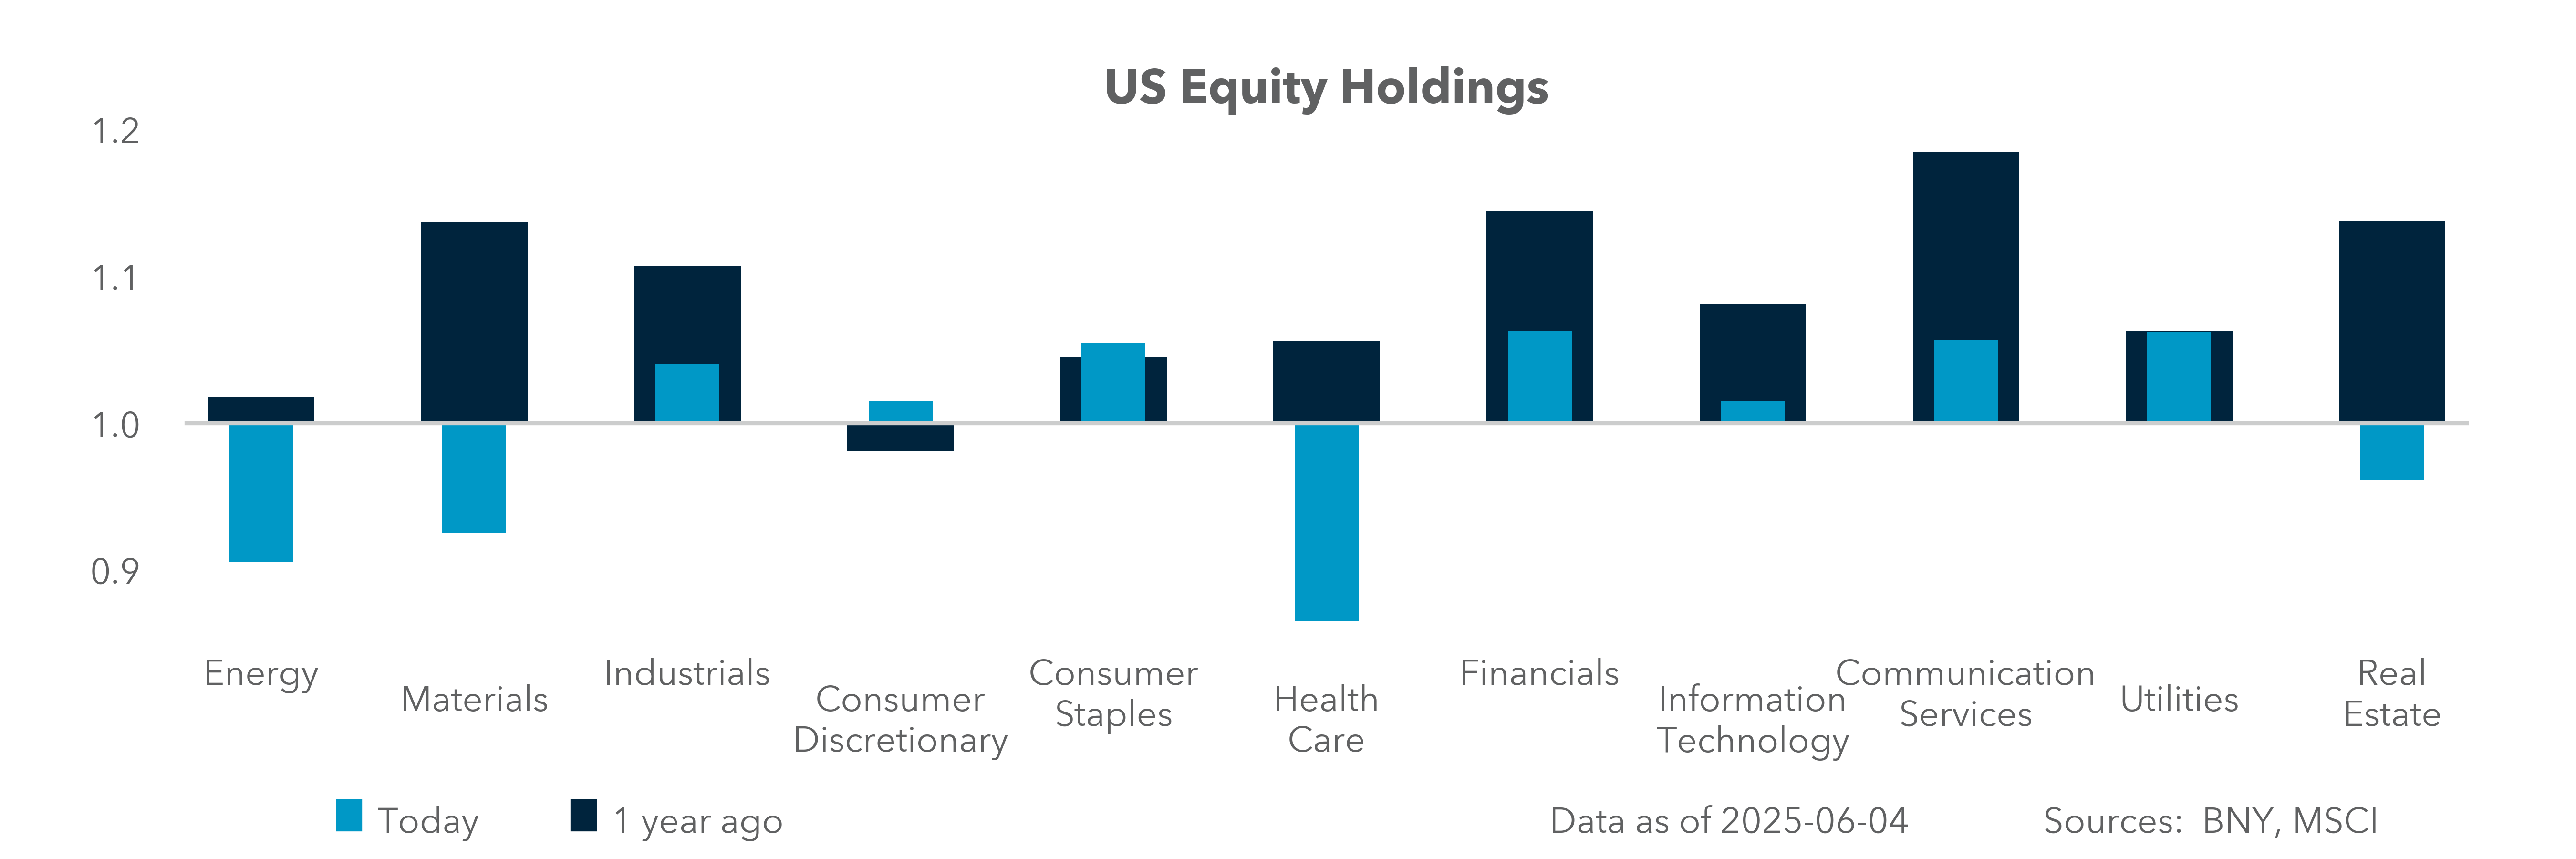
Since the start of the year, we have seen a notable shift in how investors view value and growth. As U.S. tariff policy was implemented, our flows ran to value over growth, but in April they returned to growth over value. In the last week, S&P 500 flows have highlighted confusion over conviction. The Utilities sector saw strong inflows, and are now in the 94% percentile, a strong sign of a defensive trading rotation, as cyclical sectors like Industrials and Materials dropped to the 40% percentile, while growth/tech are neutral at around 50%. Holdings in the S&P 500 have been reduced on a q/q and y/y basis, with Energy the leader at -8.7% q/q, followed by Health Care (-10.3%) and Real Estate (-11.9%). By contrast, Utilities are almost flat, while Consumer Discretionary is off 3.2% q/q but up 3.8% y/y. Flows and holdings suggest our clients are aligning to a late-cycle, lower-growth environment, as defensive and quality sectors attract risk-off inflows, while pro-cyclical sectors remain out of favor or structurally underweight. This is in contrast to the overall market where risk-on dominates, with financial conditions, hopes for Fed easing, and more fiscal support from Washington and other developed countries pushing the melt-up in equites globally. The MSCI all-country world index reached a new record high this week.
Forward look
Sector leadership will hinge on upcoming Fed communications, jobs data, CPI/PCE prints and the Q2 earnings season. Upside catalysts for cyclicals could emerge from a dovish policy pivot or positive earnings surprises, while downside risks are still wrapped up in tariff talk outcomes. We are in a market where the long-awaited convergence of hard data and soft data could support risk in equities, as the outlook for growth shifts back to a bumpy landing view, with Fed rate cuts and easier conditions from other policies offsetting tariff concerns.
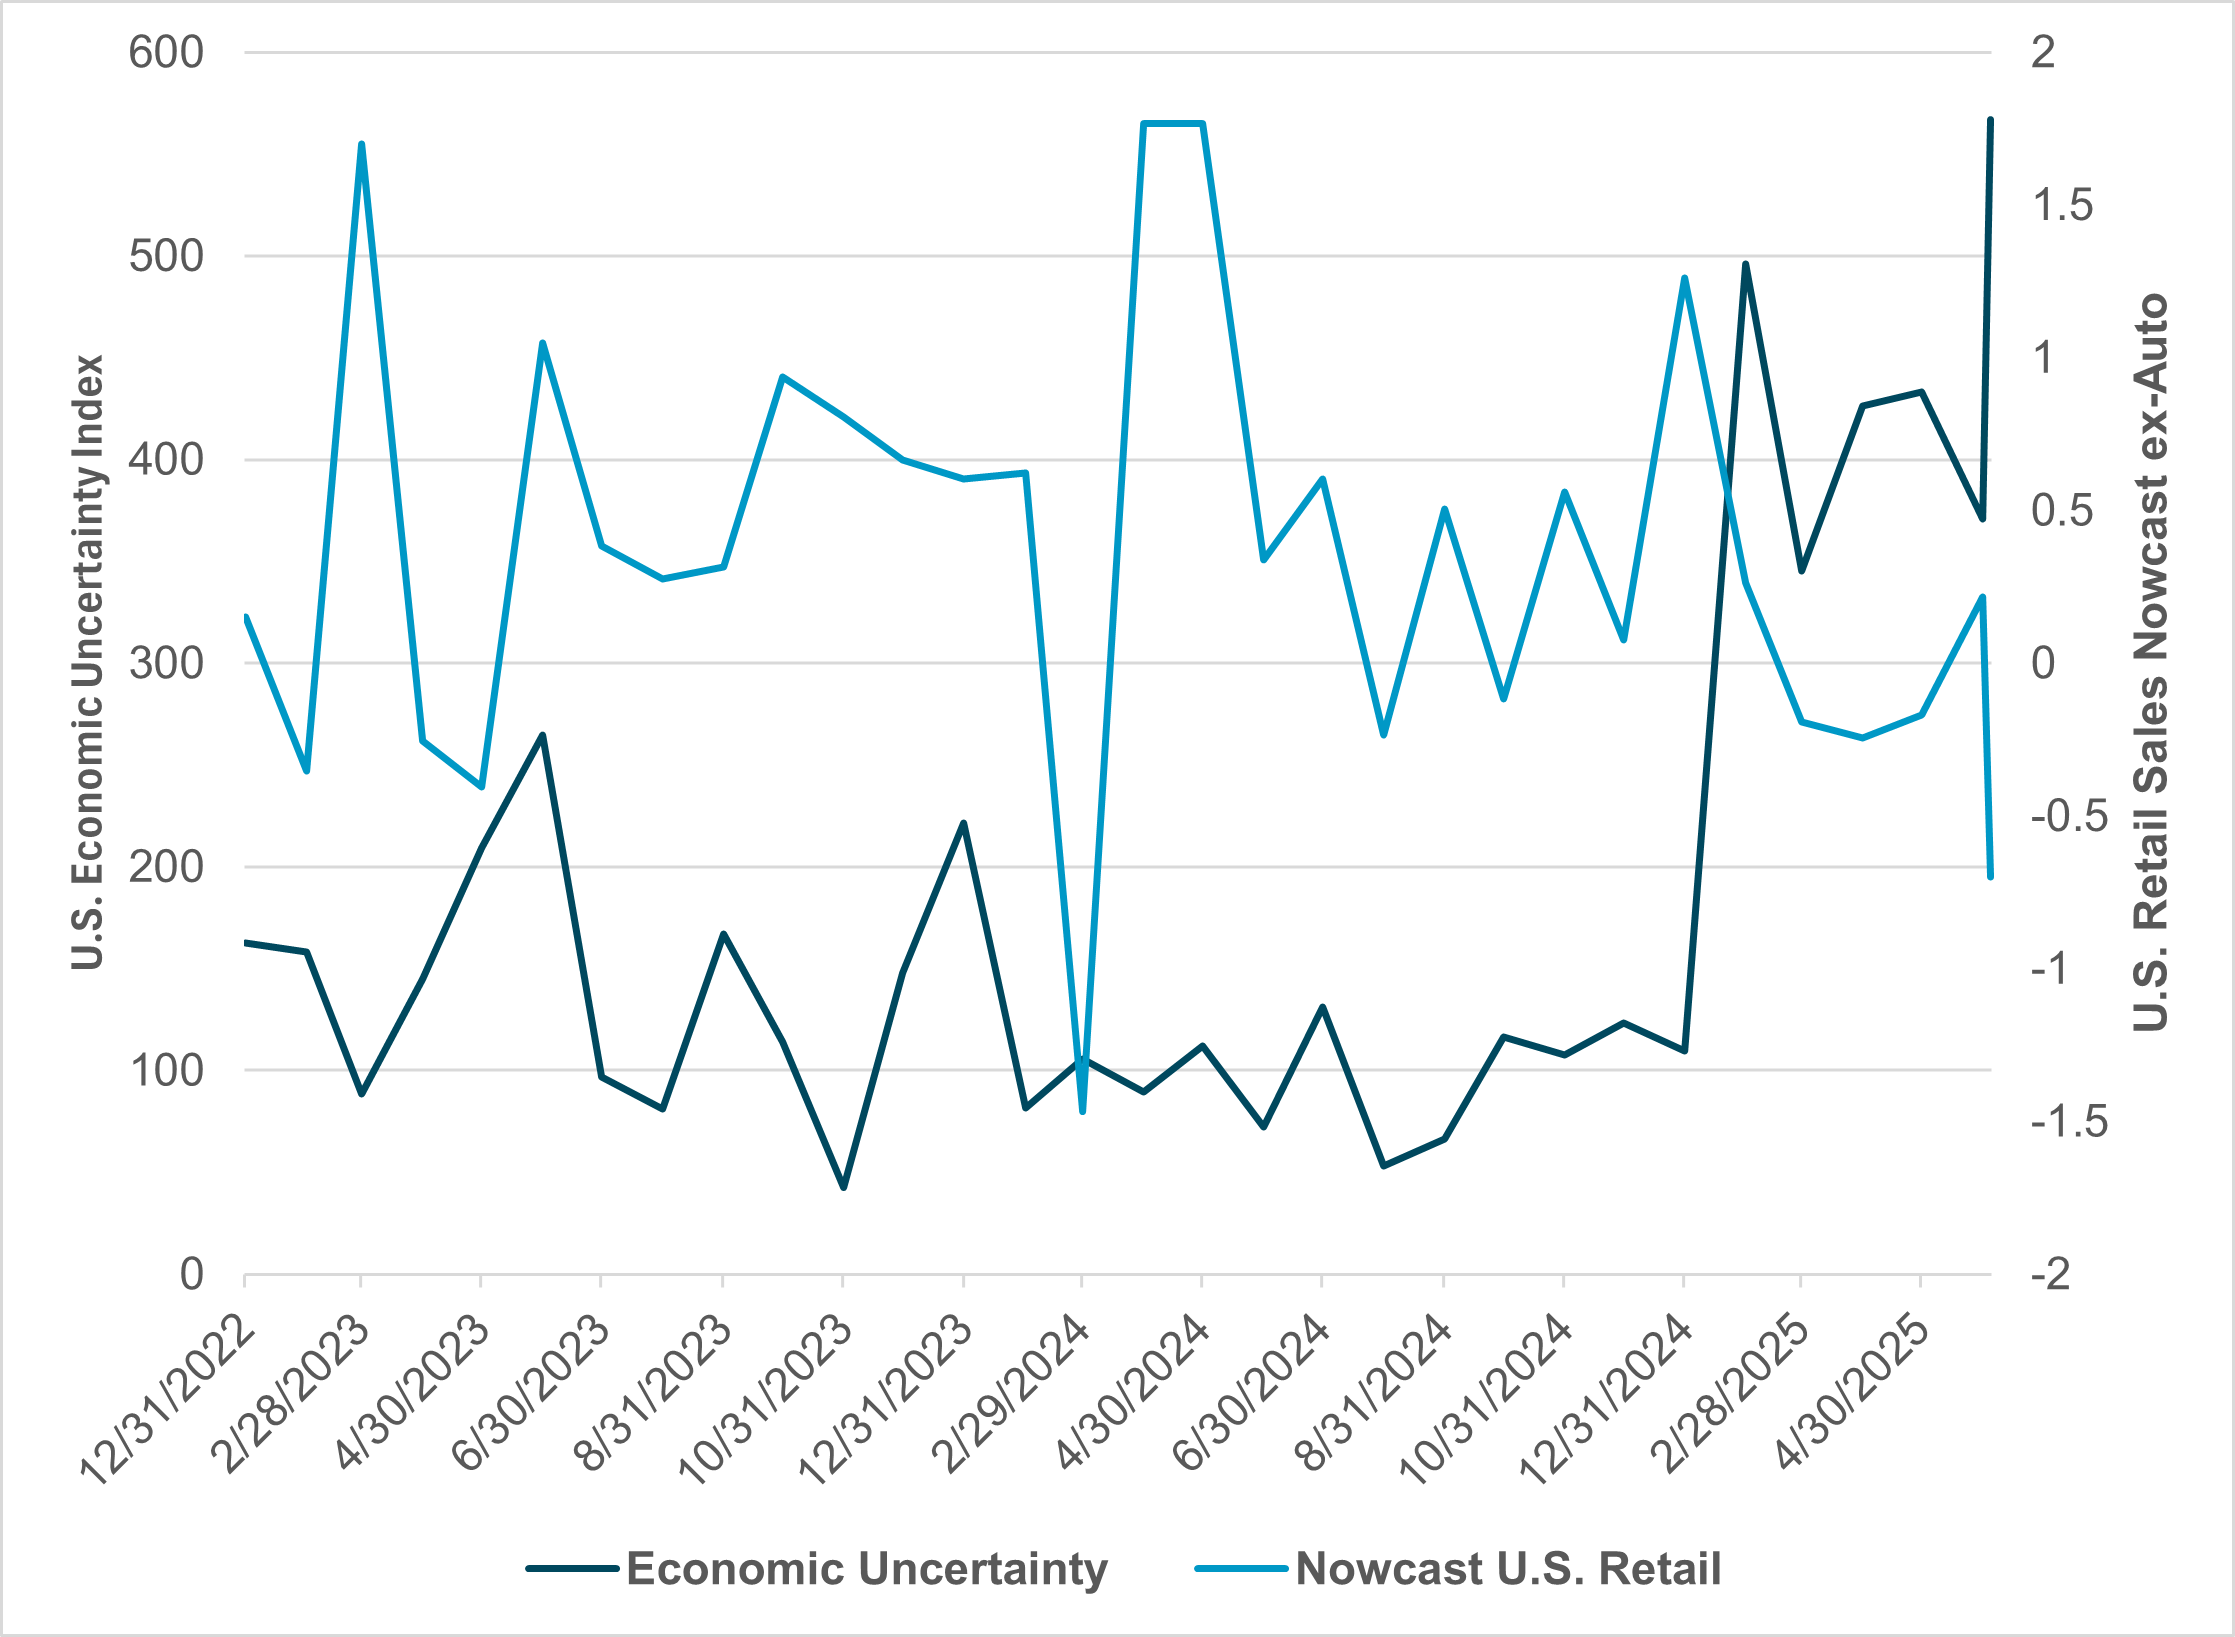
EXHIBIT #2: U.S. RETAIL SALES NOWCAST VS. U.S. ECONOMIC UNCERTAINTY
Source: BNY, Bloomberg
Our take
Earnings calls by S&P 500 CEOs mentioned “tariffs” or broad uncertainty more than “recession” by a factor of ten to one during the Q1 earnings season. CEOs fear planning risk more than losing sales in the months ahead. Tariff noise is leading to a “delay rather than delete” stance on plans for expansion. Growth in the months ahead will depend more on rates than a tariff pause. Several CFOs in Q1 told analysts that they would “reactivate” projects with 75-100bp in rate relief. Growth rebounds are still part of H2 2025 outlooks for many in equities, even as bond prices shift yields higher. The chart in Exhibit #2 shows U.S. consumer spending compared to economic certainty, suggesting that CEOs may be too sanguine. There is a clear lag between uncertainty and spending decreases – usually of a quarter or more, with the risk for Q3 clearly to the downside should this trend continue. Faith that the FOMC will respond to a real economic slowdown may be another factor in current corporate thinking.
Forward look
The best case for growth rests on certainty. Clear tariff and monetary policies would force money to work across markets. Current holdings of U.S. assets look light compared to the overall global indices, reflecting a split between U.S. and cross-border investors. The risk of further melt-ups will be reduced by positioning and volatility. The market’s dependence on growth outperforming value may be the key risk to watch as we head into the end of Q2 in June, as outlooks will likely shift with the July FOMC meeting, elections in Japan and the end of the pause on Trump’s reciprocal tariffs.
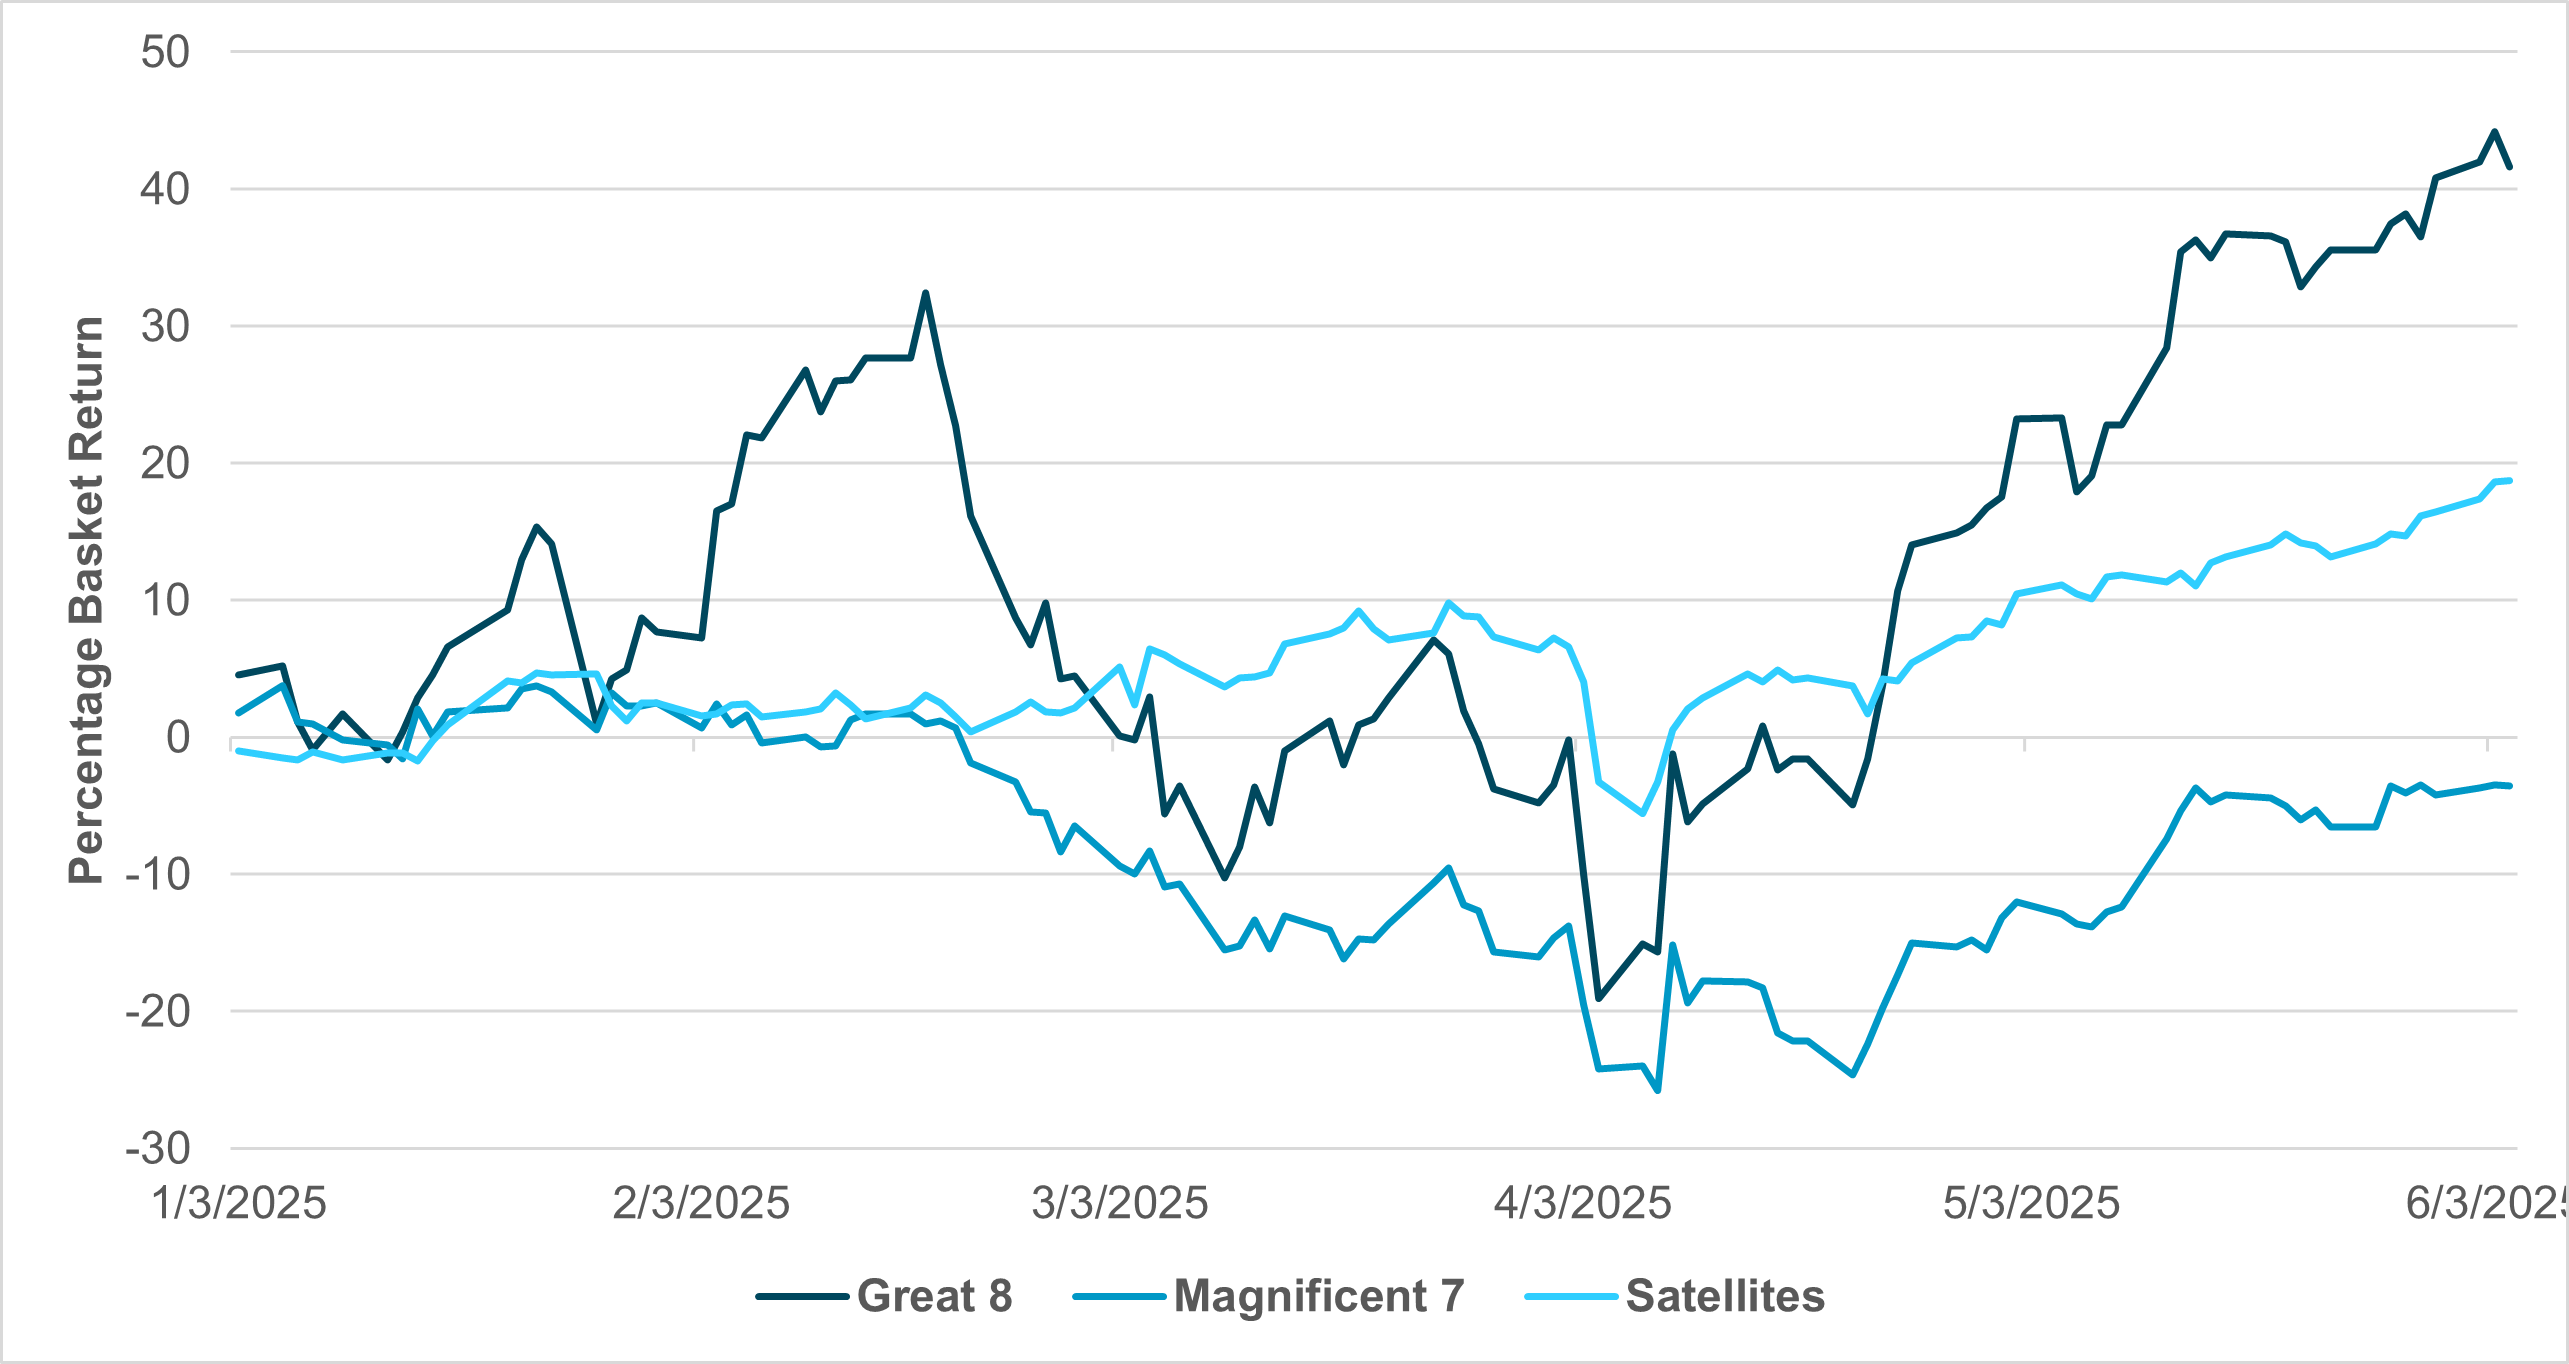
EXHIBIT #3: COMPARING THE MAGNIFICENT 7, GREAT 8 AND SATELLITES
Source: BNY, Bloomberg
Our take
Looking at the returns in 2025 compared to the commentary around U.S. policy shifts masks the underlying moves that are in play as investors are clearly diversifying risks. From April 21 to now, technology has seen an uptick, but how can we determine the leading subset of that sector? The answer, as we noted two weeks ago, is to chase outperformance with the Great 8 index, composed of CEG, DELL, GEEV, MCHP, NRG, PLTR, STX and WDC. Last fall, we highlighted the focus on satellites and how important they would be in 2025 and beyond. The push for alternatives to Starlink has led to a series of EU initiatives on defense and other cyber security spending plans. The $3.1bn SES-Intelsat merger deal makes it clear that the industry group is moving quickly above the $500bn ceiling estimates. We created a satellite operators index, comprised of BA, AIR, LMT, NOC, HO and OHB, representing a mix of EU and U.S. companies that compete with Elon Musk’s Starlink and SpaceX. This index has been a steady performer in 2025 and reached a new high after April. The press, by contrast, has focused on the Magnificent 7 (META, MSFT, AMZN, GOOGL, TSLA, NVDA and AAPL) and the big hyperscalers for AI. While these companies have recovered from their 38% drop in April, the basket remains down on the year and well below its 2024 highs.
Forward look
While investors have been focused on volatility and uncertainty in 2025, the summer months ahead have the potential to ease these concerns and replace them with growth as the key driver for longer-term investments. The volatility in April as a result of “Liberation Day” has left the Information Technology sector in a dominant position despite diversification pressures from Financials, Utilities and Consumer Staples. The future investment push in technology is about more than just AI and includes robotics, quantum computing and space investments. The common theme behind these stories is the ongoing defense spending by the U.S. and EU, with a renewed push for national industrialization policies globally and the search for productivity in a world still watching demographics. In our data, the push for more tech investment shows up in our holdings, with the Utilities, Industrials, and Communications sectors overheld against the 10-year average, while IT is still underheld and Energy, Materials, Health Care and Real Estate are 3-8% below the long-term average. Should we see a prolonged summer melt-up, sector leadership could shift quickly.
The bifurcation between growth and value continues to dominate equity markets, with Tobin’s Q ratio showing current valuations near historic highs. If we continue to see hard data converge with soft data at weak growth levels, then further risk reversals could follow. The hope for growth and positioning around it leaves the role of Fed easing even more critical to stabilization in any new downturn in risk. This environment has reignited the secular AI growth narrative, though sector flows indicate mixed investor conviction. Sector leadership will hinge on upcoming Fed communications, jobs data, inflation prints and Q2 earnings, with the July FOMC meeting, Japanese election and a pause on Trump’s reciprocal tariffs serving as critical catalysts for more volatility.