Flows Shift as MSCI Reshapes Risk
iFlow > Equities
An in-depth look each Friday at the factors shaping equities markets in developed and emerging economies around the world.
iFlow > Equities
An in-depth look each Friday at the factors shaping equities markets in developed and emerging economies around the world.

Bob Savage
Time to Read: 4 minutes
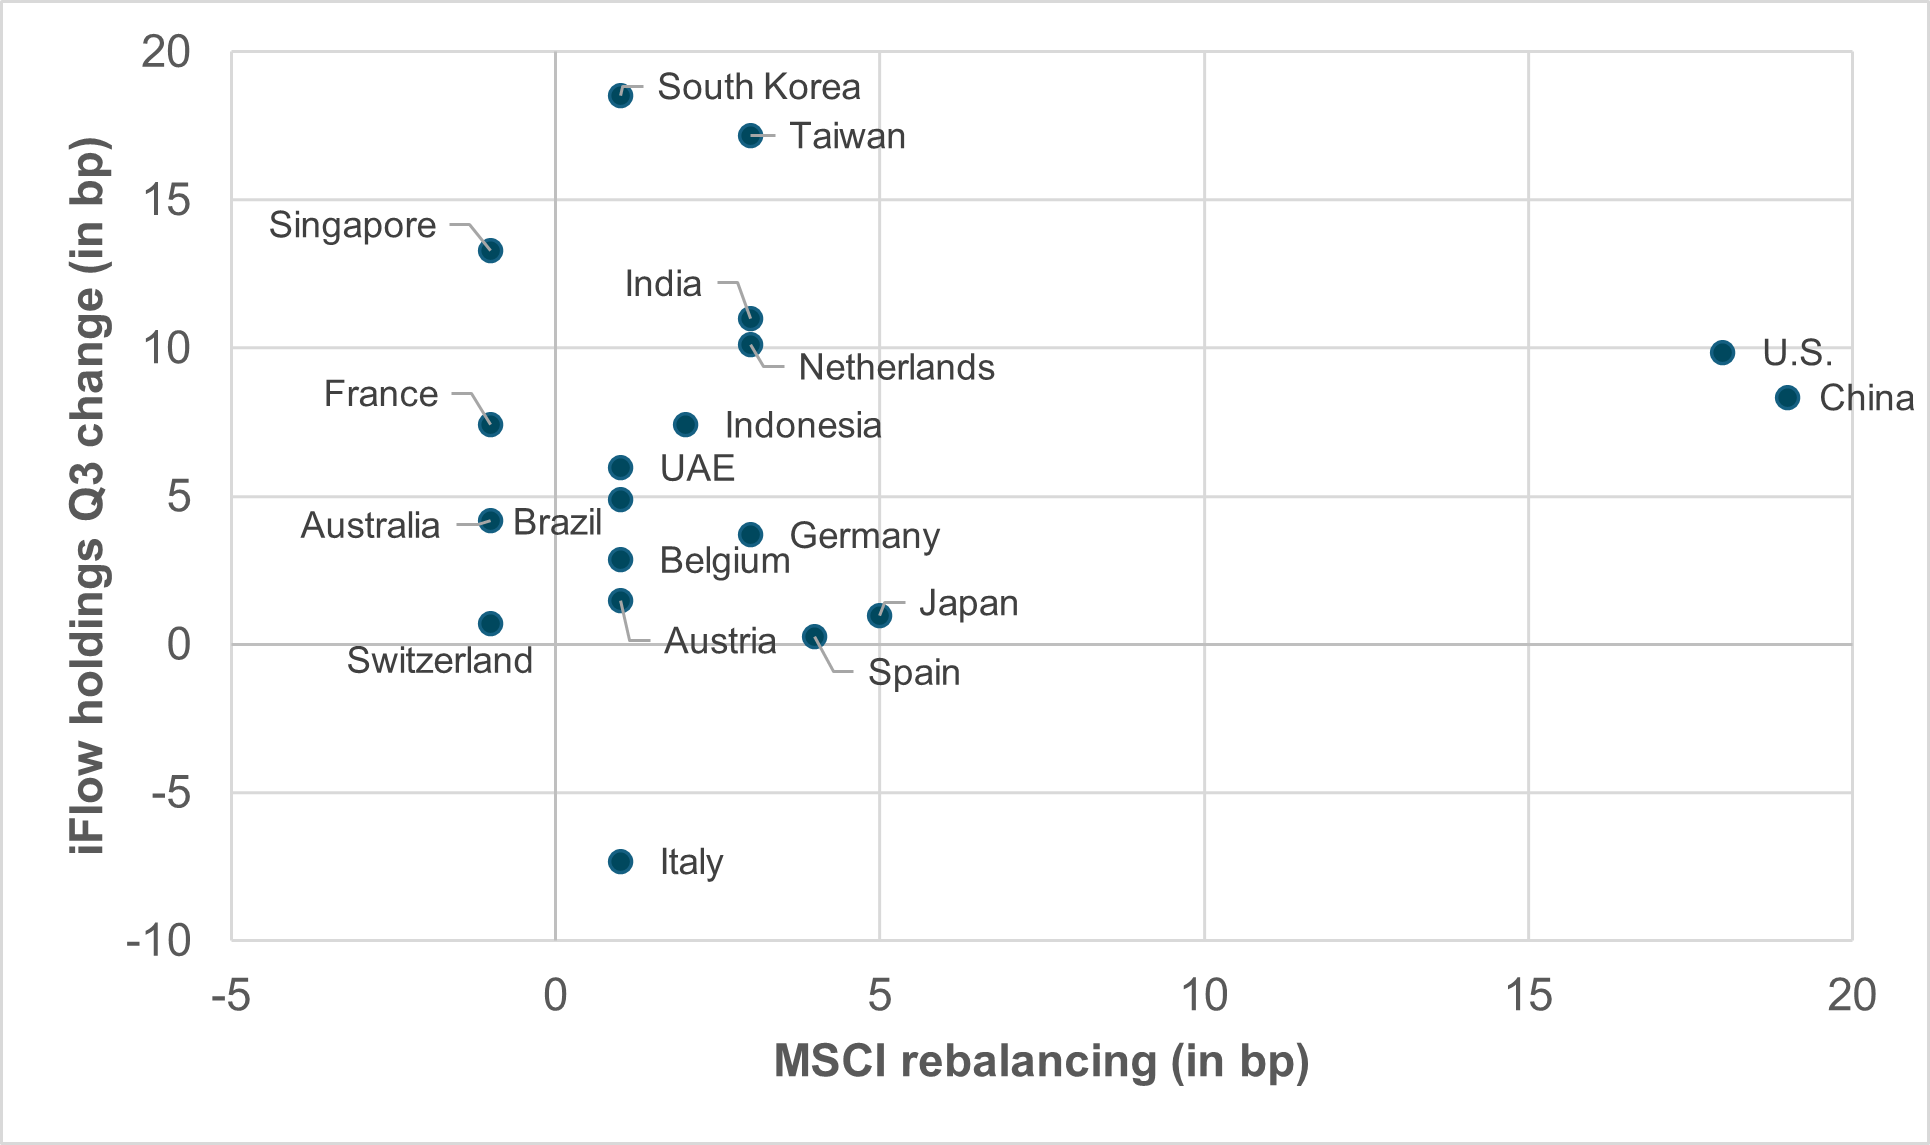
EXHIBIT #1: MSCI REWEIGHTING BY COUNTRY VS. IFLOW HOLDING CHANGE FROM Q3
Source: MSCI, BNY, Bloomberg
Thanksgiving in the U.S. beckons investors to reconsider their progress as humble pilgrims seeking value and stability amid a bountiful harvest of 2025 equity returns.
The equity event of the week was Nvidia’s earnings release. The good news was offset by hawkish Federal Reserve minutes, which lowered the odds of a December easing, and by a surprising rise in the September unemployment rate.
Tech owners have become true believers, with earnings the key, while credit risks and interlinked ownership structures keep the bears from hibernating. IT sector rotation continues beyond the U.S. as positioning looks stretched in emerging markets (EM).
The upcoming MSCI Equity Index quarterly review and the usual month-end squeeze for cash will be key factors, as investors reset expectations for a bigger equity rally into year end. The global equity sector rotation carries a national component risk, with U.S. and China shares appearing underheld relative to the rest of the world.
Next week may bring some holiday-induced calm after the MSCI flows, but the bigger impact may be on how credit responds to the cash needs and renewed focus on consumer spending.
Our take
The three largest additions to the MSCI World Index, measured by market capitalization, will be CoreWeave A (U.S.), Nebius Group A (Netherlands) and Insmed (U.S.). The three largest additions to the MSCI Emerging Markets Index will be Barito Renewables Energy (Indonesia), Zijin Gold International (China) and GF Securities Co H (China).
Overall, the MSCI ACWI Investable Market Index will see 199 names added and 224 names cut. The net effect is a 62bp increase in market cap, adding $620bn to bring the index total near $101tn. The global equity rally in risk stalled in October and reversed in November. As shown in Exhibit #1, investors have been building long positions in Korea, Taiwan and India, but the MSCI reweighting is skewed toward China and the U.S.
Forward look
The risk around the Monday, November 24 rebalancing lies in how positioning aligns, or doesn’t, with the reweighting mix. Italy, Spain and Japan appear cheap to positioning, relative to the new weights. By region, APAC is a wash, as is EMEA, while EM sees net gains led by China.
Worth noting: This year’s shift flips China and India compared with the same rebalance 12 months ago, when India gained 45bp and China lost 10bp.
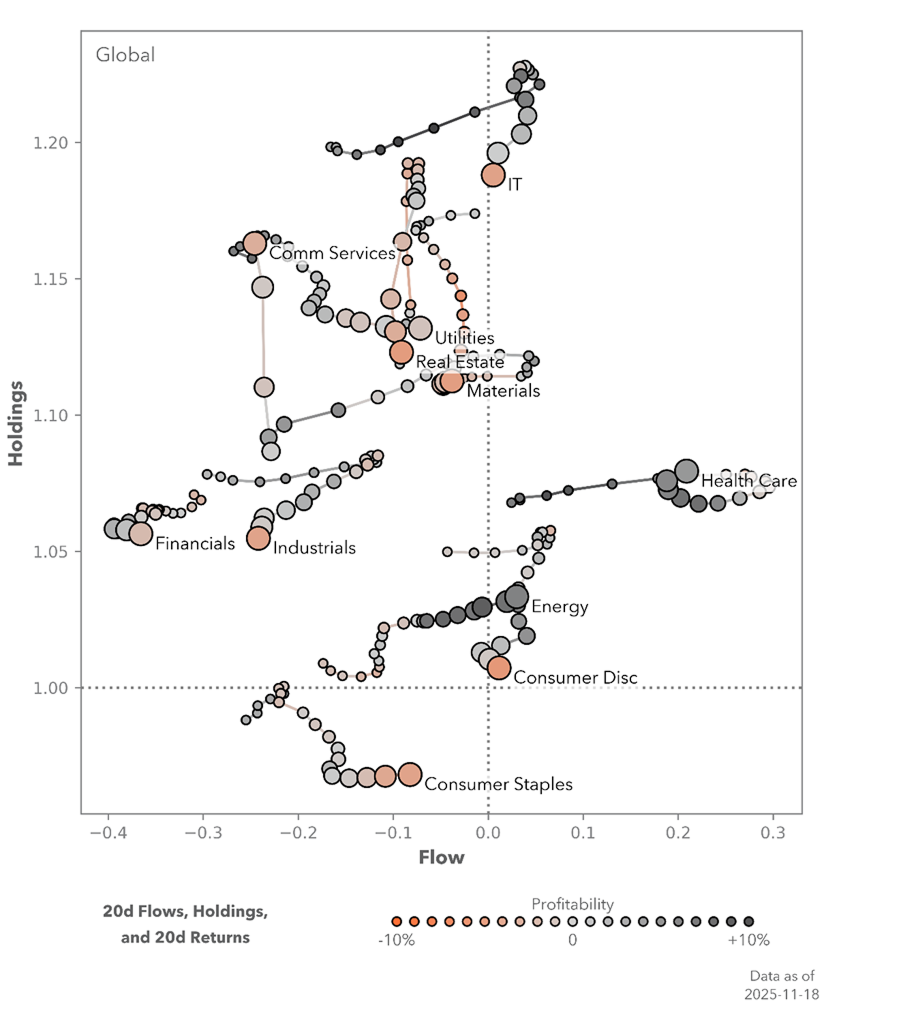
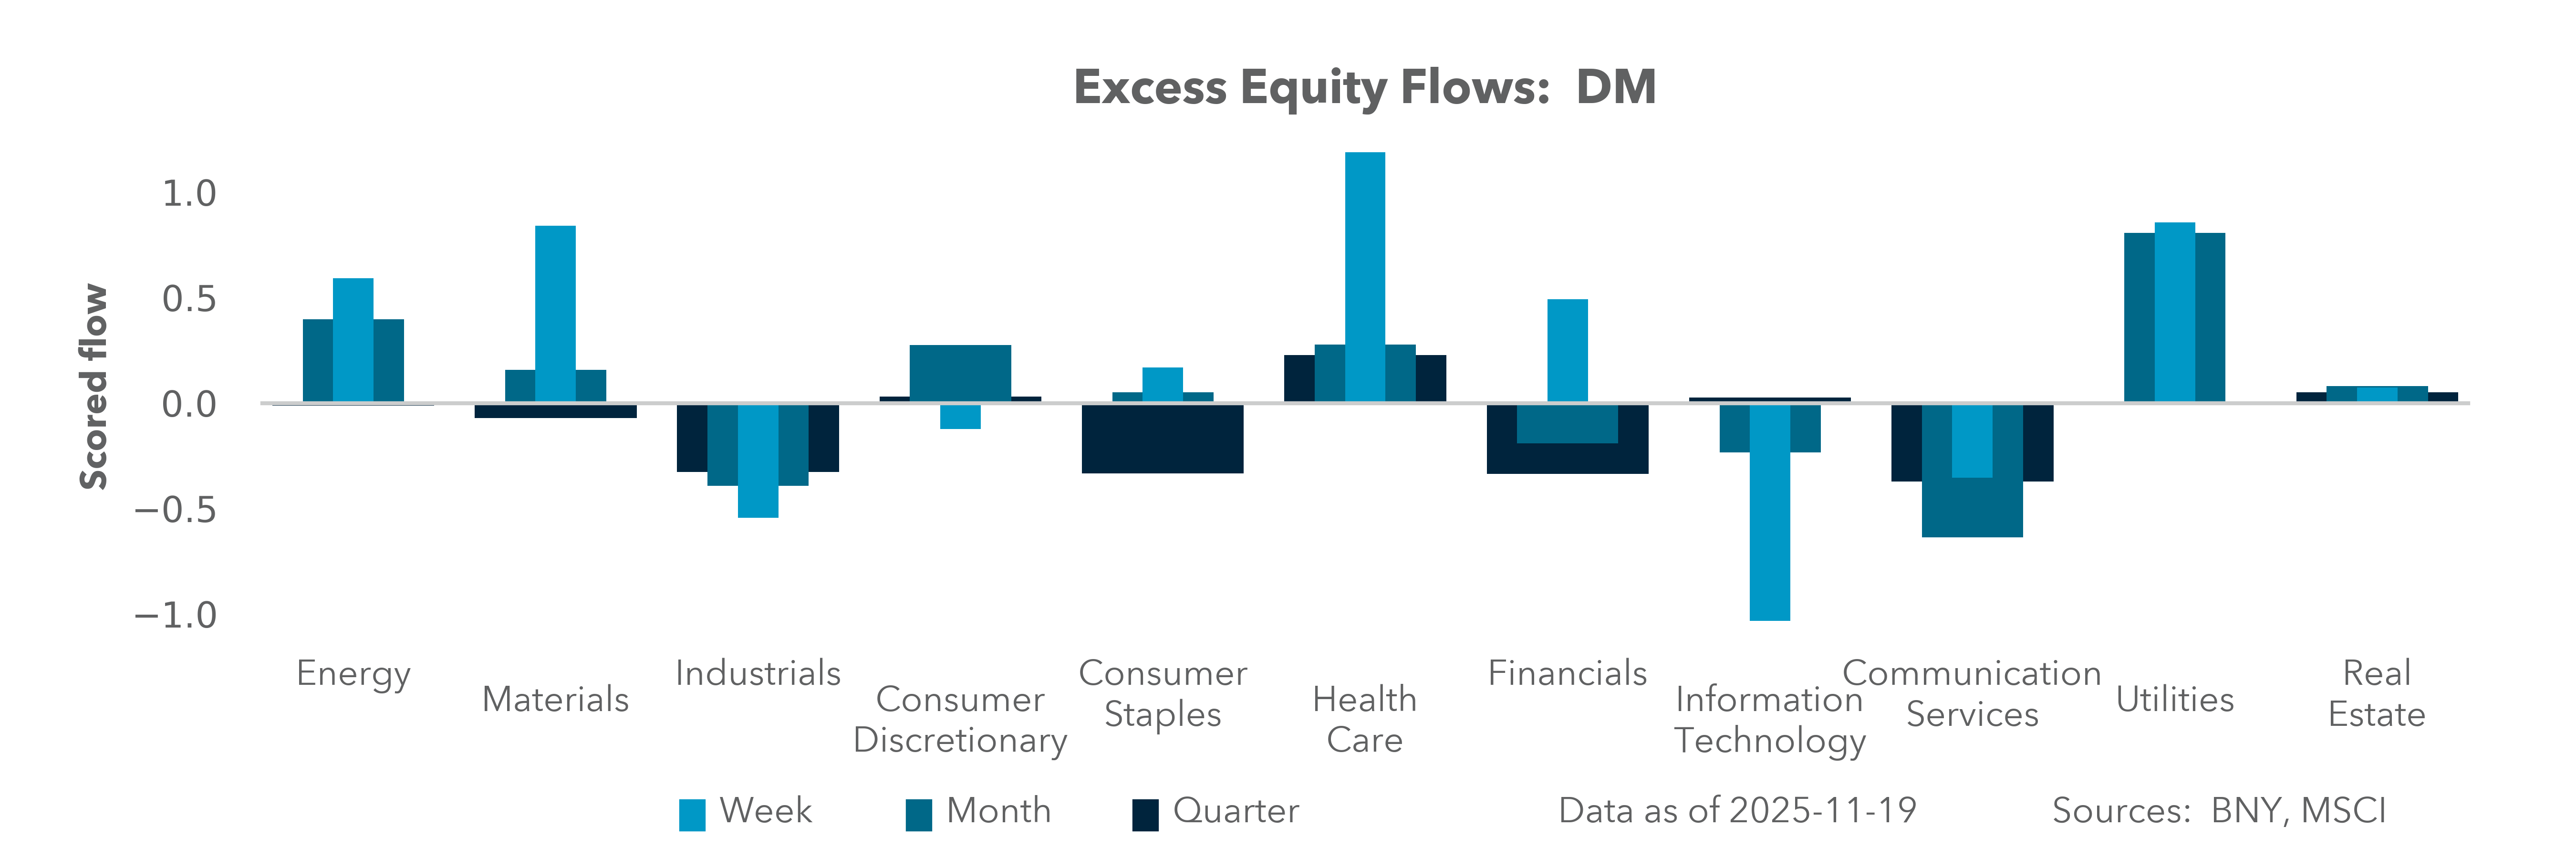
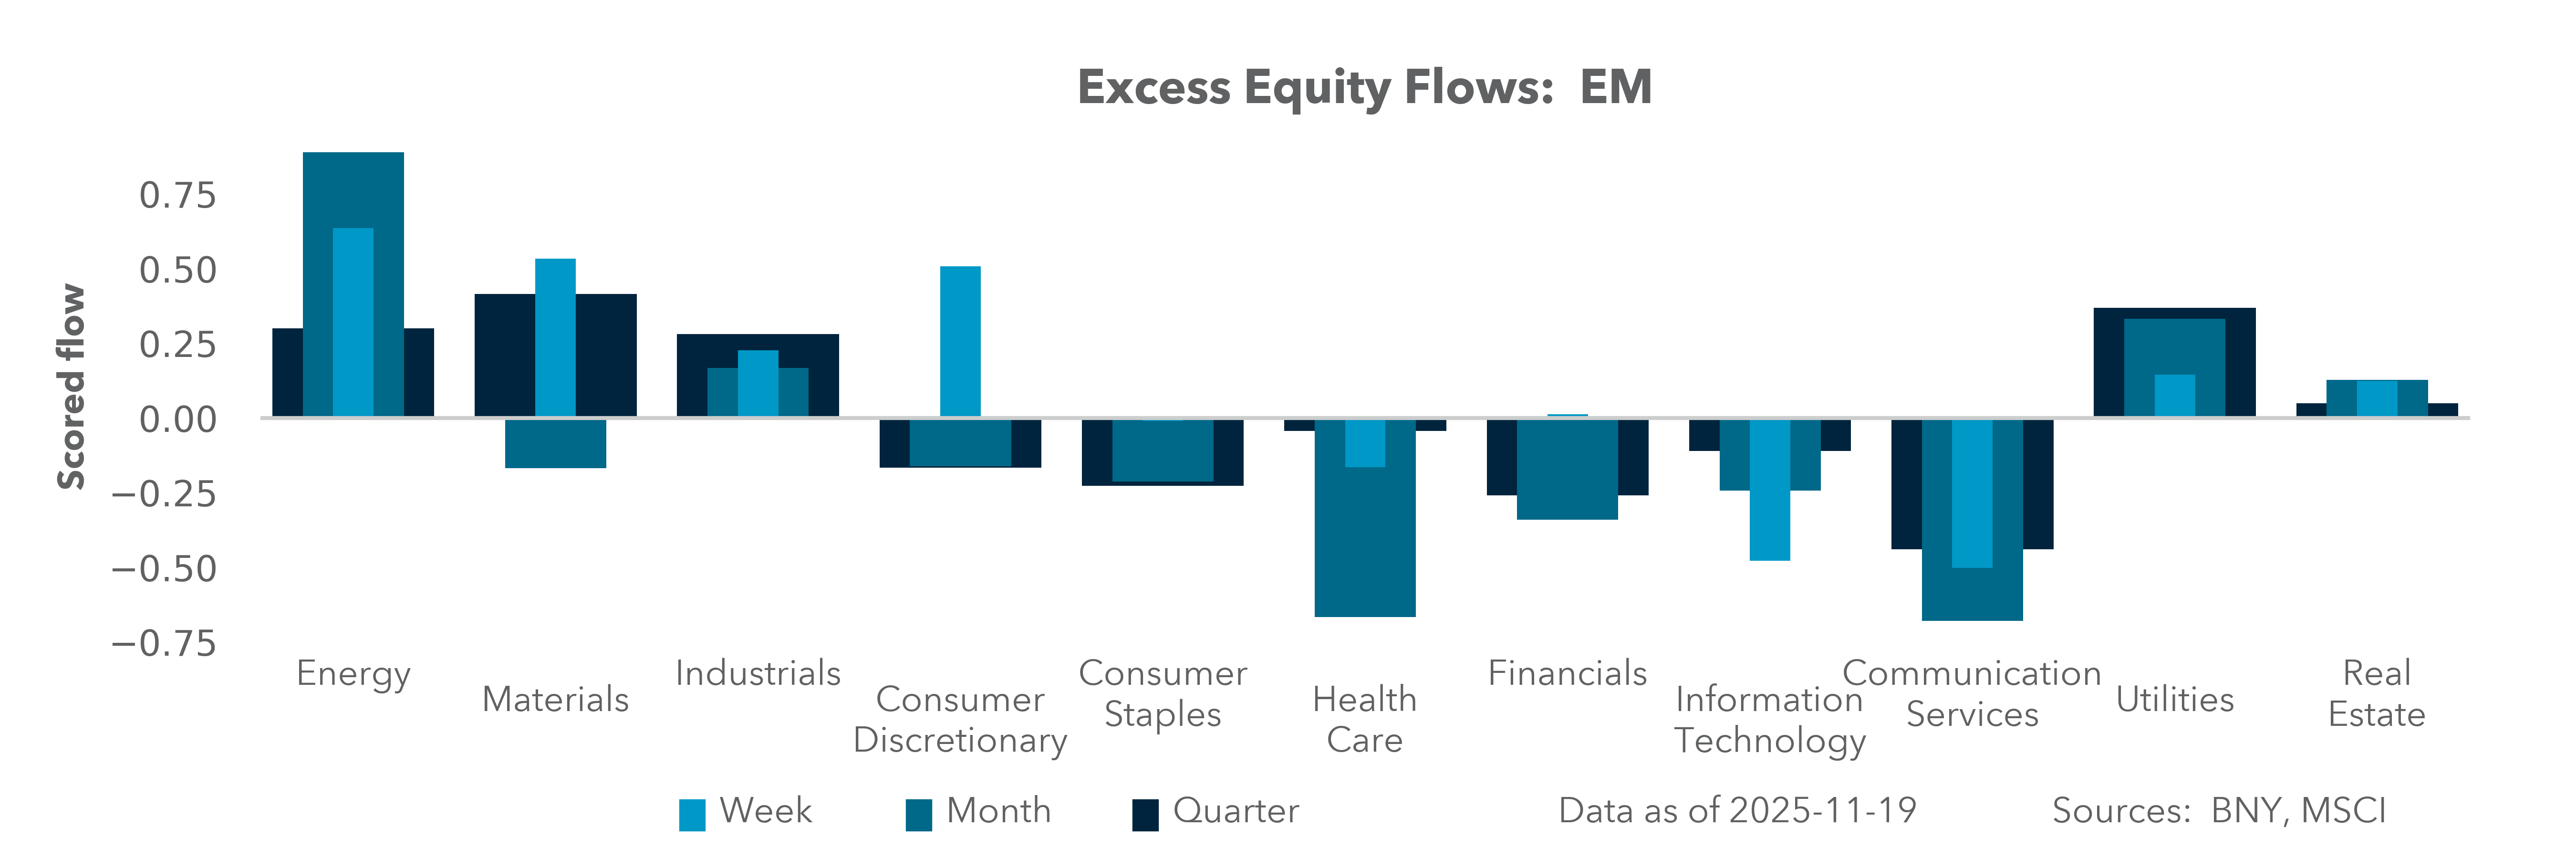
EXHIBIT #2: IFLOW GLOBAL EQUITY SECTOR FLOWS (LAST 20 DAYS)
Source: BNY, MSCI
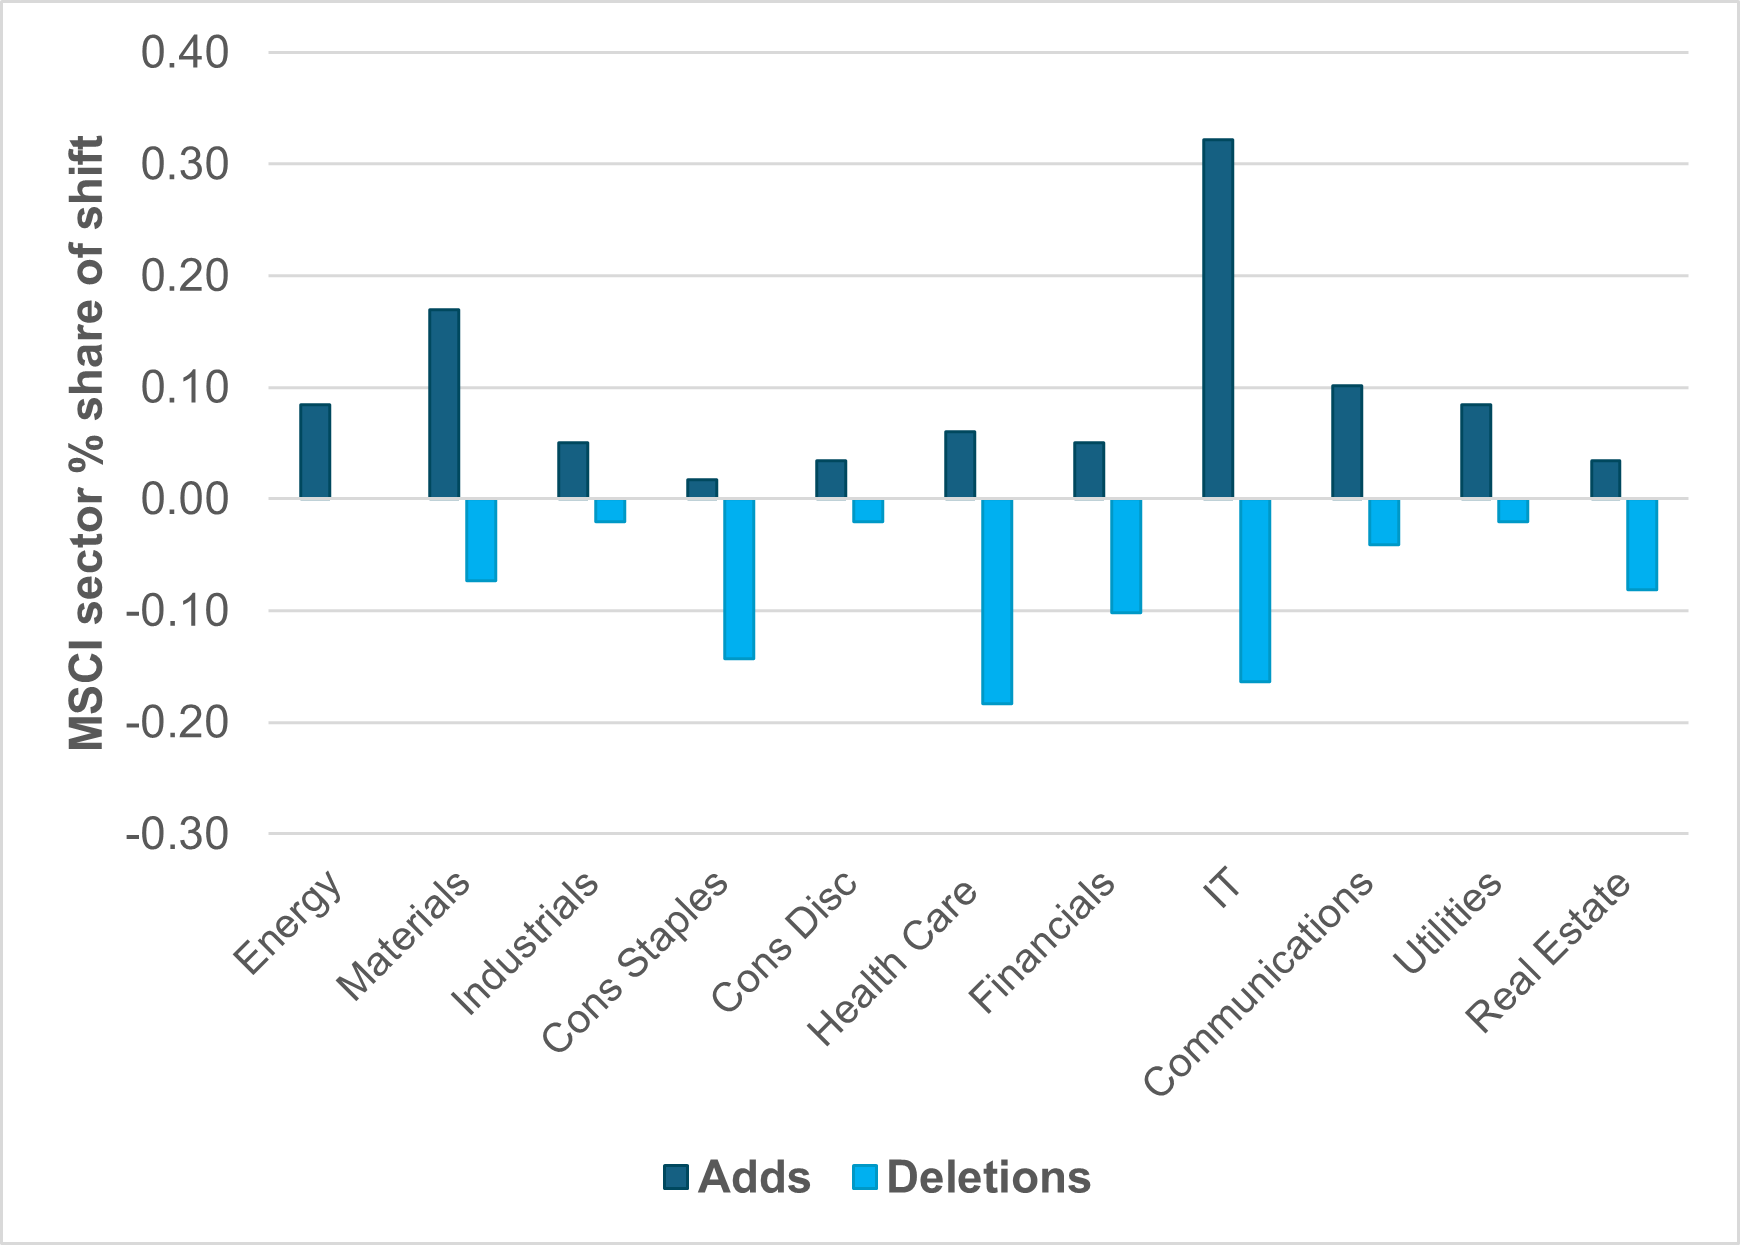
EXHIBIT #3: MSCI SECTOR REWEIGHTING – INDEX CHANGES
Source: BNY, MSCI
Our take
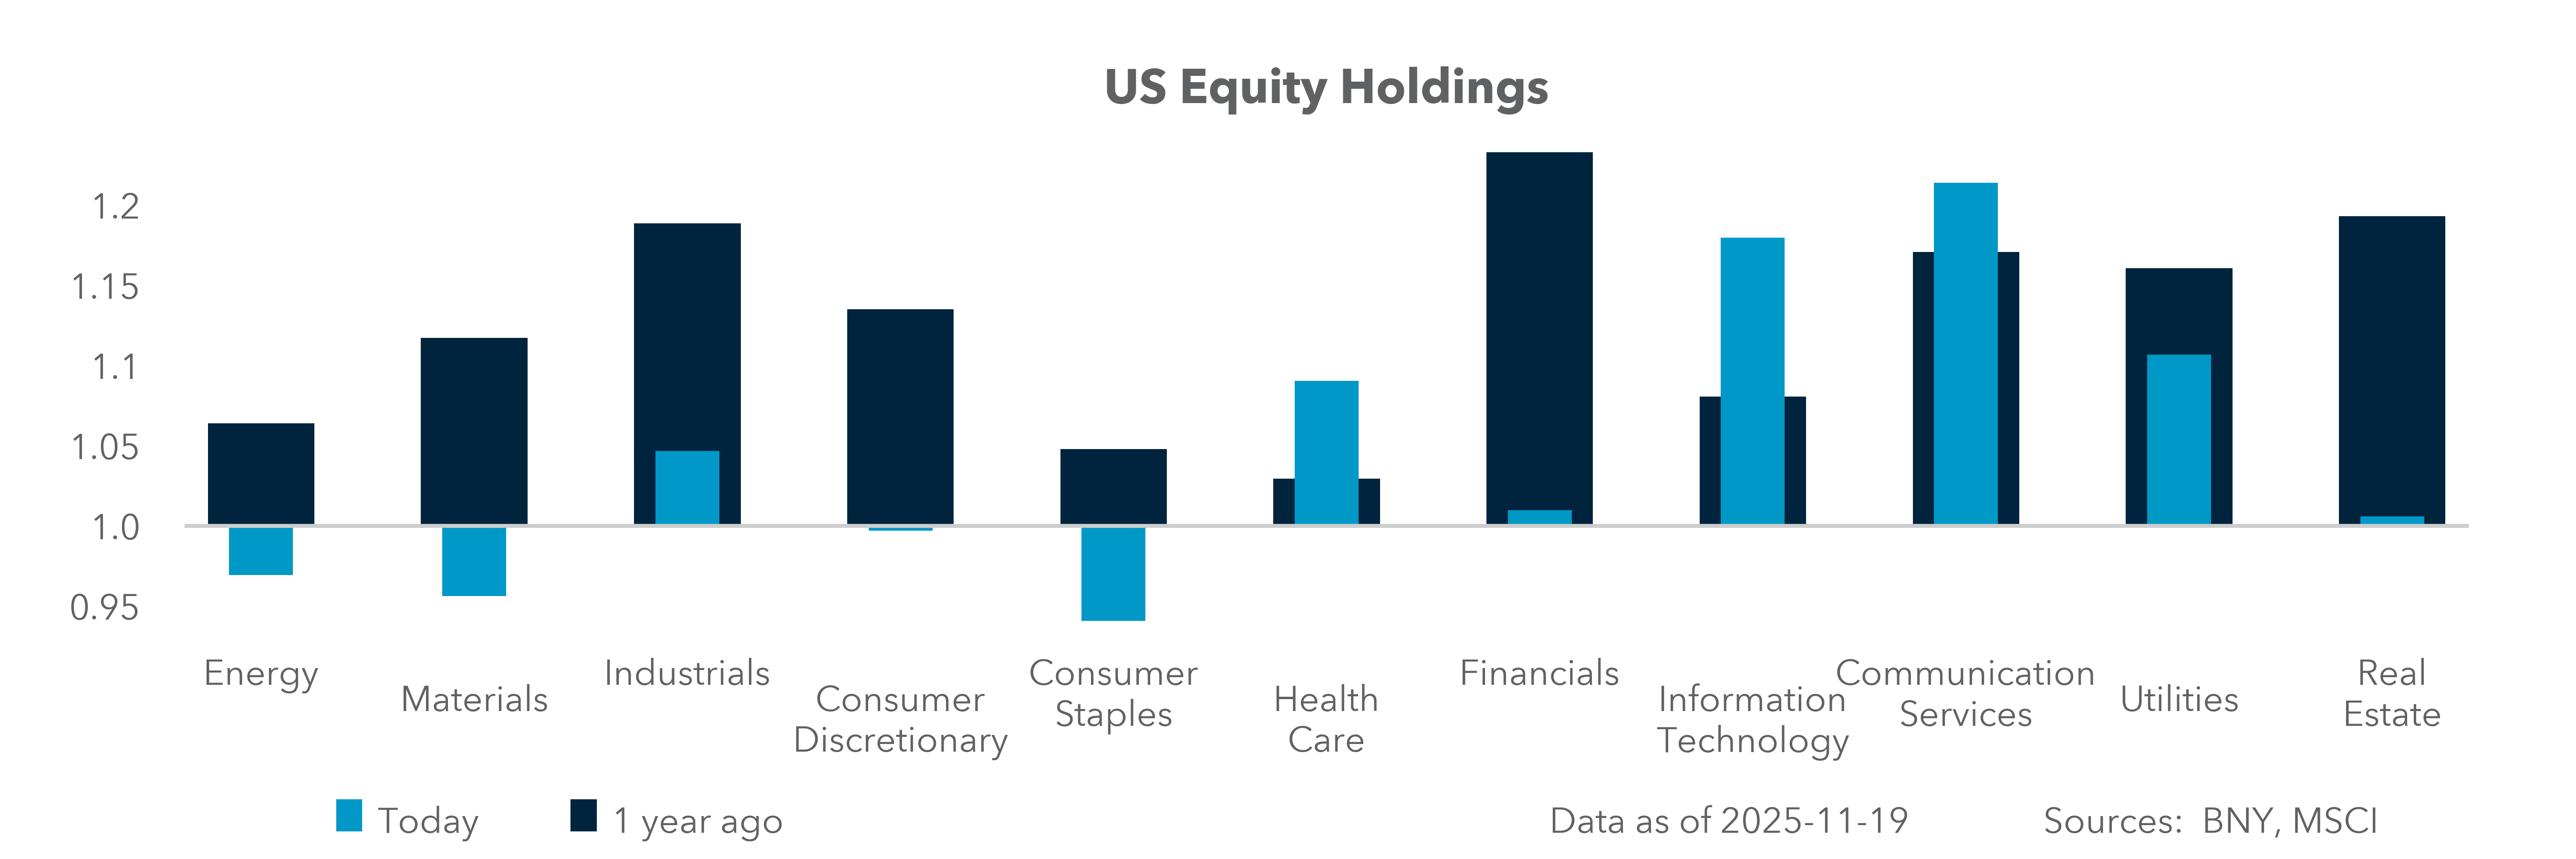
November rotation trades have been significant ahead of the MSCI rebalance. Pressure on global shares stems from two factors: falling odds of a Fed rate cut and growing doubts about IT sector valuations. The MSCI reweights are clearly supporting IT and weighing on Health Care, Real Estate and Consumer Staples. The risk for markets lies in positioning. As Exhibit #2 shows, Health Care and Consumer Staples are overheld and seeing inflows in our data, while IT, Materials and Industrials are being sold, albeit from above-average holdings.
Forward look
Rotation trades typically occur at quarter end, not month end. The MSCI rebalancing shift is fully expected. While it runs counter to recent flows, it is unlikely to meaningfully shift market sentiment. The risk lies more in the deletions than the additions. As a result, attention will focus on Health Care and Consumer Staples.
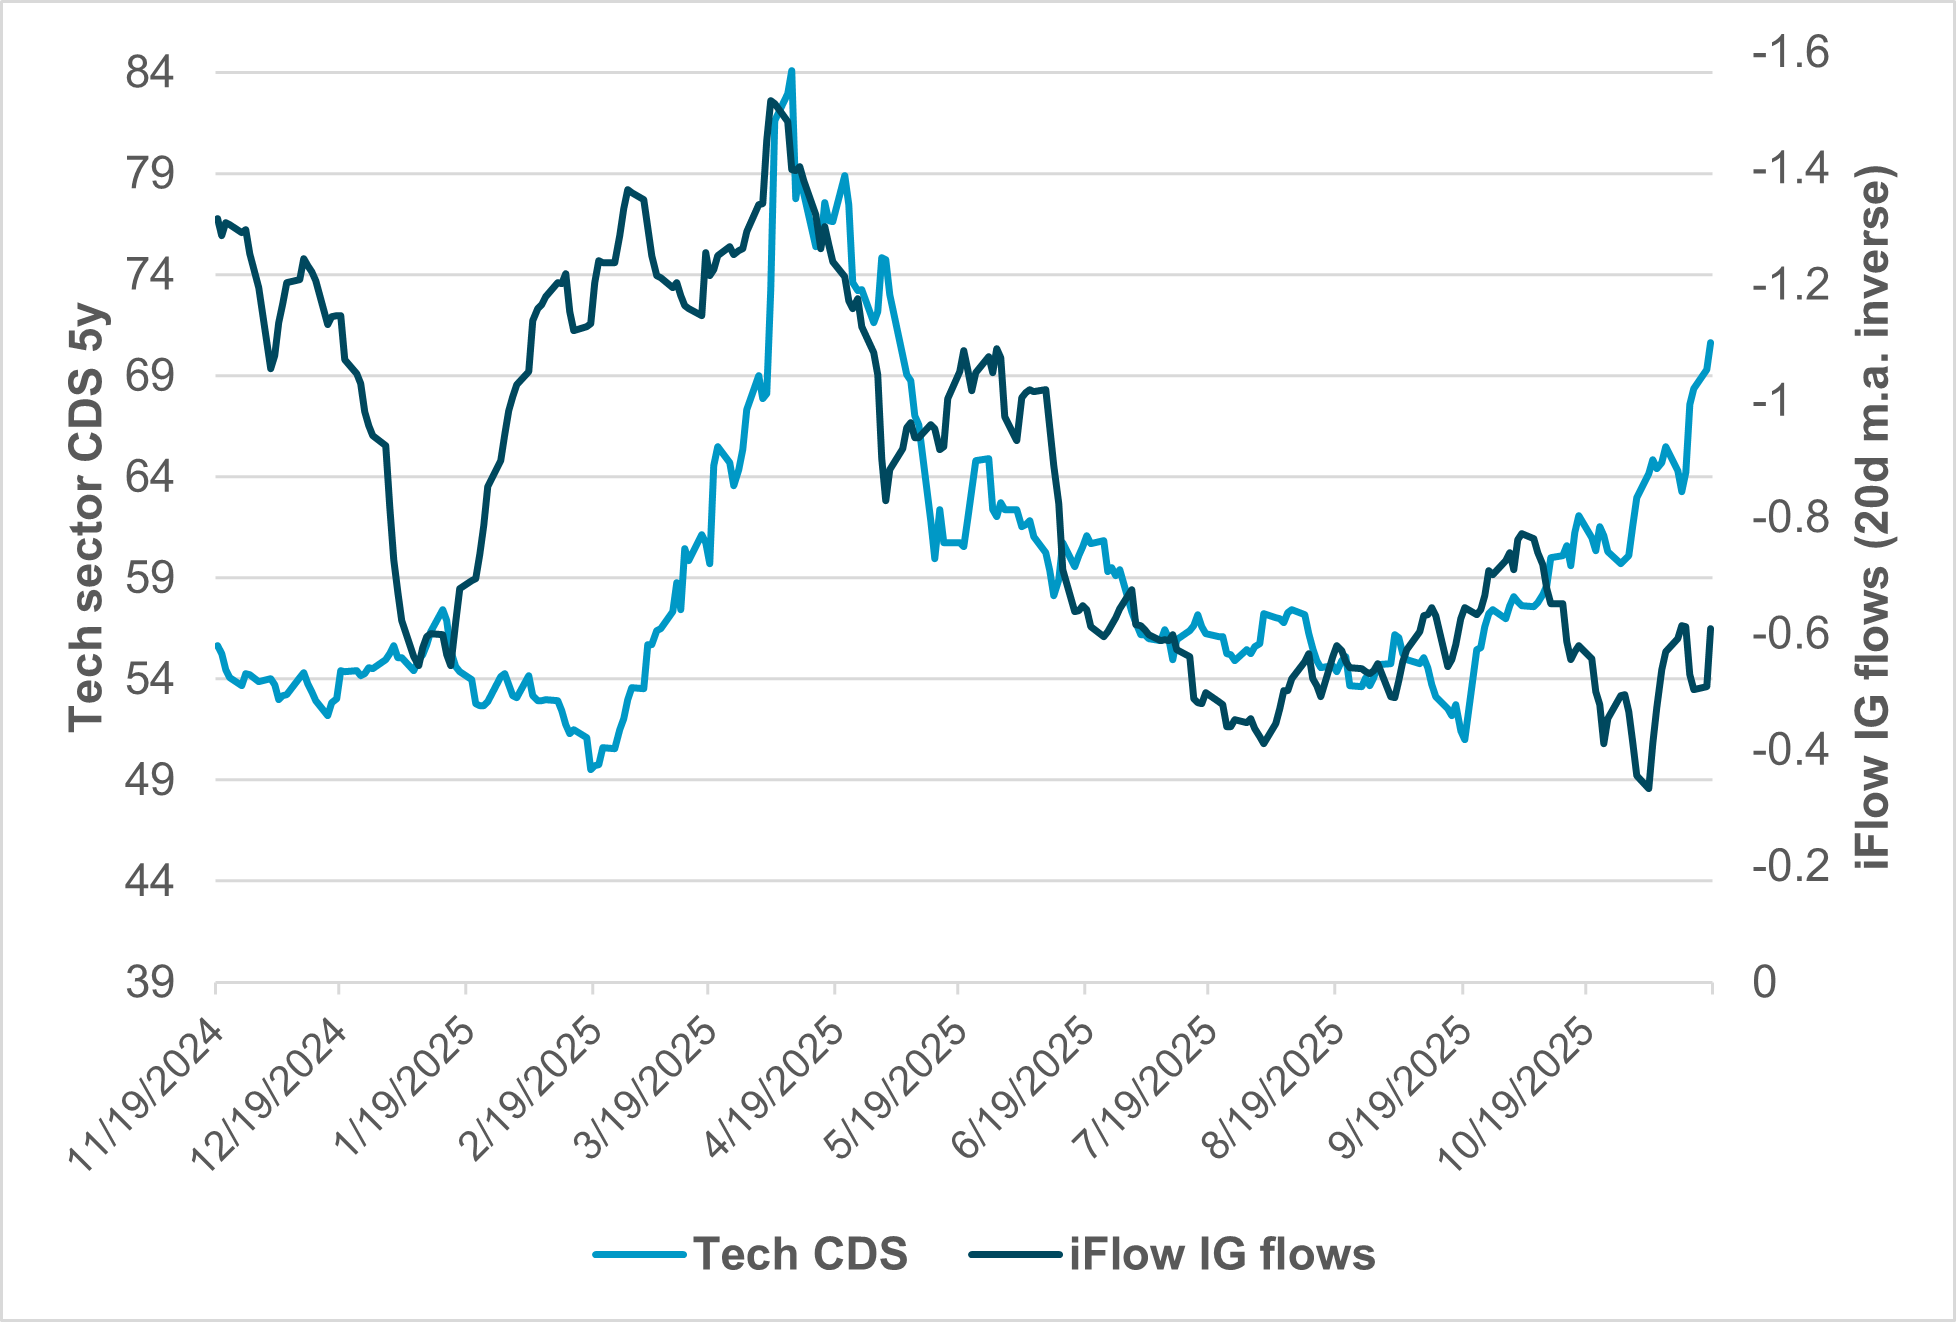
EXHIBIT #4: IT CDS AND IFLOW IG BOND FLOWS
Source: BNY, Bloomberg
Our take
The market has been fixated on the drop in specific tech names and their credit default swap (CDS) levels. This starts with the issuance of debt to finance AI investments, diluting free cash flow. It’s compounded by high valuations and concerns about long-term sustainability of growth, especially as large numbers weigh on percentage gains.
The role of debt issuance for AI investment sets a floor for calculating returns, as borrowing costs become increasingly linked to broader market conditions. Our data show that investment-grade (IG) flows were rising until October, when hyperscaler IT companies began issuing in size. The impact on the Tech sector has been notable, with sector CDS spreads widening meaningfully. The move up in spreads looks more secular than cyclical.
The relationship of tech to the broader market was clear in March and April. The contrast in debt and valuation concerns now, compared to the start of the year is stark and suggests that investors are unlikely to be reassured by Fed rate cuts alone. The burden of proof for technology now lies with margins and returns, making Q4 earnings reports in January critical to sustaining the IT sector’s dominance. Until then, investors are likely to maintain a more neutral stance despite the Nvidia Q3 earnings beat.
As investors navigate the late-November landscape, portfolio positioning will hinge on how rebalancing flows and credit dynamics interact with an increasingly data-dependent Federal Reserve. Clarity on the path of rate cuts may have to wait until December 16. The MSCI changes reinforce U.S. and China prominence, suggesting renewed dispersion across geographies and sectors into year end. While near-term liquidity and holiday calm may limit volatility, the interplay between corporate credit costs and equity valuations – particularly in technology – will define relative performance. Equity managers should remain attentive to margin sustainability and capital discipline as the market transitions from rotation-driven trade to fundamentals-driven returns heading into 2026.