Fear of Missing Out
Equities provides an in-depth look each Friday at the factors shaping equities markets in developed and emerging economies around the world.
Equities provides an in-depth look each Friday at the factors shaping equities markets in developed and emerging economies around the world.

Bob Savage
Time to Read: 5 minutes
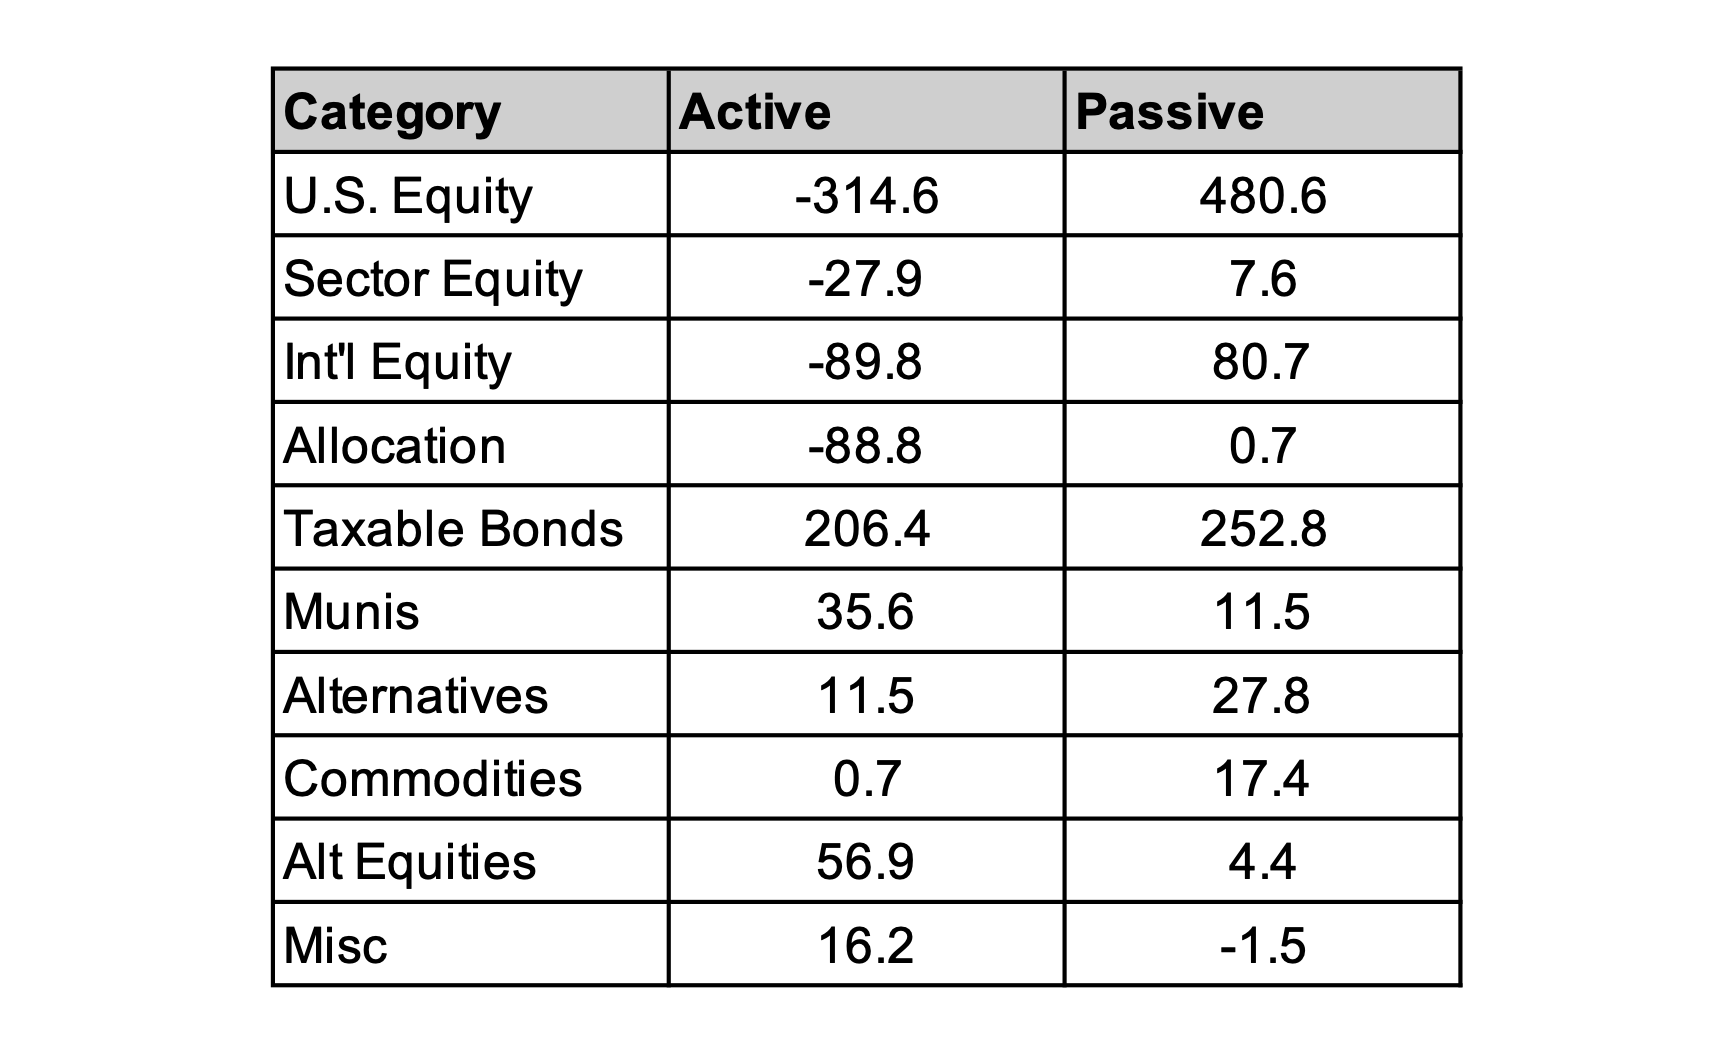
EXHIBIT #1: PASSIVE FUNDS SAW MORE INFLOWS THAN ACTIVE FUNDS, WHILE EQUITIES SAW LESS THAN BONDS
Source: Morningstar, ICI, BNY
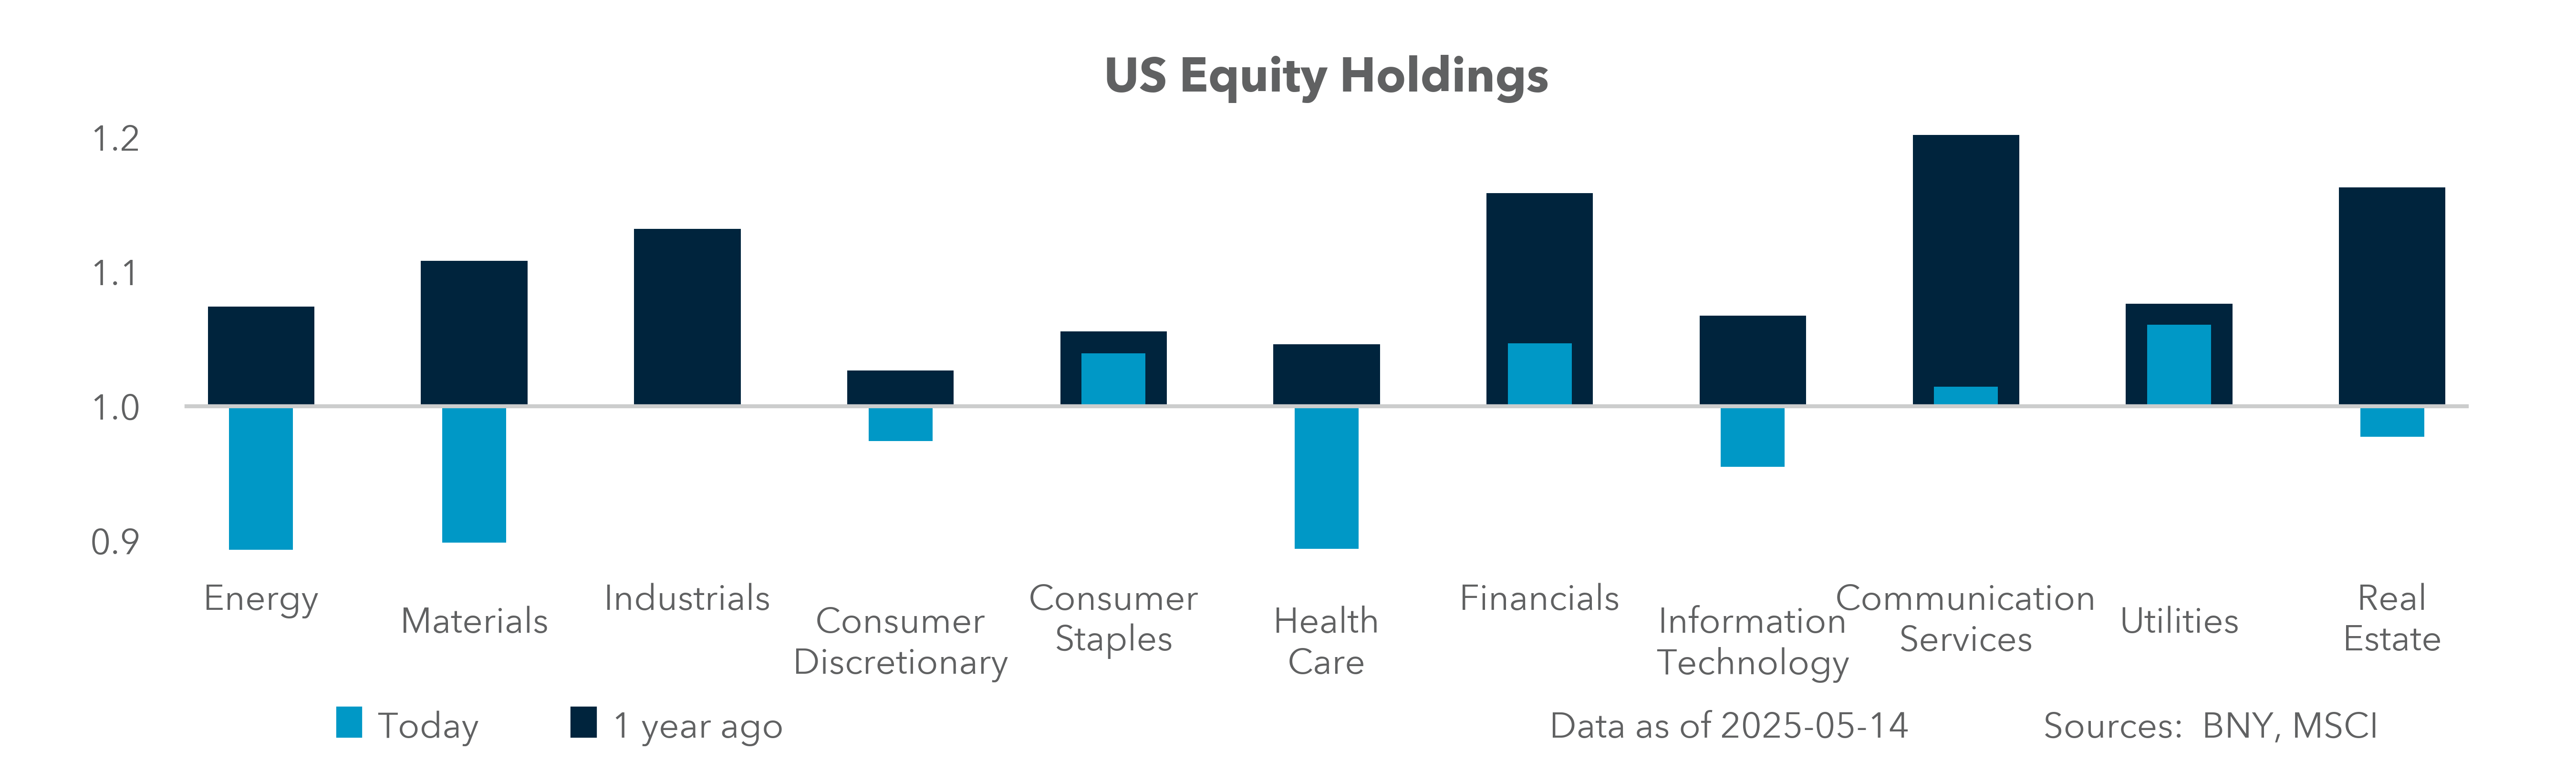
Investors ignored volatility and bought the dip in April, with the significant outperformance of passive trading compared to active management proving this to be the correct strategy. With U.S. equity holdings still 4% below their 10-year average, we believe the S&P 500 and other indexes have more room to go and extend the current rally. Many analysts have changed their 2025 outlook for the S&P 500 from a decline to an increase, with 6,200 the new average forecast. While some investors may have a fear of missing out, regardless of market volatility or fundamentals, they must also contend with a fear of overvaluation and momentum factors. Where they land may depend on how far positions in U.S. assets are stretched from their Q4 highs, when U.S. exceptionalism was the dominant theme.
Our Take
Some of the pressure in April, from bonds to stocks, reflected structural flow differences between passive and active management. Over the last year, passive fund flows totaled $882bn, while active funds saw outflows of $194bn. Also notable is that in the last year fixed income flows beat equity flows by 70%. Asset allocation pressure stands out, making the rebalancing efforts as we head into the June quarter-end key. But retail investors are clearly following the same line of thinking, with ETF flows reflecting the same shift from bonds to stocks. Net inflows into active and passive equity ETFs totaled just $109.8 billion over the past 12 months, whereas fixed income saw combined net inflows of $506.3 billion over the same time frame.
Forward Look
Current U.S. 10-year yields, which are hovering around 4.50%, will be pivotal in shaping investor behavior and asset allocation strategies in the coming weeks. In April 10-year bonds traded in a range of 4.50% to 4.75%, prompting a response from the Trump administration but not the Federal Reserve. The result was a pause in reciprocal tariffs in an effort to bolster market sentiment. Volatility in the first half of April may serve as a catalyst for investors to reassess their strategies for 2025 and beyond.
Our proprietary data indicate that the rise in passive investment bias extends beyond retail investors. Investment models have transitioned from underperformance to success, with factors such as trend, carry and size gaining in significance. However, the value factor appears to be misaligned. A notable shift in correlation between our flow data in April and other periods of S&P 500 declines underscores the dominance of momentum and other factors. Consequently, the upcoming month will force investors to make critical decisions between bonds and stocks, passive and active strategies, and the ongoing dichotomy between soft and hard economic data.
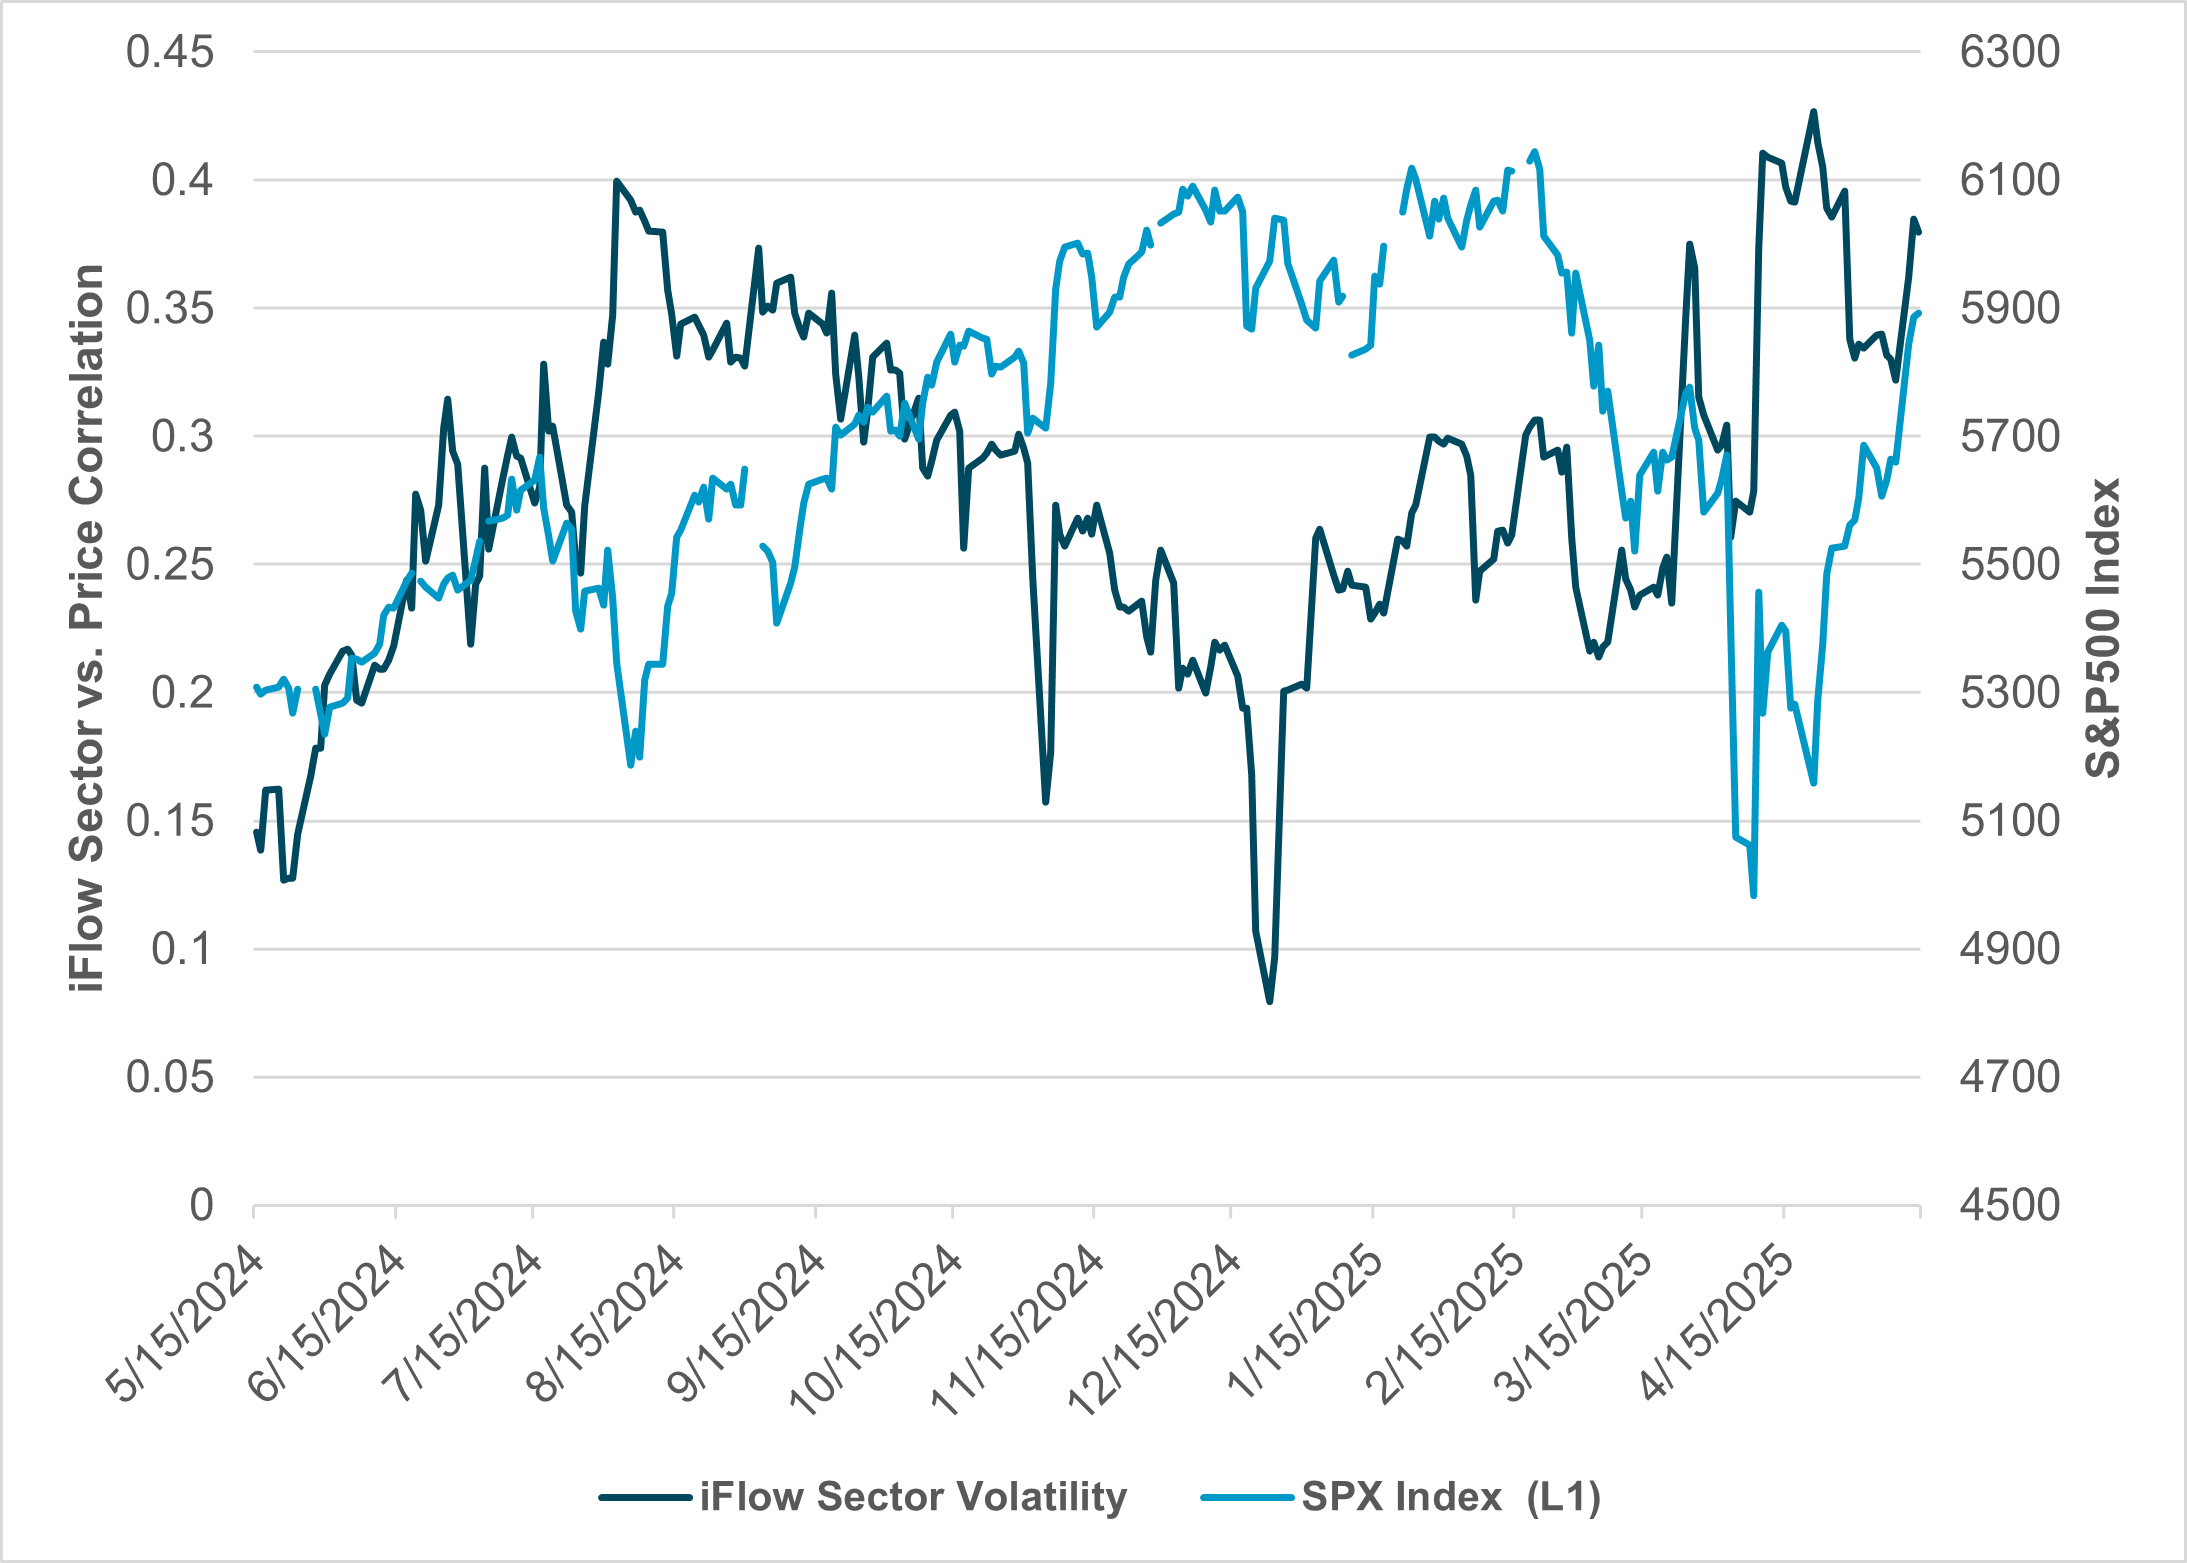
EXHIBIT #2: CORRELATION OF U.S. SECTOR FLOW VOLATILITY AND RETURN VOLATILITY COMPARED TO THE S&P 500
Source: BNY, Bloomberg
Our Take
The role of passive investments flows matters to how markets react to surprises like “Liberation Day.” Traditionally, active management beats passive management in times of uncertainty. The flow of money into equities continues to surprise, with April ETF volumes the second highest ever, after March 2025. Retail buying of shares and some faster money buying the dip explain the recovery following the April 8 pause. What stands out in our data is how the overall investor base in U.S. shares didn’t make active sector decisions in April but has instead chased the tape since April 17. The current correlation of our flows in each sector against the price volatility of those same sectors suggests that even active managers are looking at momentum or other beta factors to drive their flows. Over the last 10 years we only saw active managers dominate U.S. equity flows in 2018, when markets were last concerned about a recession and tariffs on China.
Forward Look
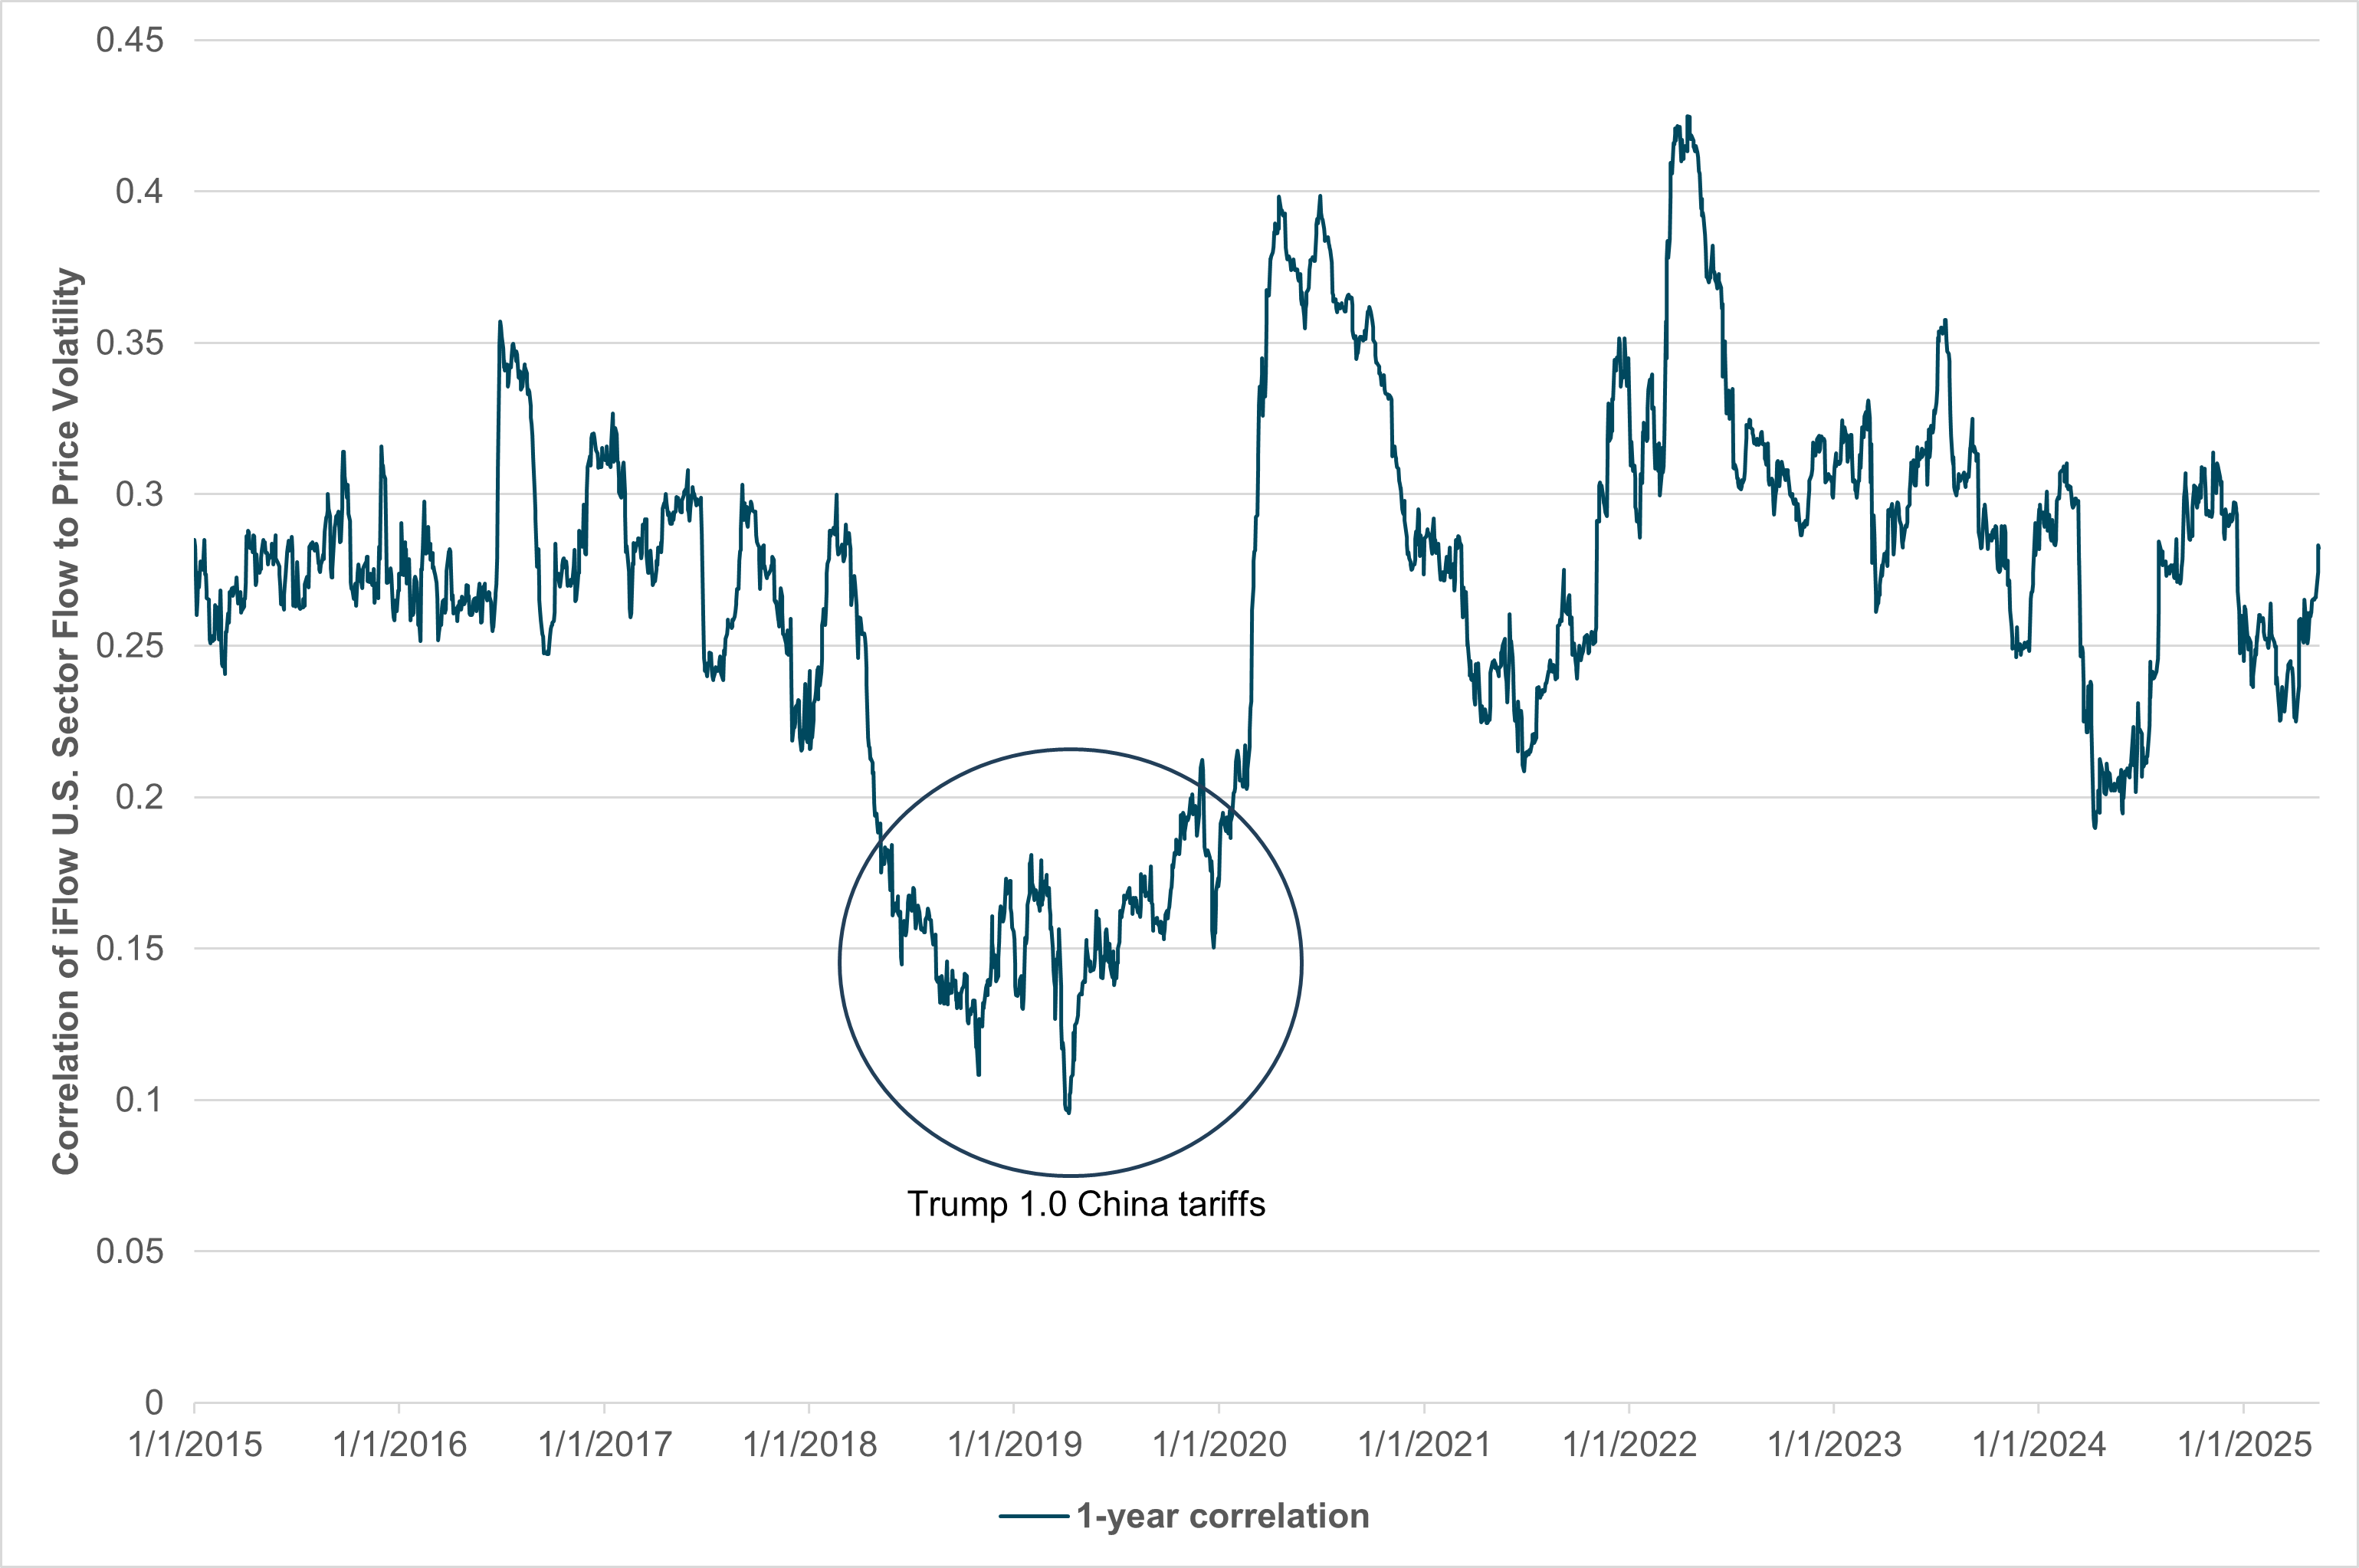
Our correlation of flows to price dipped in the middle of December, when the S&P 500 was near its highs, reflecting a seasonality to asset allocation. This was in contrast to the current chasing of price and highlights the quarterly pressure on active managers to reweight and rethink positions. The current level of correlation suggests there is a battle over what factors matter most in driving markets as we move into the summer. One concern is momentum vs. value, with Q1 earnings better than expected but the Q2 outlook worse, as revenues are weaker than expected, but there are hopes for tariff relief in Q2. All investors face the dilemma of high cash holdings and the Fed’s current wait-and-see policy. The risk in June is that there will be a significant asset reallocation from certain sectors to others, from domestic shares to foreign stocks, and from equities to bonds. Perhaps the largest fundamental driver will be trade talks and the extent to which they restore business and consumer confidence.
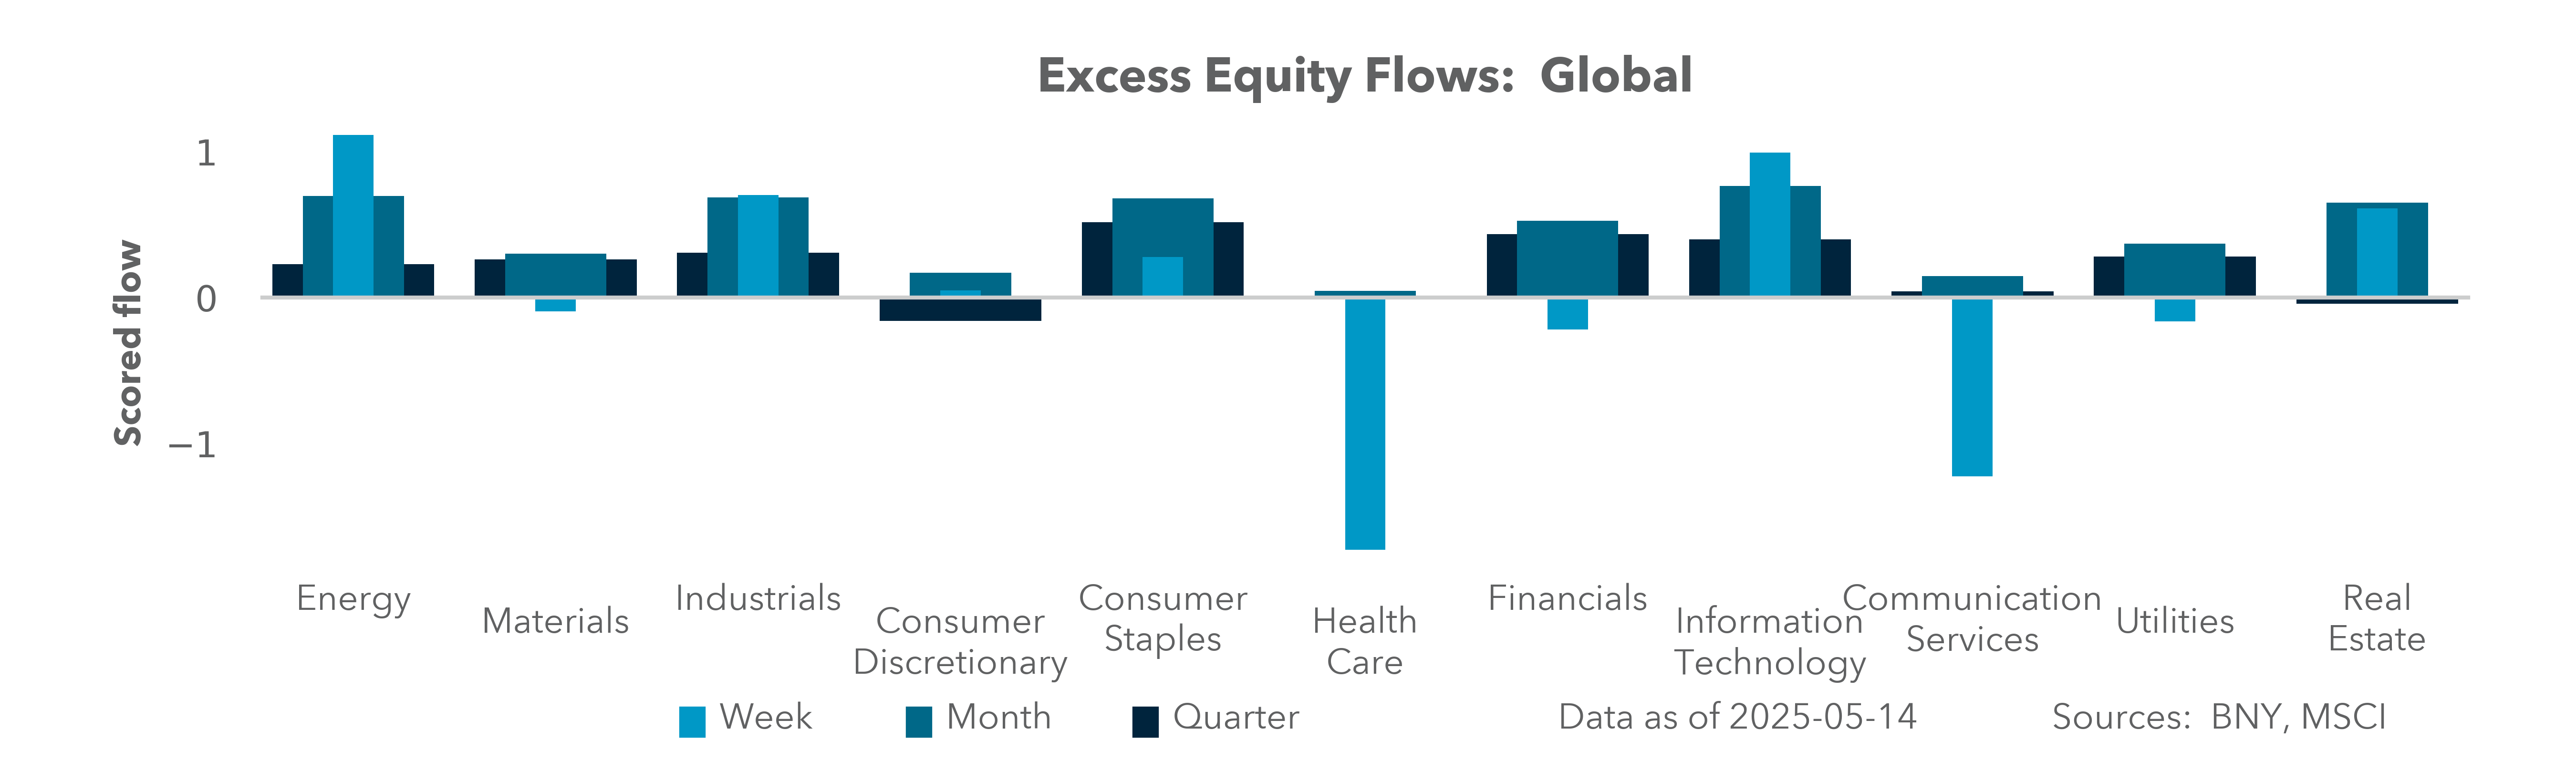
EXHIBIT #3: IFLOW 1-YEAR CORRELATION OF U.S. SECTOR FLOWS TO PRICE VOLATILITY
While momentum has become a dominant factor in trading equities and the USD, the same is not true for bonds in the present market environment. The risk of more uncertainty in the weeks ahead revolves around the relationship of the USD to rates and to equities. Hedging the dollar has been part of the relief rally in U.S. equities, but it also plays a role in the current pressure on U.S. bonds. Our flows suggest we are in the middle of the relief rally, not at the end, and as such the role of month-end rebalancing and quarter-end rebalancing is not yet a key driver for markets. Behind the big April lesson of buying the dip in equities lies an unproven expectation that trade and fiscal policy will shift when volatility becomes too extreme. Whether this remains true will likely be critical to the balance of current stock market beta and the correlation to bonds and the dollar. The test will likely come with the U.S. Congress and the tax bill along with the actual number of trade deals negotiated ahead of June 30.