AI and the Speed Limit
iFlow > Equities
An in-depth look each Friday at the factors shaping equities markets in developed and emerging economies around the world.
iFlow > Equities
An in-depth look each Friday at the factors shaping equities markets in developed and emerging economies around the world.

Bob Savage
Time to Read: 5 minutes
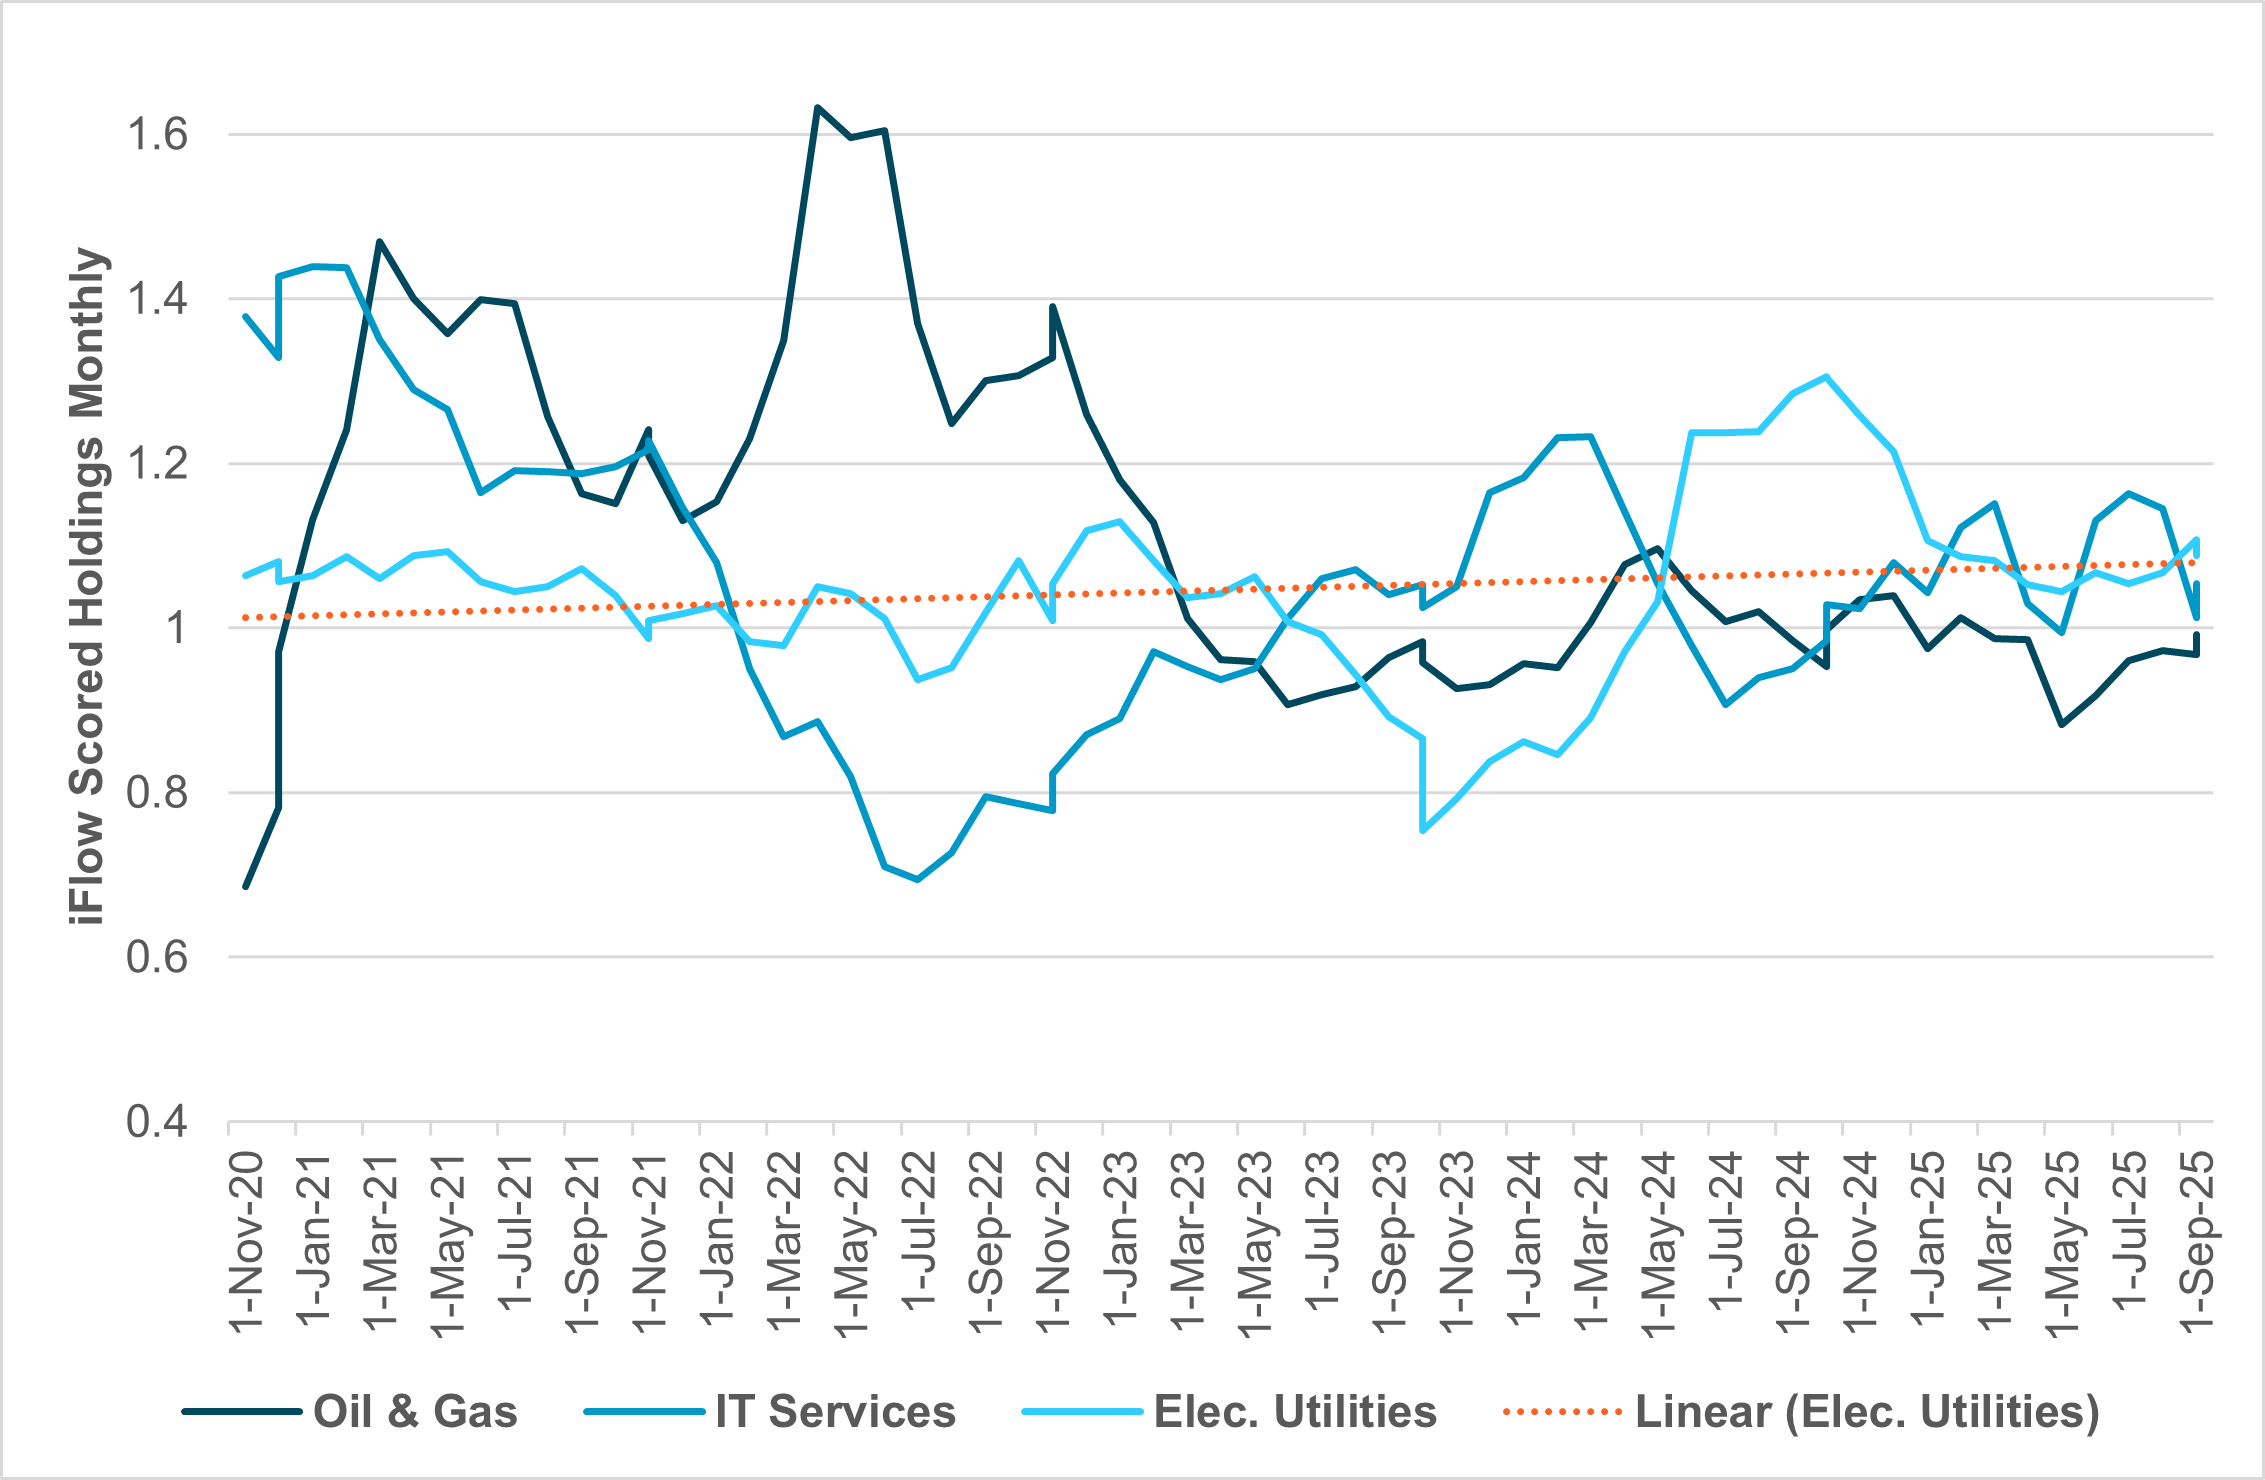
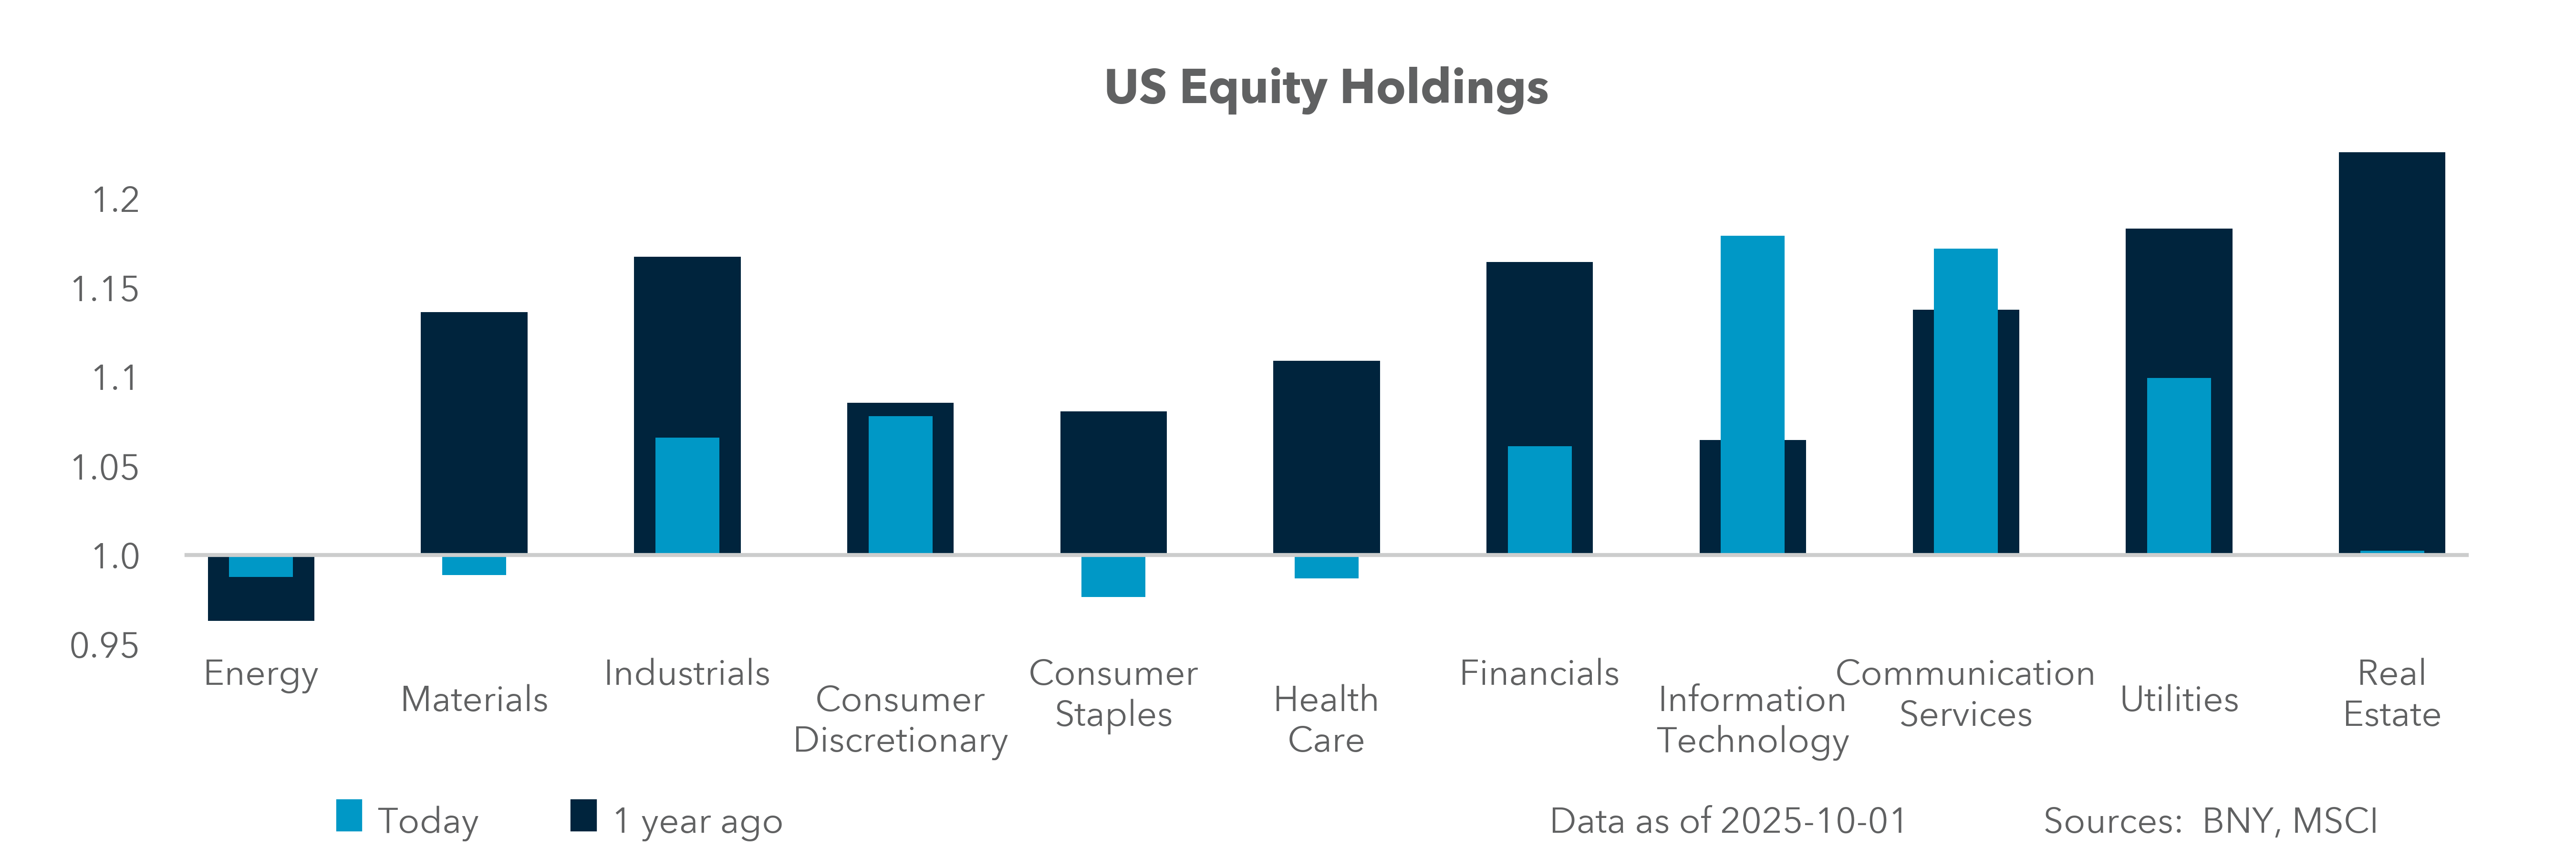
EXHIBIT #1: U.S. EQUITY HOLDINGS OF KEY AI-LINKED INDUSTRIES
Source: BNY
Weaker U.S. labor market data and clear speeches by Fedspeakers are keeping October rate cut expectations intact. The equity market rally is continuing on the expectation that job losses are not symptomatic of weaker growth and falling margins. The focus on higher margins and higher productivity is driving the bounce-back in U.S. shares, led by big tech companies. This week OpenAI’s valuation rose to $500bn and the U.S. tech rally broadened into a global buying spree. The headwinds of a U.S. government shutdown, sticky prices for labor and goods, valuation concerns and the overall level of policy uncertainty continue to show up in more defensive positioning in our iFlow data, with our Mood index at neutral. The dynamic tension of AI investments leading growth but not yet leading jobs or productivity will be scrutinized during Q3 earnings season. For now, lower interest rate costs are helping to propel more leverage for further hyperscaler investments in artificial intelligence and the pursuit of artificial general intelligence.
Our take
Capital investments by big tech companies in data centers, chips and utilities continue to expand. In 2024, a total of $245bn was invested in U.S. AI data centers. Utility grid investments rose by $178bn in 2024, driven by data center demand. In 2025, spending on data center, chips and labor is expected to increase to $450bn, accounting for half of U.S. growth in H1. However, this investment has not matched underlying investor holdings in industries that are likely to benefit from such flows. Current holdings are below the five-year average for IT services, electric utilities and energy. Concerns about an AI bubble clearly show up in our investors’ holdings. In the oil and gas industries, the 31% drop in WTI oil prices is one driver of holdings being 11% below average. Holdings of electric utilities shares are 4% below average, even with significant spending by business, higher prices for electricity (up 5.2% ytd) and the gains in fixed income markets correlating to the industry. Even in IT services equity holdings are 1% below average despite strong earnings and growth.
Forward look
The fear of an AI bubble is based on the cost of investments and their corresponding return. As the history of technology investments shows – from the steam engine to the radio to the internet – overinvestment bubbles are driven by optimism and deflate on the reality of returns. This makes Q3 earnings this month critical. A focus on margins and cash flow is essential to estimating the sustainability of current spending. Investors are important, too, as defensive positioning has been part of the ongoing rally in tech shares. The one industry to watch for vulnerability is electric utilities as these are overheld by cross-border investors by 7%. The holdings reveal the correlation between the confidence that utilities will provide more fixed income-like returns and the belief that they will benefit from the AI demand boom.
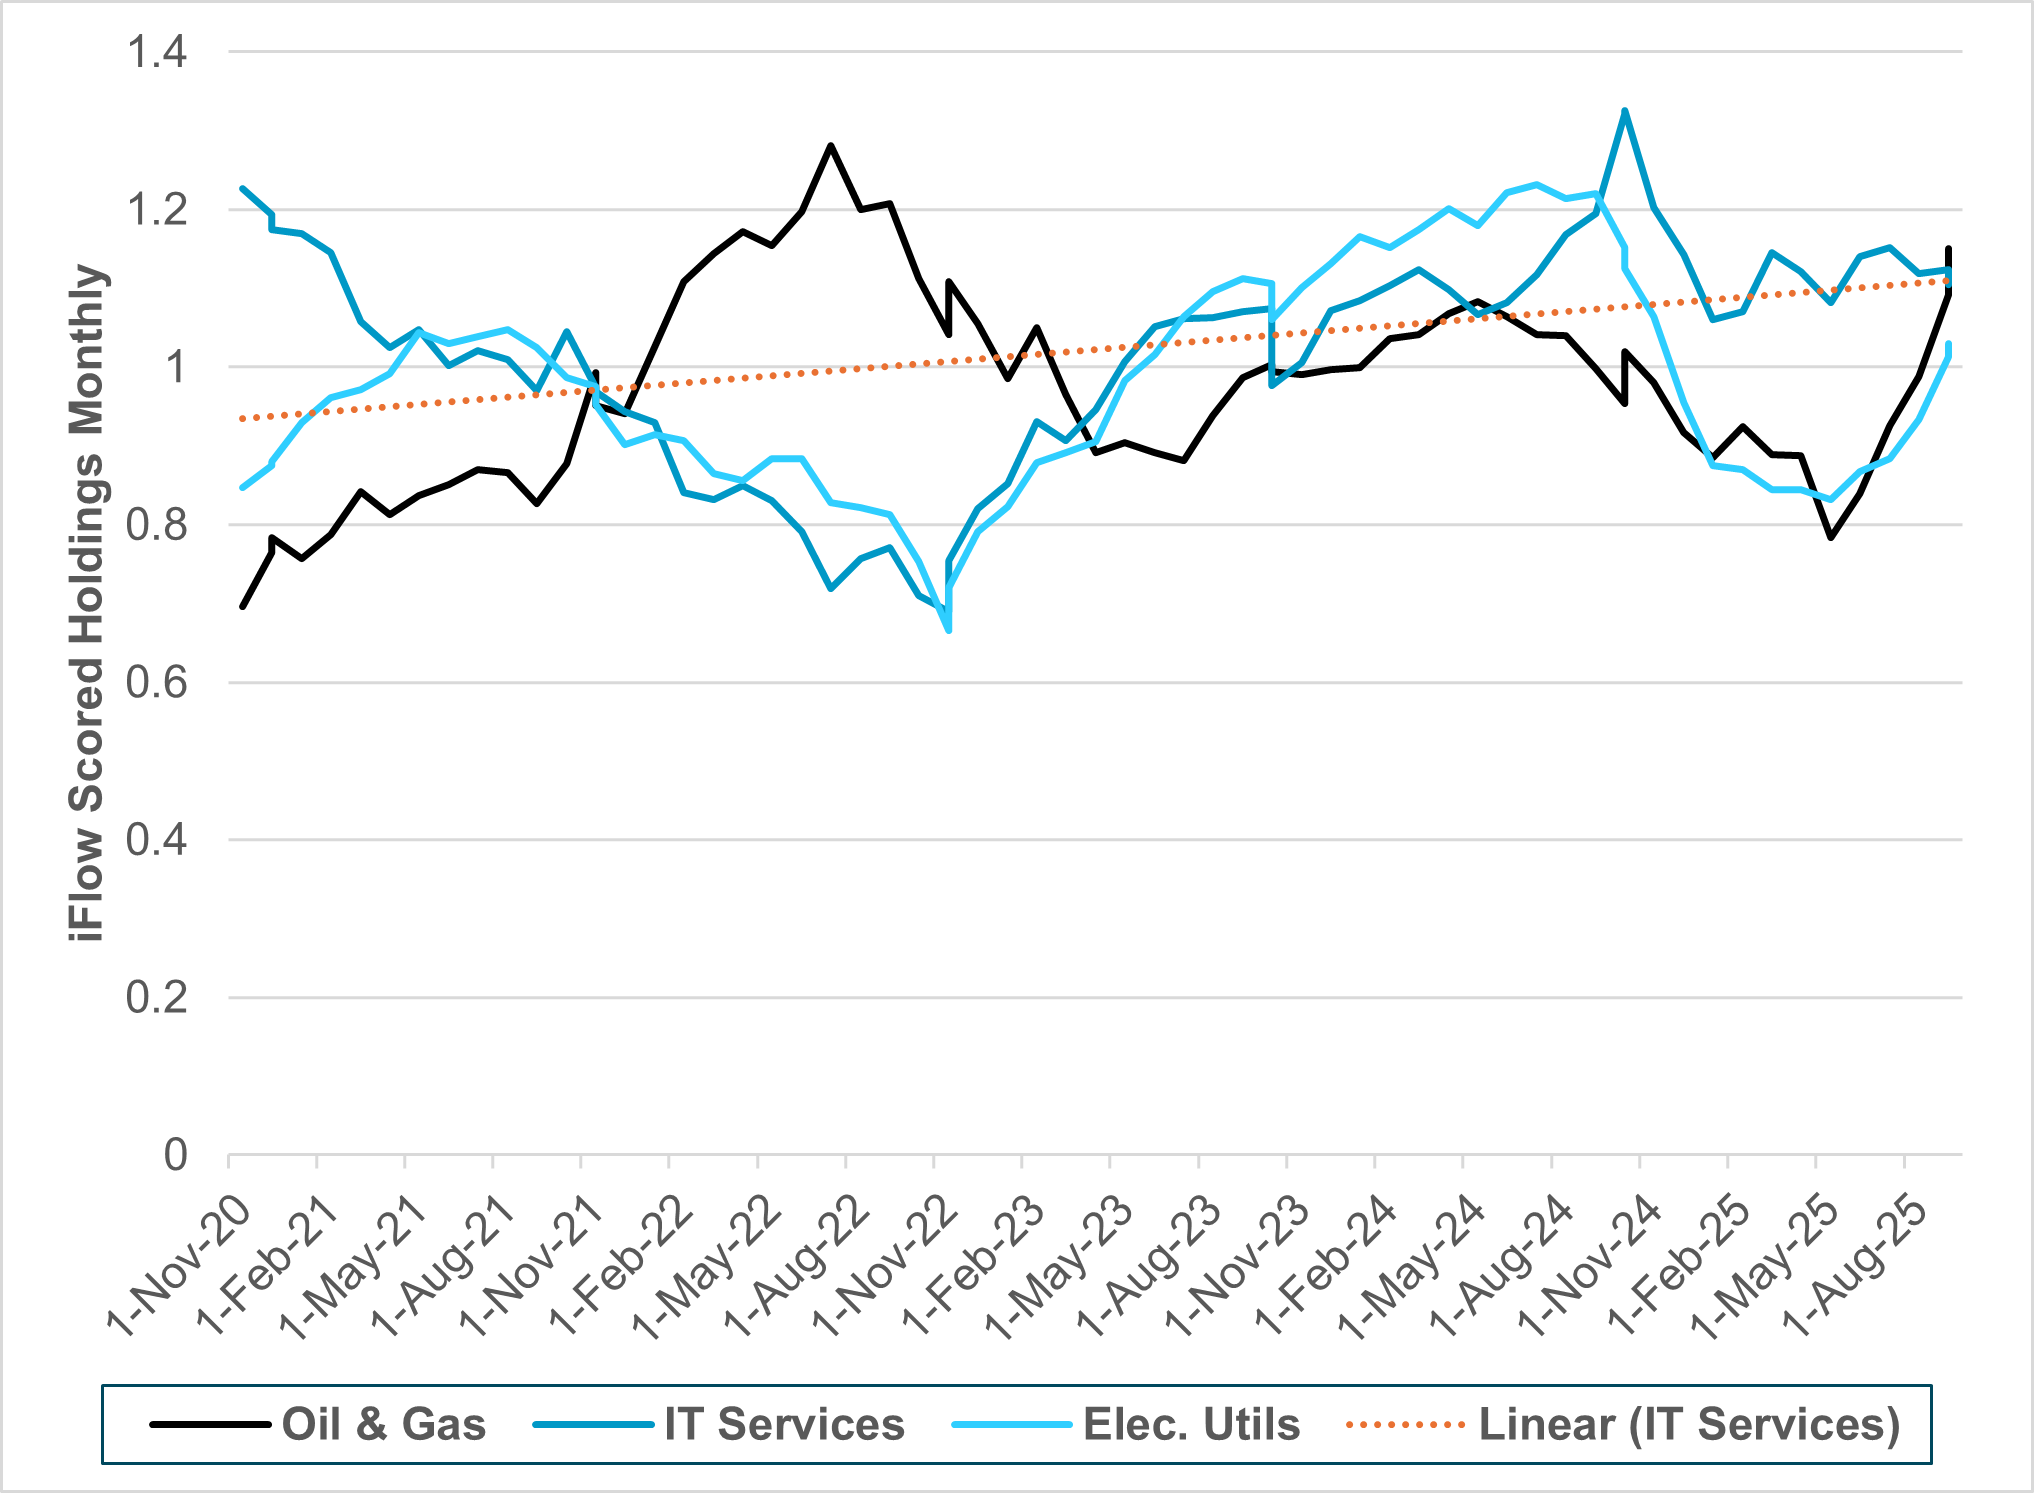
EXHIBIT #2: APAC DEVELOPED MARKET HOLDINGS OF KEY AI-LINKED INDUSTRIES
Source: BNY
Our take
In APAC developed markets, investors are holding more AI-linked industry shares. The most notable difference from U.S. investments is the increase in oil and gas holdings since “Liberation Day.” These shares are now 18% above the five-year average compared to 17% below in April, while IT service holdings are 8% above average, but remain on a sharply rising trend. The laggard is electric utilities, whose holdings are 6% above average. China accounts for 15% of total global spending on AI, matching the EU. China spent an estimated $75bn on AI in 2024, while the rest of the region spent $50bn.
Forward look
Investors see utilities and energy in lockstep in Asia, but not the U.S., suggesting there is a stronger cyclical signal from AI investments and growth in APAC. But given the higher-than-normal holdings this bounce-back in growth expectations for 2026 looks fully priced. Further, there is less concern about capacity constraints. Higher prices from energy, particularly electricity, to power data centers is less of an inflation-driver in the region. The only hyperscaler companies in the world outside of China and the U.S. are Naver Cloud in South Korea, G42 in the UAE and OVHcloud in France. Watching electricity capacity and use in China vs. the U.S. has become a barometer of AI use and demand.
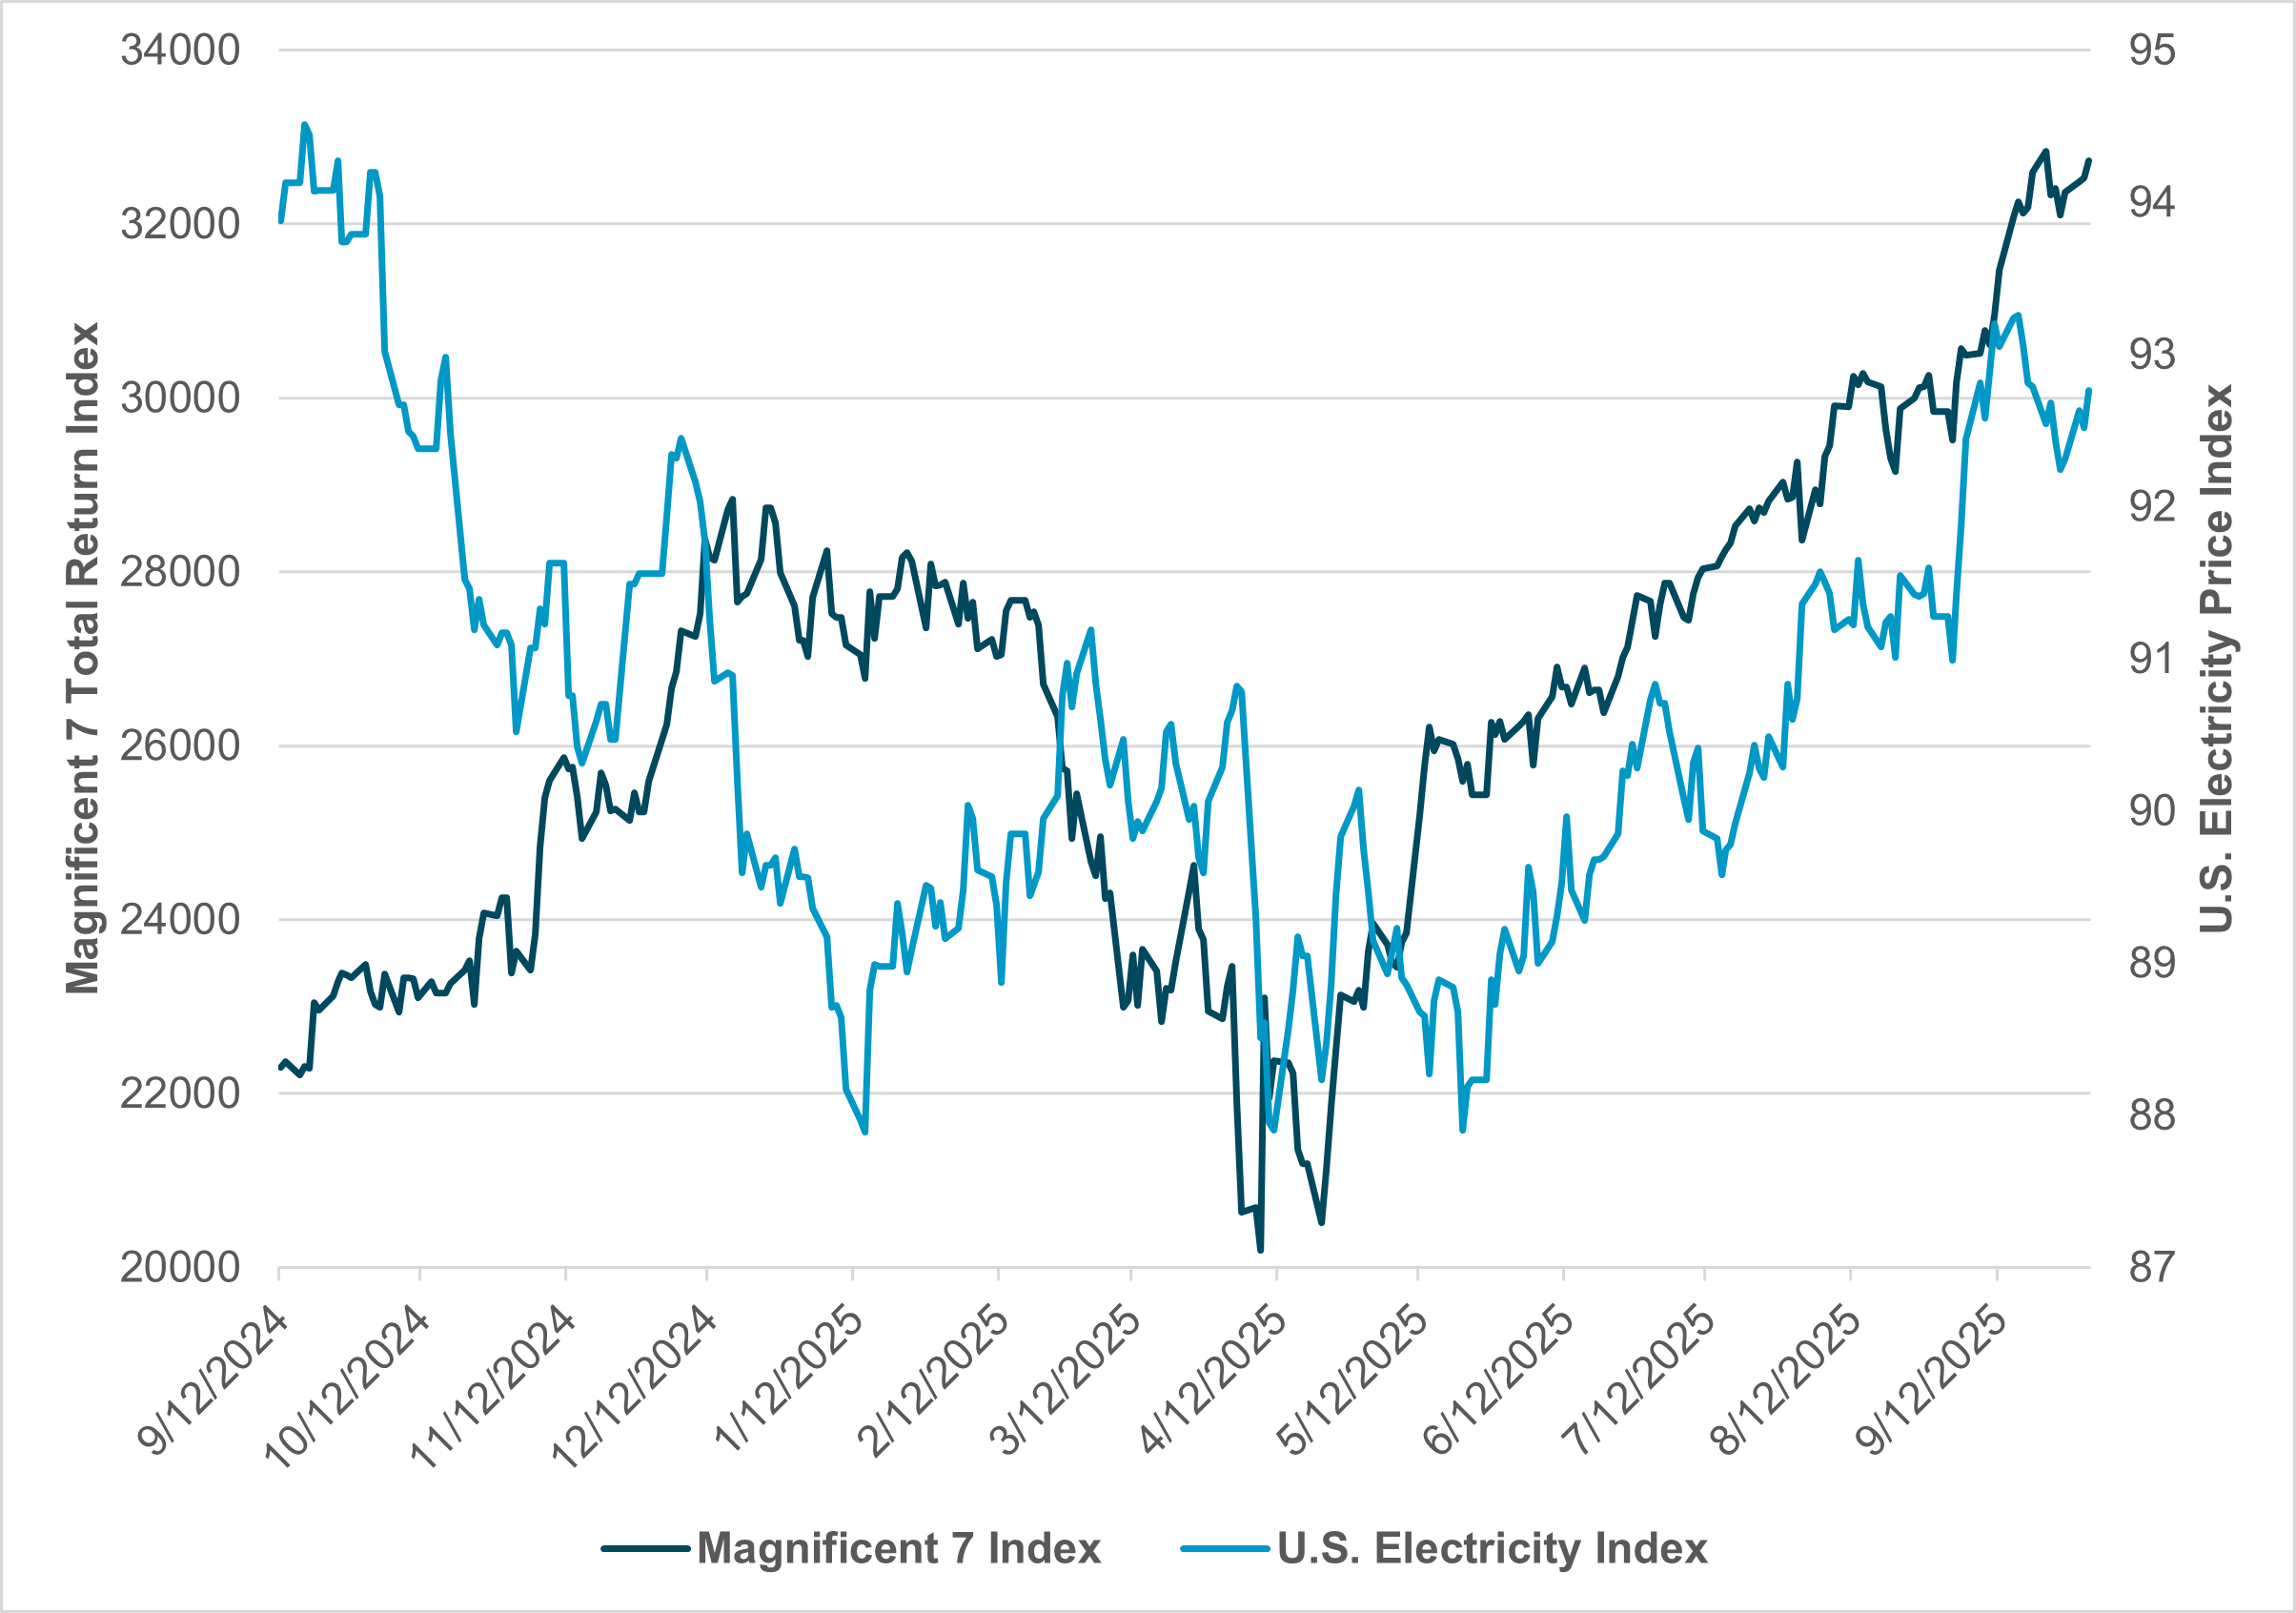
EXHIBIT #3: MAGNIFICENT 7 VS. U.S. ELECTRICITY PRICES
Source: BNY, Bloomberg
Our take
Since “Liberation Day,” U.S. technology shares have led buying-the-dip in global equities. The previous Magnificent 7 index rally in 2024 started when the Fed cut rates but flattened in December and wobbled when the Fed ended its easing. The connection between tech shares and rates was less clear in Q2 and Q3, however. Meanwhile, the correlation between inflation and Fed policy was clear in 2024 but less so in 2025, with the return of easing led by job concerns. The risk of electricity prices and inflation is clear, but how that drives the Fed’s reaction is less obvious now. It will be important to monitor the correlation between the U.S. electricity index and Magnificent 7 shares.
Forward look
We see the risk of an AI bubble and valuation reset linked to costs. The current momentum in AI investments and what it means for stocks and U.S. growth is unlikely to shift in Q4, but in 2026 the risks revolve around both inflation and the cost of money. Borrowing to build out more capacity may find a limit in Fed policy reactions. Not building out more energy supply to drive data centers could similarly limit growth and returns. The question for many investors is when the relationship between electricity and big tech shares will revert to a negative correlation again.
Near-term equity momentum remains underpinned by lower rate expectations and ongoing AI-driven capital investment, but the sustainability of this rally hinges on Q3 earnings as a stress test for margins, cash flows and returns on invested capital. While U.S. investors remain underweight in key AI-linked industries despite record spending, APAC investors are already stretched in holdings, suggesting more asymmetric risks across regions. The greatest vulnerability lies in electricity capacity and cost dynamics, which could reintroduce inflationary pressure and shift Fed policy responses in 2026. For now, hyperscaler investments in AI are providing a tailwind, but the medium-term outlook will depend on whether rising energy and funding costs cap the cycle or allow AI productivity gains to transform into broader economic returns.