Health check for international interest in US assets

iFlow > Investor Trends

Appearing every Wednesday, Investor Trends provides a deep dive into patterns and behaviors in equity, bond and currency markets around the globe, underpinned with deeper macro insights.

Subscribe to Our Publications

In order to start receiving iFlow, please fill out the form below.

Subscribe
arrow_forward
BNY iFlow Investor Trends

Key Highlights

  • “U.S. exceptionalism” has softened year-to-date, but still present
  • Home bias outside of the U.S. has picked up, but momentum is soft
  • European fixed income more self-funded, but pockets of U.S. value remain

Dollar: Cross-border hedging has picked up, but only commensurate with portfolio gains

EXHIBIT #1:  CROSS-BORDER HOLDINGS/HEDGES OF DOLLARS

Source: BNY

Our take

One of the biggest themes of the year has been the “U.S. diversification trade.” Due to material shifts in fiscal and monetary policy, global asset allocators have sought to ascertain the extent of diversification away from U.S. assets and “U.S. exceptionalism,” especially in favor of their own home assets. Globally, we have seen a renewed push for growth and productivity – an area where much of the world significantly lags the U.S. As savings generated by exports to the U.S. may decline up ahead, incentives materialize – by intention or otherwise – to make home markets more attractive. The “U.S. diversification” theme has mostly been seen through the lens of the dollar’s decline this year. The change in valuations is real and arguably necessary, but we would not overstate the role of institutional factors relative to rate differentials.

Based on our data, the only period of outright liquidation was in April, in the immediate aftermath of the uncertainty surrounding the launch of bilateral tariffs. Our data indicated a sharp decline in dollar hedges, which can only be explained by a reduction of hedges due to drops in net asset values. However, this process was swiftly reversed. Current hedging levels may be around 15% above the rolling 1-year average, but asset values have improved strongly as well. Our data indicate that under a 60%–40% fixed income portfolio, the net amount of dollar hedging is only around 5% above total return levels, whereas the year-to-date average indicates investors have been comfortable running net dollar longs.

Forward look

We highlighted in our recent weekly outlook that the end of Q3 has been a target for investors wanting to catch up on their hedging needs, and the rally in U.S. shares and the outperformance of U.S. bonds should force the issue. On the other hand, if markets believe that Fed pricing is at its maximum and there is a risk of further easing by core economies, such as Europe, Japan and China, we may have already reached the peak of rate differentials against the dollar. In other words, hedging costs of U.S. assets may only rise from current levels, and set the stage for a tactical greenback rally.

Equities: Cross-border interest in U.S. recovering since Q2

EXHIBIT #2: DEVELOPED EUROPE AND CANADIAN HOLDINGS OF EQUITIES VS. CROSS-BORDER U.S. EQUITY HOLDINGS

Source: BNY

Our take

Of all asset classes, “U.S. exceptionalism” has been manifested in U.S. equities. The investment and earnings growth narrative continues to outpace the rest of the world by far, but the only uncertainty revolves around the adequate valuations of growth in certain secular trends such as artificial intelligence and associated capital expenditure growth. Our data show that through the first quarter of this year, investors in developed EMEA and Canada (two key regions where we have good visibility on domestic investment in home markets) saw a sharp rise in allocations relative to the U.S. The defense theme was particularly strong in Europe, and was perhaps the first indication that there was an earnings growth and capital expenditure story outside the U.S. These gains were made independently of U.S. policy decisions, so we would not view theme through the lens of “U.S. diversification.” If anything, flows in April actually improved the U.S.’ standing, as markets realized that even with better domestic investment growth, it would be difficult for the rest of the world to disentangle or de-couple from U.S. demand structurally, and nor is that desirable. Since Q2, U.S. equities have resumed their strong performance and cross-border investors returned to U.S. markets in size.

Forward look

Cross-border holdings of U.S. equities relative to “home” holdings have made no headway since May, and we expect this to remain the case for the rest of the year. Furthermore, in several sectors we are seeing signs of overstretched positioning, such as the European defense theme. We expect non-U.S. investors to end the year with an improvement of around 10% in their allocation ratio relative to their U.S. holdings. Even so, given the absolute size of capitalizations, this won’t be sufficient to neuter the U.S. exceptionalism story, barring a significant adjustment in U.S. growth and corporate earnings expectations.

Short-dated bonds: European front-end inflows taking place independently of cross-border US Treasury flow adjustments

EXHIBIT #3: QUARTERLY SMOOTHED FLOW, 1-3Y GOV’T DEBT, CROSS-BORDER INTO US VS. TOTAL INTO EUROPE

Source: BNY

Our take

The U.S. dollar is the world’s reserve currency and U.S. Treasurys the world’s preferred reserve asset. The asset’s status has been tested time and time again and we have not seen any material sign of active reduction in allocations. The U.S.’ trade posture means there will be adjustments in global balance of payments, limiting reserve growth, which would have an impact on future flows into U.S. Treasurys. However, this is materially different to active liquidation of current holdings. Official U.S. Treasury custody data show a small decline of $36bn (or 0.4% of total) in April, but otherwise official holdings of U.S. Treasurys have increased every month of the year as of July. Our data broadly agree with this view. There were cross-border outflows around April, but overall interest is positive across most maturity buckets.

Nonetheless, we acknowledge that global investors have poured more funds into home markets. Nowhere is this more apparent than in developed Europe, where since Q2, flows into France and the U.K. have been exceptional, even though these are the markets with the highest levels of near-term pricing of sovereign risk, and further deterioration is possible as new budget proposals are put before parliaments later this year. There has been a rise in supply due to the defense narrative, helped by Germany’s policy shifts, but our data indicate that yields remain the main driver of demand. Cross-border purchase of U.S. Treasurys remain intact due to higher yields and also a much cheaper dollar – the latter is essential to maintain foreign interest, and our data suggest that funds are being pulled from the U.K. gilt market by external investors due to sterling strength.

Forward look

Without Germany’s constitutional adjustments and changes in defense spending posture, it is difficult to see whether yields would have improved enough to see flows at their current level. Local interest is strongest in the 1y–5y part of the European curve, and this is where we expect additional issuance to come through. Budgetary discussions at the EU level will likely indicate increased supply and more joint issuance, but we are less confident on the near-term European growth narrative. This means the risk to the entire curve is for further flattening, and this may encourage European savings pools to once again look at the U.S. Treasury market due to expectations for higher terminal rates.

Long-dated bonds: European duration’s outperformance a very recent story, U.S. 10y+ well-bid through the year

EXHIBIT #4: QUARTERLY SMOOTHED FLOW, 10Y+ GOV’T DEBT, CROSS-BORDER INTO U.S. VS. TOTAL INTO EUROPE

Source: BNY

Our take

Looking at cross-border flows for the entire U.S. Treasury curve, we note that it is in the longer dates where performance has been the most consistent. Although in absolute terms, net flow scores are not strong – it is the only part of the curve which saw unbroken purchases between Inauguration Day and the end of July. Even in early April, we can see that there was virtually no disruption to cross-border flows into the U.S. Treasurys with maturities above 10y (Exhibit #4). In contrast, European sovereign flows fell sharply and did not recover into positive territory until the end of July. Strong selling of non-core Eurozone and long-dated U.K. gilts (the U.K. has an exceptionally long maturity profile) were broadly driving net sales, as steepening even led to some liquidity concerns, which ultimately was not an issue for the U.S. Treasury market. Like other parts of the curve, we believe that the U.S. dollar’s decline complemented the much-improved yield profile for international investors. The U.S.’ fiscal path at the time also generated some market concern, but we did not identify any discernible drop in global interest during the approval process of the “One Big Beautiful Bill Act.”

Forward look

More recently, we have seen a dip in cross-border demand in the U.S. 10-year segment and some additional surge flow has taken place in Europe. Rather than view flow changes through the lens of fiscal risk, we believe recent developments continue to highlight the role of rate differentials as cross-border investors remain sensitive to levels of U.S. yields across the curve. The material shift in expectations for U.S. policy rates was seen as justified by U.S. data changes, and the fear of additional bear steepening due to excessively low U.S. real rates has subsided for now. To be clear, we believe that there needs to be a strong real yield anchor, and this has been the driving force behind the firm interest in developed market sovereign debt in Latin America and Central and Eastern Europe. However, the U.S. Treasury continues to benefit from reserve status, which increases tolerance thresholds for real yields, thereby limiting any severe cross-border liquidation. The bottom line is that the market remains comfortable with the current Fed path, and early September flows indicate that interest is already returning to the long-end of the Treasury curve by cross-border investors. If wage and inflation numbers continue to decline ahead at a faster pace than rate cuts, U.S. duration may even see a surge flow based on more favorable real-rate developments, not unlike our outlook for the dollar.

Corporate credit: Asset class is unloved globally, but U.S. outperformance is consistent

EXHIBIT #5: DEVELOPED EUROPE AND APAC HOLDINGS OF CORPORATE CREDIT RELATIVE TO CROSS-BORDER HOLDINGS OF U.S. CORPORATE CREDIT

Source: BNY

Our take

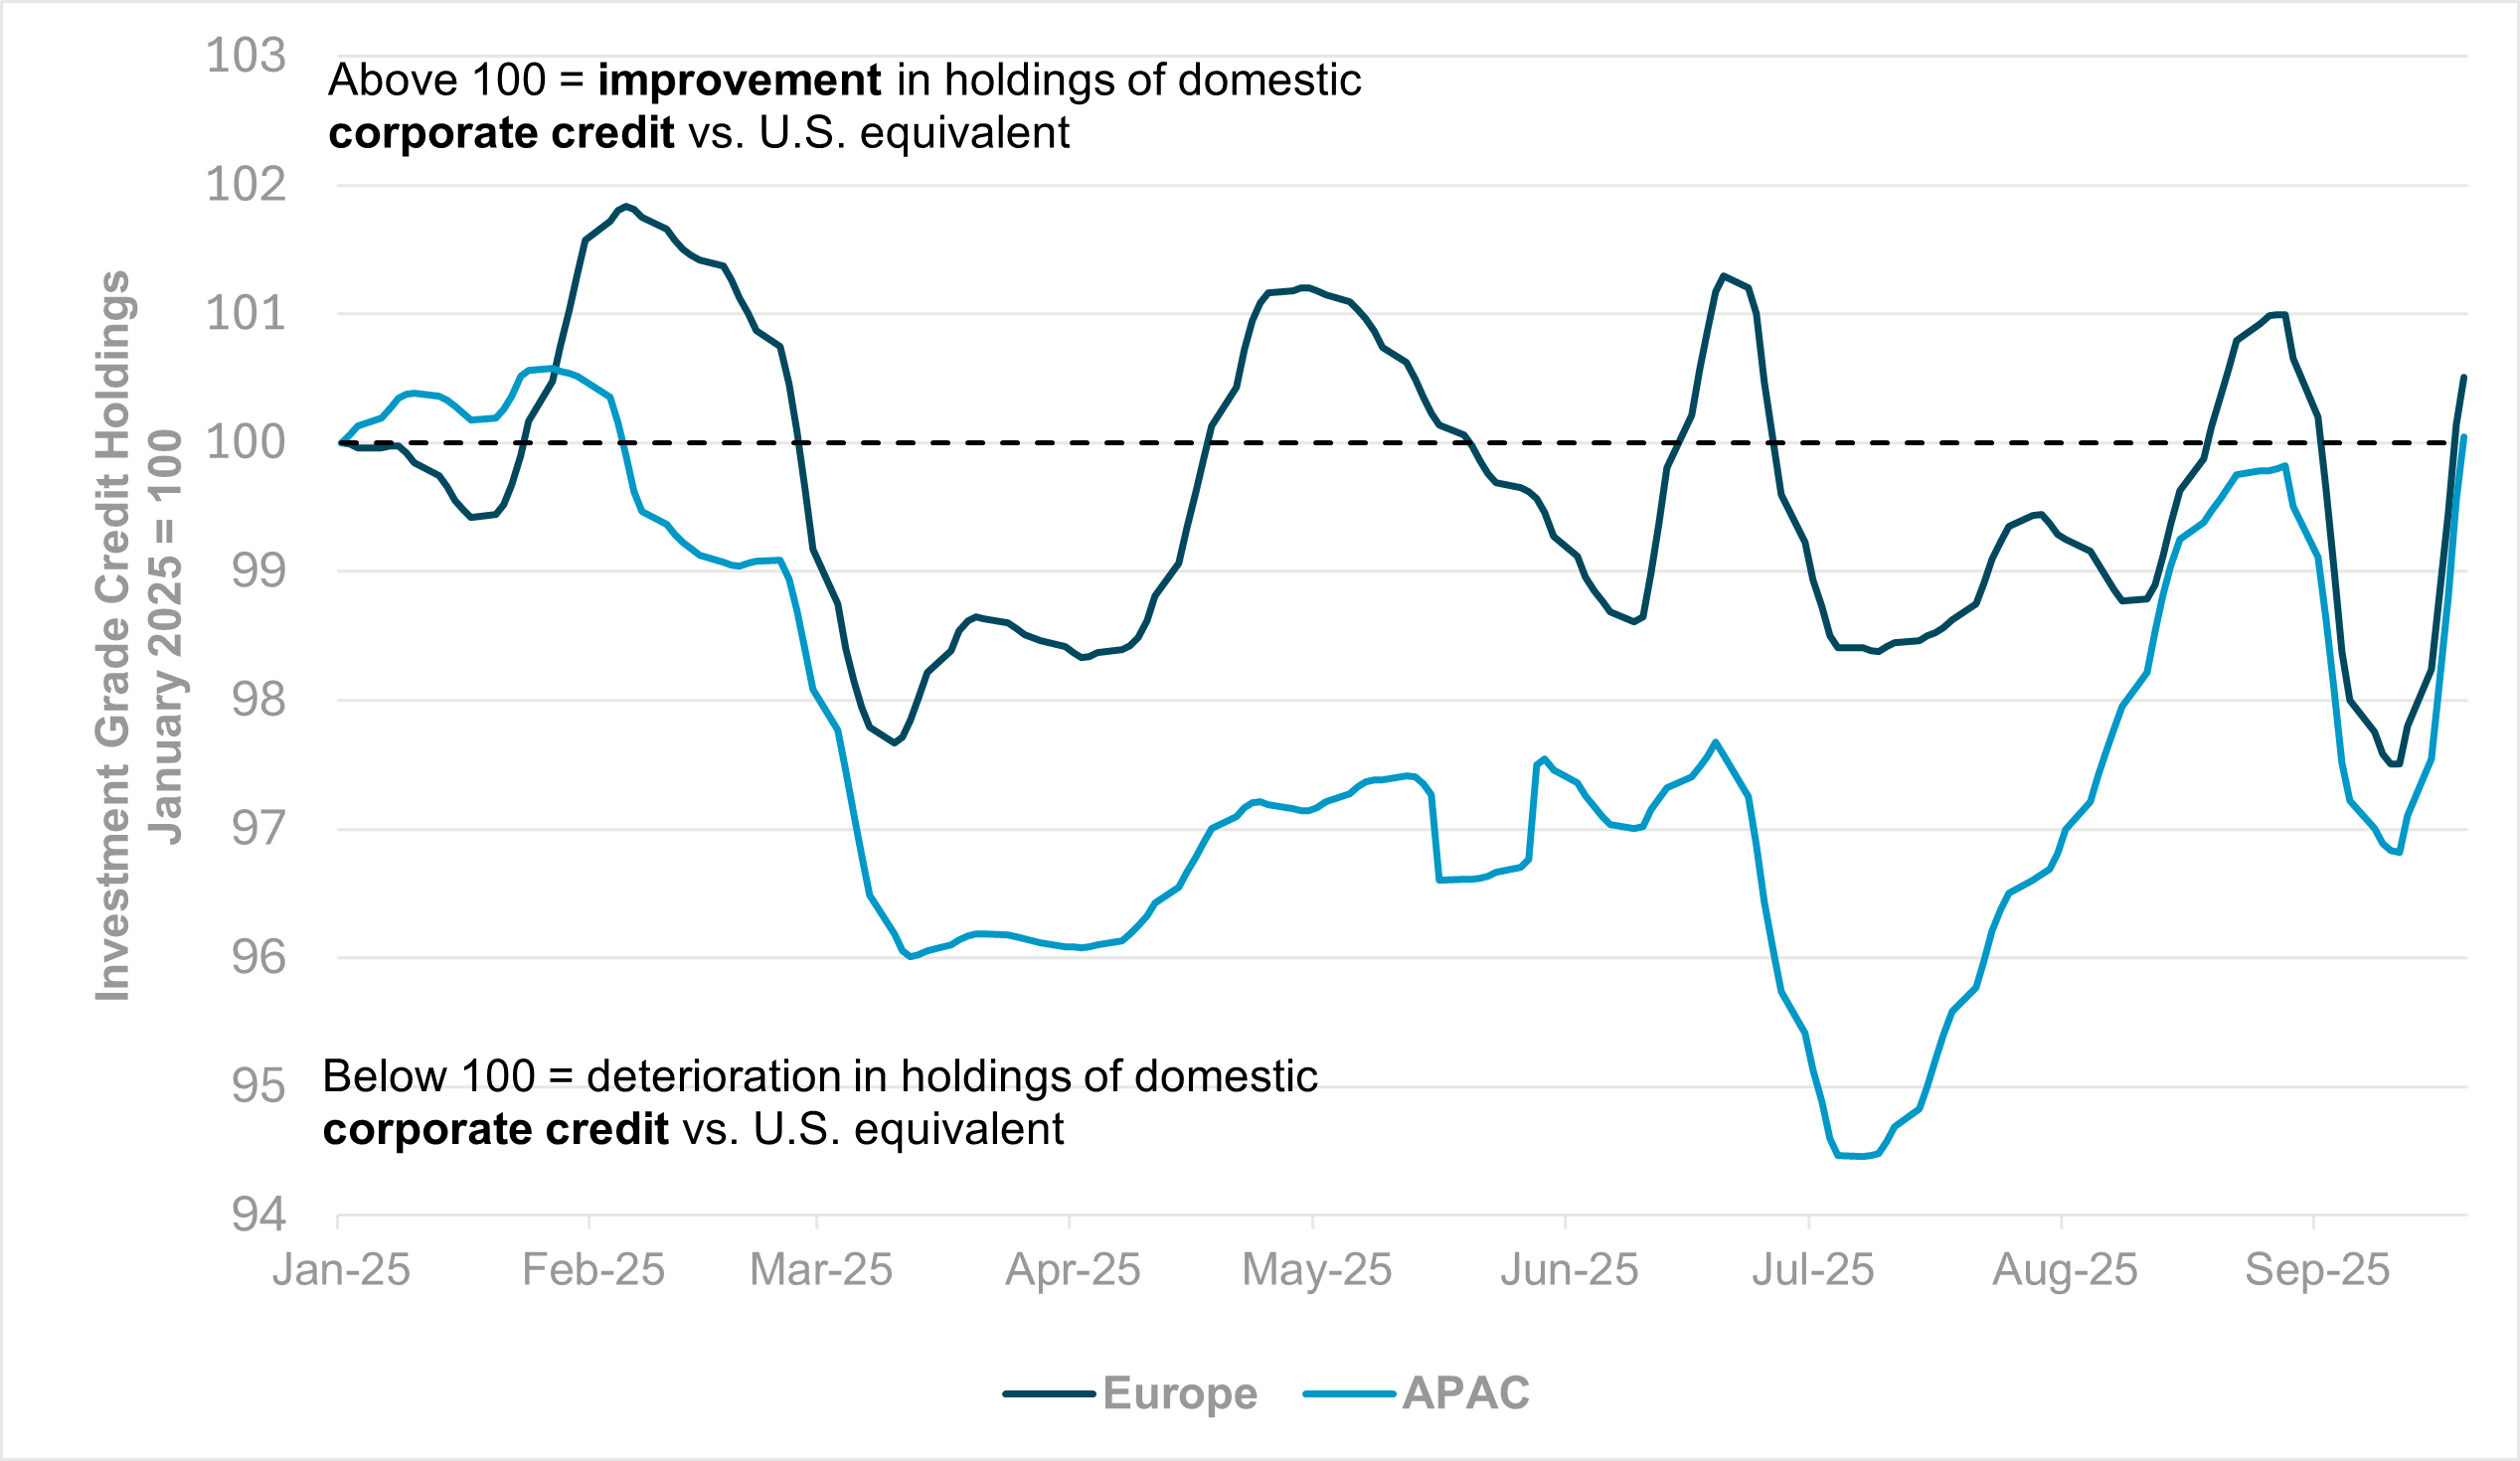
Corporate credit has been one of the weakest performing asset classes globally over the past two years. Simply put, there hasn’t been enough risk/yield compensation in this asset class relative to U.S. equities for several years. There has been no material sign of financial stress, but the consistent selling seen in our data, irrespective of issuer or investor domicile, is a simple indication that there is very low risk-reward in the market. We believe that there has been considerable liquidation throughout the past few quarters where proceeds are redirected into equities or private markets. Even in such an environment, U.S. corporate credit continues to outperform comfortably. Like our assessment of cross-border investment in U.S. equities, we measure the level of holdings for non-U.S. corporate bond markets (which captures investments by local investors) relative to cross-border holdings of U.S. credit (investment grade only). We find that that apart from some gains in mid-Q1, European corporate credit has been struggling to make headway and for the most part, relative holdings in the U.S. have been stronger. For Asia-Pacific, the story is even worse – during the summer selling was far more intense in this space, though we suspect that similar to the U.S. and global theme for the asset class, selling picked up to fund equity positions.

With Fed easing in place and global nominal yields relatively low, financial conditions will continue to support the asset class but the structural issues facing the market, such as liquidity constraints and competition from alternatives will continue to impact overall demand. On the remaining criteria, the U.S. is still seen as the “least bad” market due to depth, diversified instruments and, crucially, yield levels. Should U.S. credit begin to underperform due to economic factors, it will be difficult to see rotation into the rest of the world, as the market will not be large enough nor have the risk profile to absorb such flows.

Forward look

We do not see credit as being material to the overall theme of diversification away from the U.S. The market itself is facing some secular issues but global easing should be sufficient to anchor demand for now. Recently we highlighted that global flows had reached their best levels year-to-date: European junk bond CDS fell to their lowest levels in three years ahead of the ECB decision and even low-yielding Asia-Pacific credit began to see inflows, but the strongest interest globally was still in U.S. markets on an aggregate basis. As the Fed continues to cut rates and with equity valuations likely proving prohibitive, credit has become the fallback for investors seeking yields, especially as inflation remains stubborn and some real protection is necessary, but only on the margins. Either way, this is the market where we expect global investors to show the strongest preference for the U.S. market relative to home jurisdictions.

Bottom line

Our data show that cross-border investors’ holdings of “home” assets have improved relative to their U.S. asset holdings this year, but it has not been a one-way street. In equities, domestic (non-U.S.) allocations peaked around mid-May but since trade truces and deals were achieved between the U.S. and major partners, U.S. exceptionalism has returned. In bond markets, Europe is becoming far more self-funded but this is to be expected of an economy with relatively high historical savings rates which has seen a sudden shift in fiscal stance. Furthermore, this has not taken place at the U.S.’ expense – especially in long-dated Treasurys. In corporate credit, U.S. markets generally continue to outperform and were never at serious risk of facing large-scale liquidation due to the breadth and depth of the market. The only sign of caution has been manifested in more elevated hedging of the dollar, which is to be expected given valuation changes. Except for the extremities seen in April, hedging is progressing at an incrementally stronger pace compared with asset improvements. Even with the Fed’s updated trajectory, we expect the dollar to retain high carry status relative to global peers, and there is scope for a tactical recovery through year-end as easing resumes elsewhere. Non-U.S. investors continue to struggle for alternatives which offer yield and liquidity in equal measure.

Chart pack

Media Contact Image
Geoff Yu
EMEA Macro Strategist
Geoffrey.Yu@bny.com

Ready to grow your business? Speak to our team.