T-bills, liquidity risk and foreign demand
iFlow: Short Thoughts
Published on Tuesdays, Short Thoughts offers perspectives on US funding markets, short-term Treasuries, bank reserves and deposits, and the Federal Reserve's policy and facilities.
iFlow: Short Thoughts
Published on Tuesdays, Short Thoughts offers perspectives on US funding markets, short-term Treasuries, bank reserves and deposits, and the Federal Reserve's policy and facilities.

John Velis
Time to Read: 4 minutes
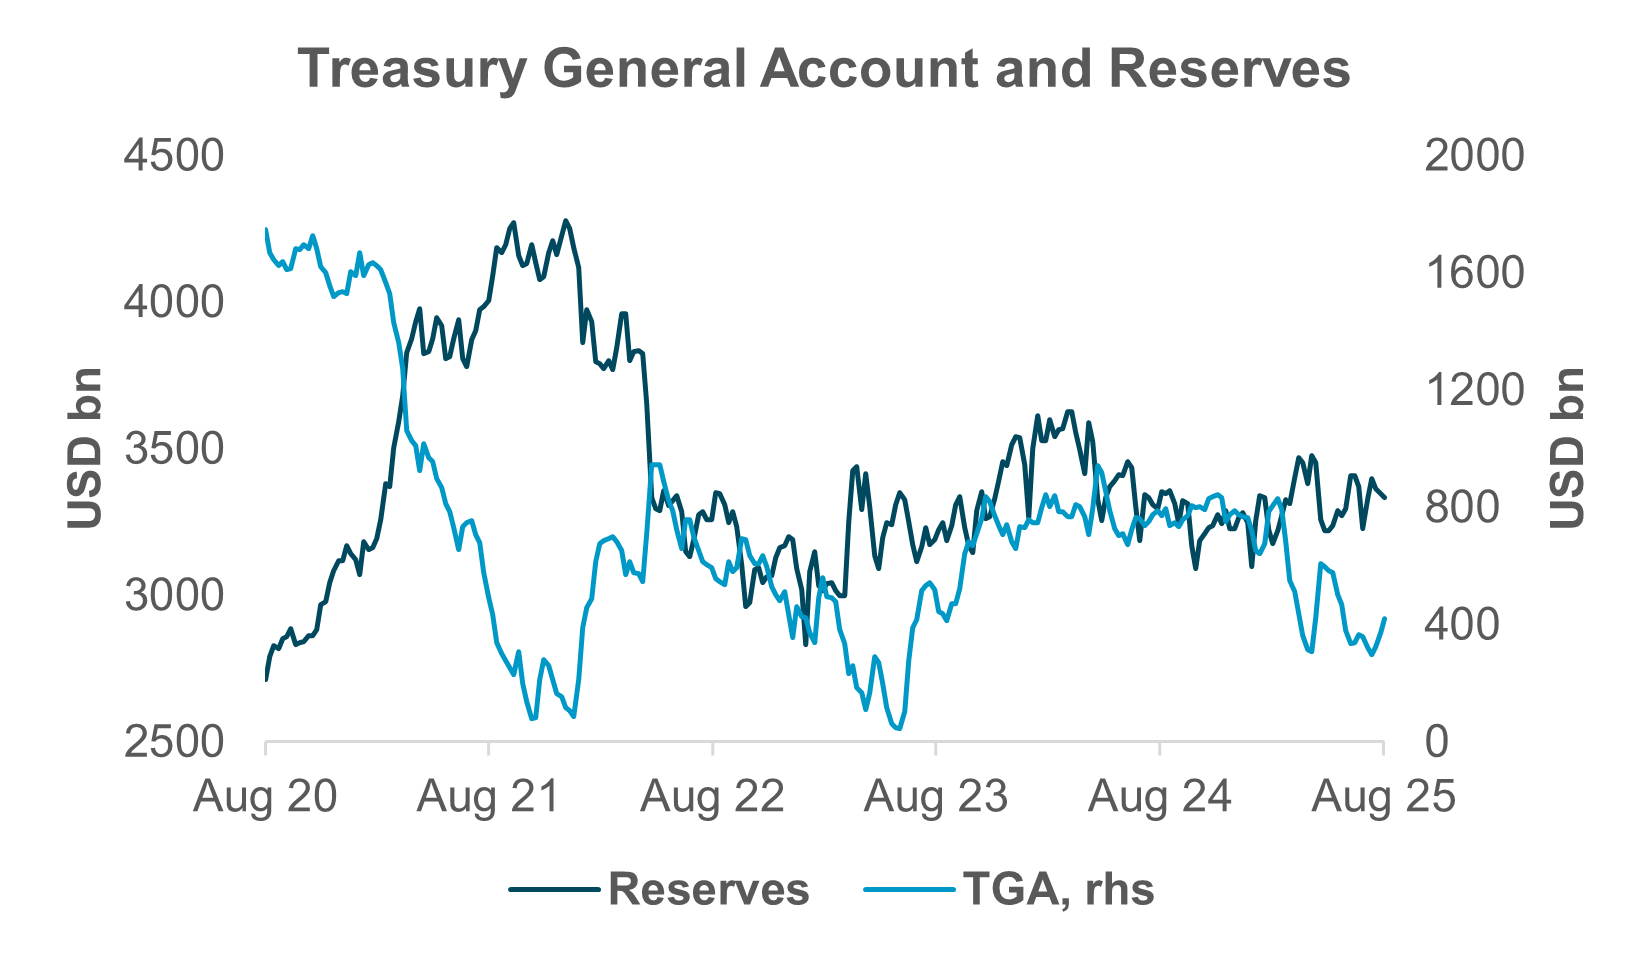
EXHIBIT #1: RESERVES HANGING ON EVEN AS TGA IS REBUILT
Source: BNY Markets, Board of Governors of the Federal Reserve System
Net T-bill issuance has been close to $325bn since the beginning of July, following implementation of the Republicans’ tax and fiscal package, formerly known as the “Big Beautiful Bill.” Between mid-February and the end of May, net issuance was actually quite negative, down by –$670bn, as Treasury curtailed debt issuance due to the presence of the debt limit. We’re still working our way back from that extended dip in supply, but we expect T-bill issuance to accelerate into September and October as indicated by the Treasury’s quarterly funding announcement at the end of July.
We have written about the associated drop in reserves we expect to see as bill issuance grows. We expected to see lower daily balances in the reverse repo facility, and indeed that has been the case since bill supply increased several weeks ago. In recent days, total usage of the reverse repurchase facility at the Fed has been running well under $100bn, and we don’t see any reason for that trend to reverse. Furthermore, the Treasury General Account (TGA), which had been run down to $260bn in mid-June, is closer to $500bn, well on its way to the $850bn steady state Treasury has identified.
At the same time, system-wide reserves have remained flush. As Exhibit #1 shows, reserves have been above $3tn for most of the last three years. Why, with increasing bill supply and falling RRP balances on the liability side of the Fed’s balance sheet, are we not seeing reserves drain? To us, this is because we are still only about halfway through the process of leveling up bill supply from the when it was curtailed during the budget process. Furthermore, and relatedly, the TGA refill is just barely half completed. We expect continued, and maybe even increasing acceleration of bill issuance, and combined with depletion of the RRP, the level of reserves should finally start to decline.
Exhibit #1 shows the inverse relationship between the TGA and reserves, and we don’t expect this relationship to change. We expect to see reserves fall measurably in September, and we alert readers to a scheduled corporate tax deadline on the September 15. This should also lead to a drop in reserves. September funding markets could be challenged, and money market rates might come under pressure. We’ll be looking for any commentary out of the Fed regarding balance sheet issues as well as for any usage of the Fed’s standing repo facility.
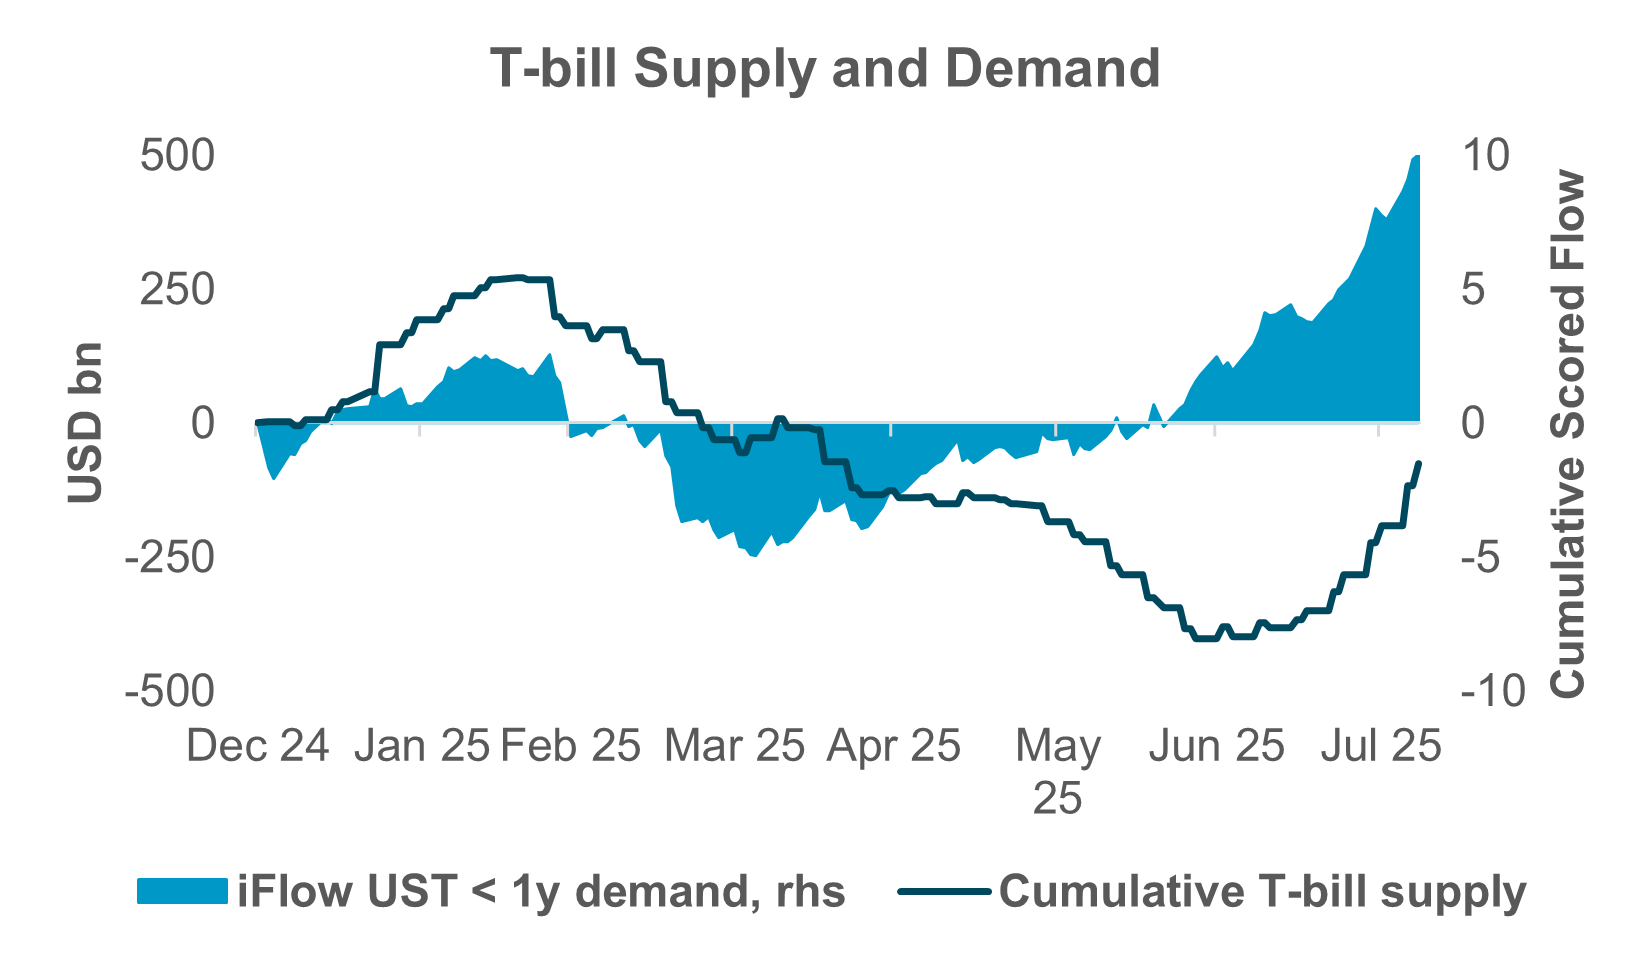
EXHIBIT #2: T-BILL DEMAND IS INELASTIC
Source: BNY Markets, iFlow, U.S. Treasury
We have long been of the opinion, verified by our iFlow data – as well as industry-sourced data on money market mutual funds (MMFs) – that demand for T-bills is inelastic: supply rarely fails to find adequate demand. This is true even in periods of significant ramp-ups in issuance, including the current episode. Exhibit #2 shows cumulative net T-bill issuance and cumulative real money purchases of USTs with a maturity of less than 1y – mainly bills. Note the contours of the two series match each other well this year – as they do over longer samples as well.
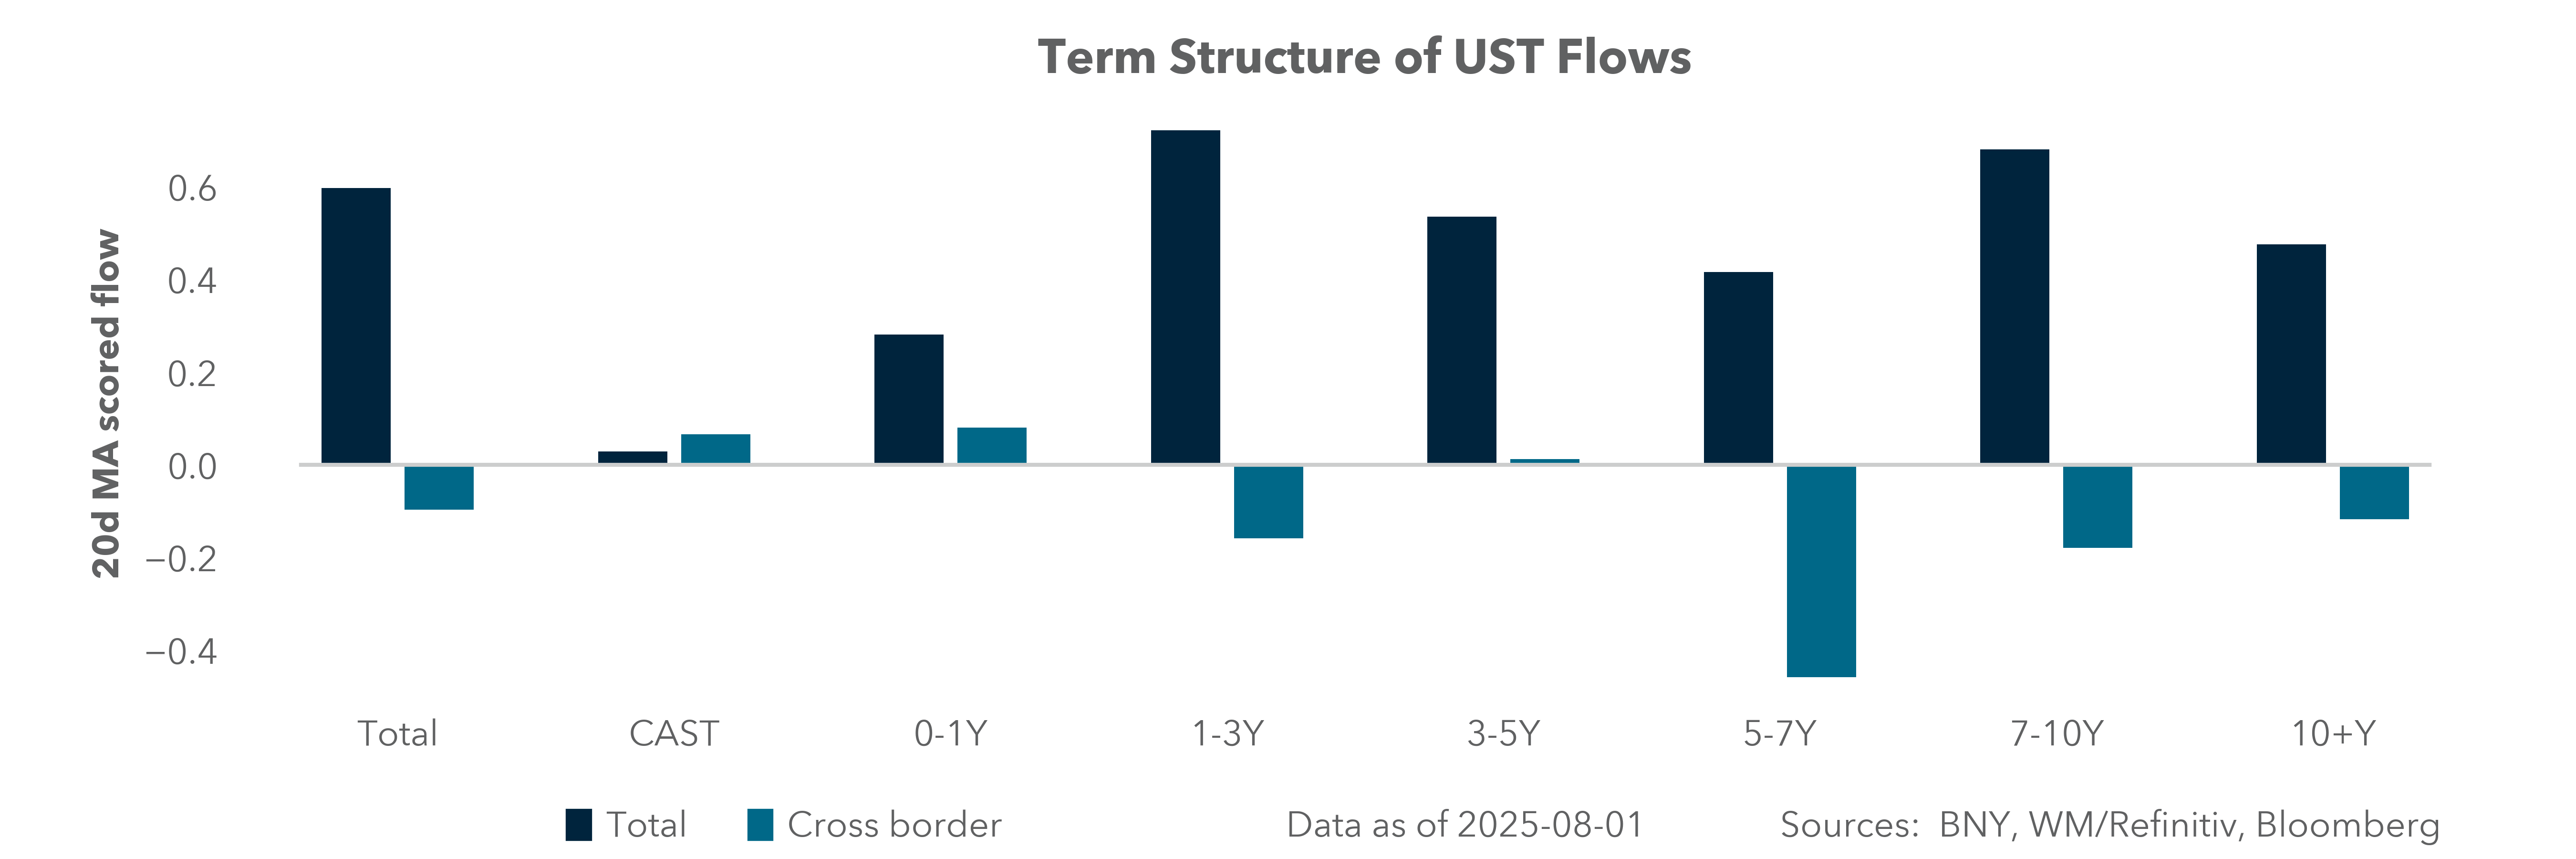
What is interesting to us, that cross-border investors have not been big buyers of bills this year; almost the entire increase in demand has come from domestic sources. We have frequently discussed the waxing and waning of foreign demand for USTs and have pointed out that through the first several months of the year, and certainly in April during the “tariff tantrum,” cross-border inflows were generally negative as overseas investors sold their UST holdings down. However, we have also pointed out (see here, for example) that since that time, demand from outside of the U.S. has been quite solid.
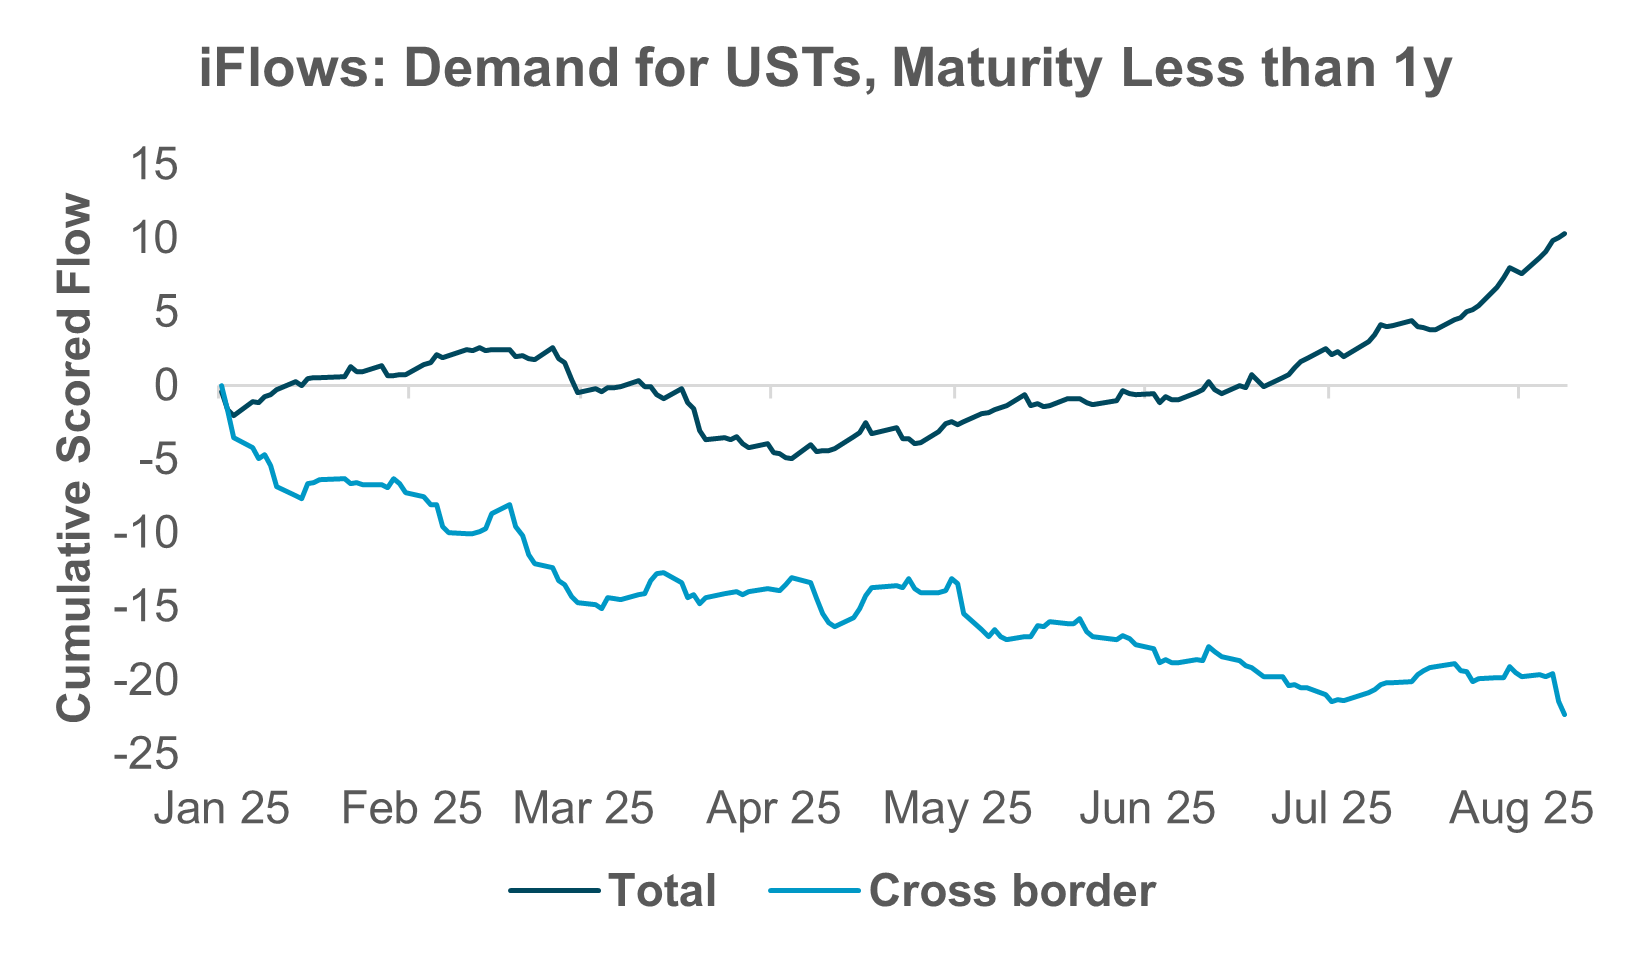
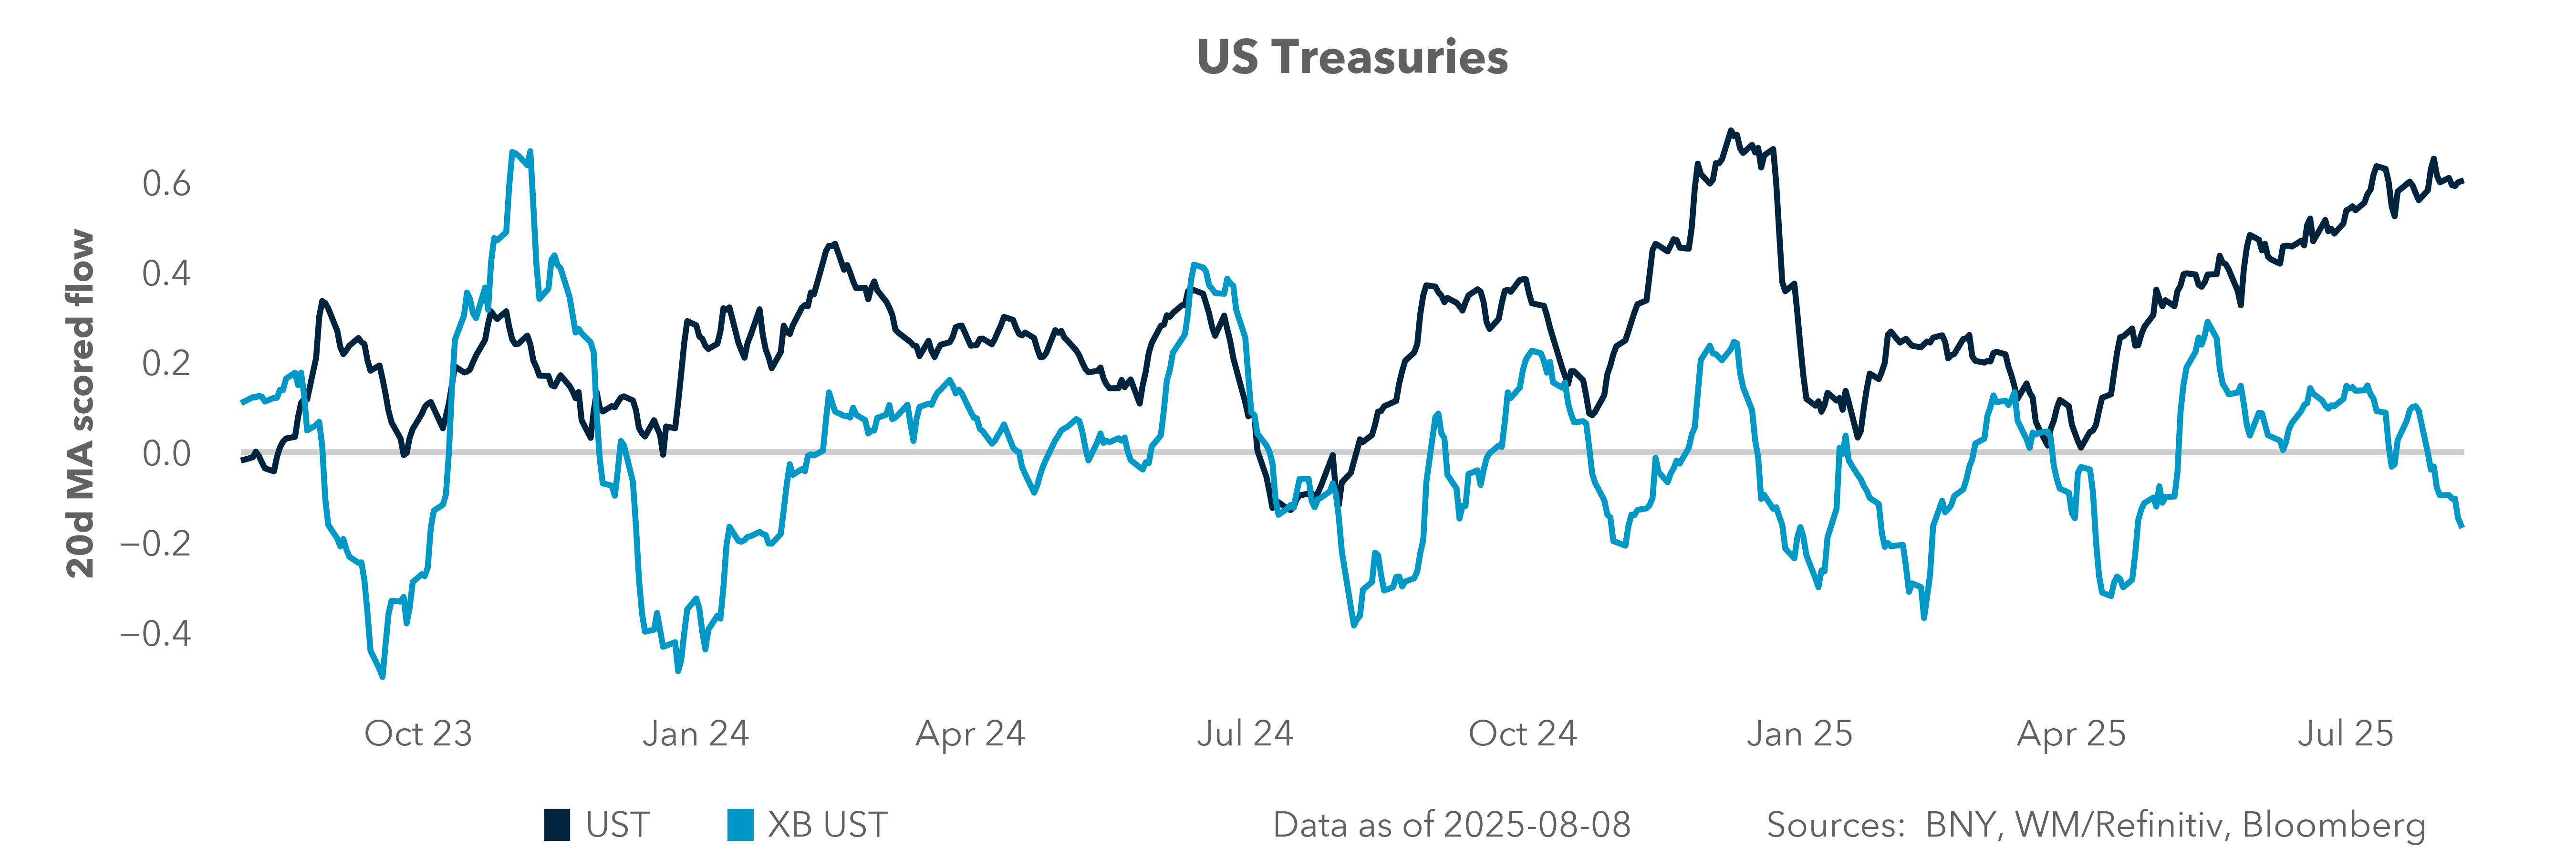
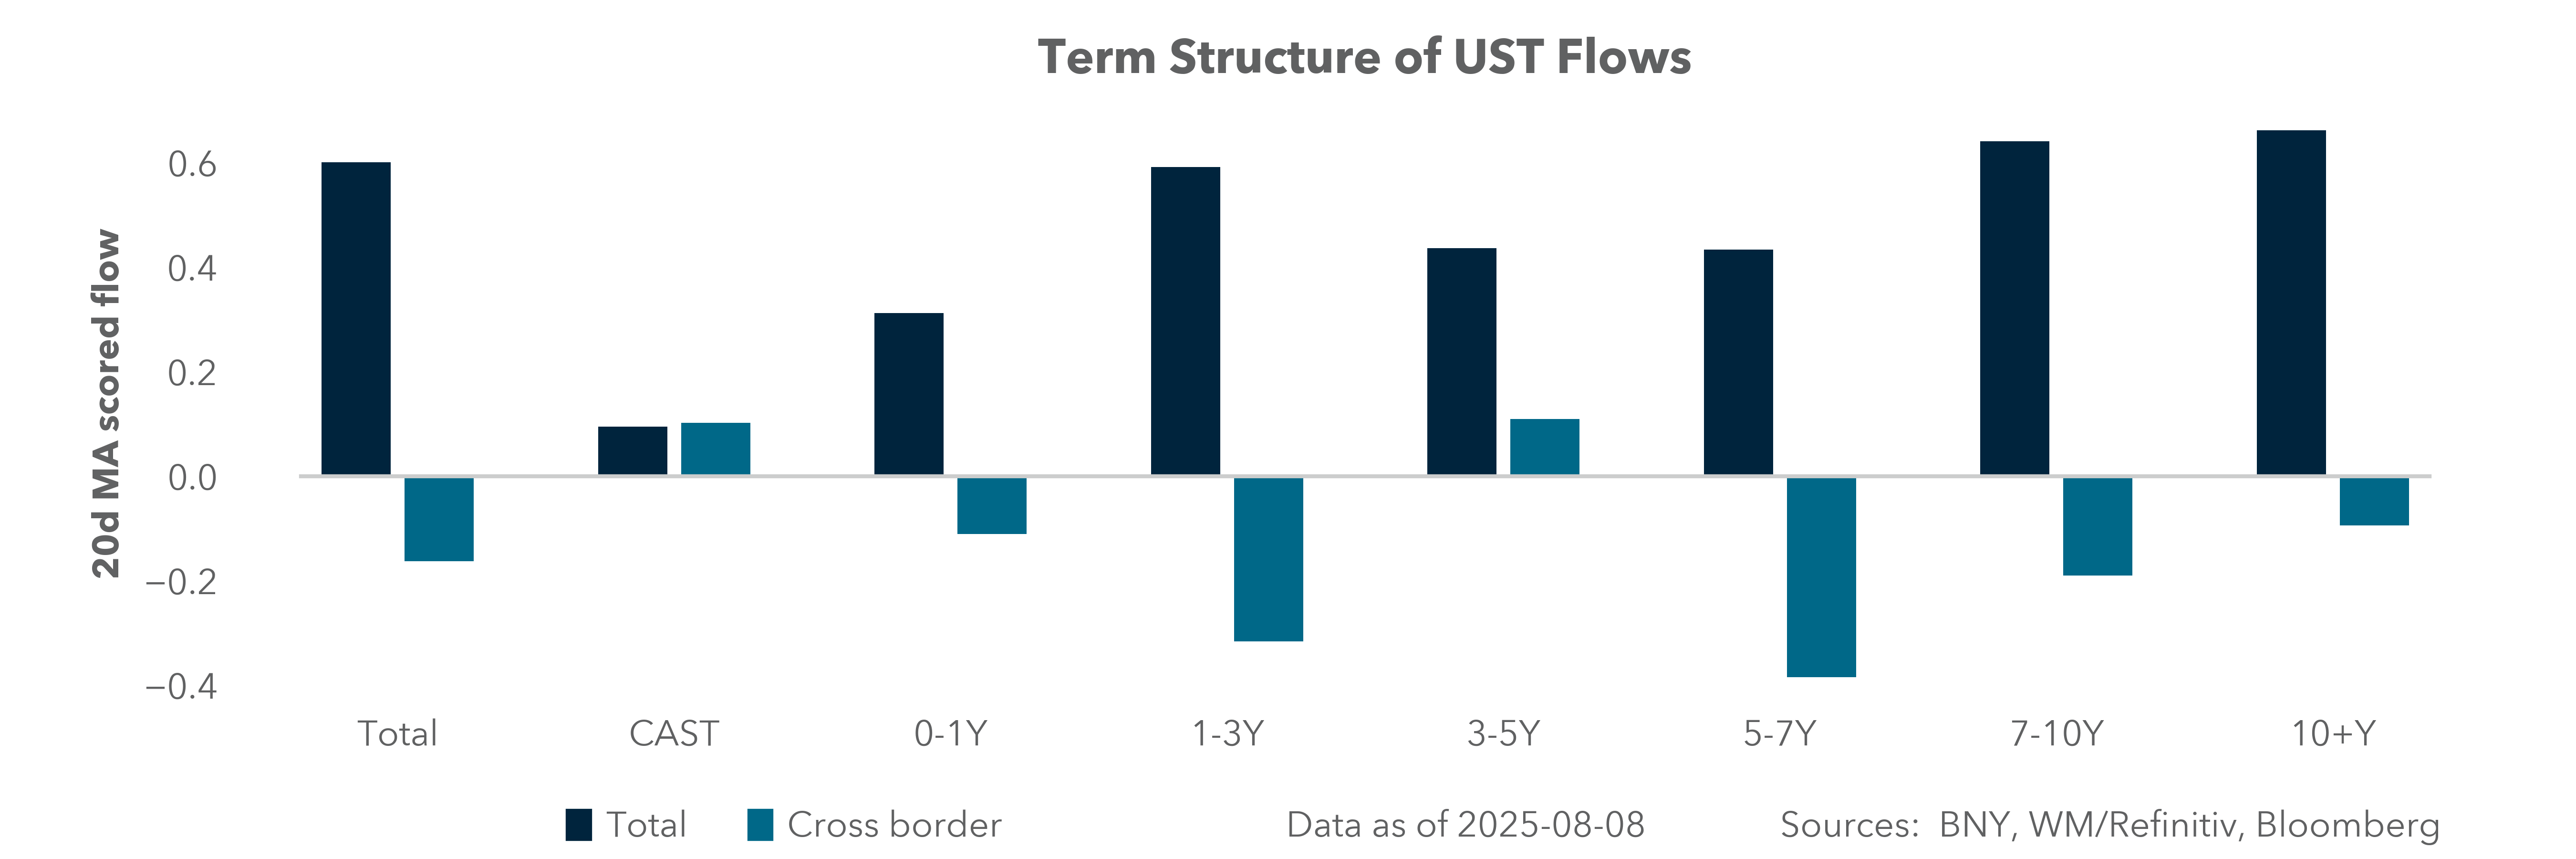
EXHIBIT #3: FOREIGN FLOWS INTO T-BILLS HAVE NOT RECOVERED
Source: BNY Markets, iFlow
This is not the case in short-dated maturities, as Exhibit #3 shows. While the previous chart showed how demand and supply for T-bills follow one an another, Exhibit #3 highlights a lack of cross-border inflows. The gap between the darker and lighter blue lines represents the difference between foreign and domestic purchases. Almost the entirety of U.S. T-bill supply is being bought domestically, with scant, if any, interest from abroad.
This could become an issue in coming quarters, as the pool of T-bills increases according to the Treasury’s recently announced guidance. In general, relying disproportionately on short maturities when funding the government can be problematic. Interest rate and rollover risk are the obvious candidates. By eschewing longer maturities, Treasury is wedding itself to interest rate movements at the short end of the curve, which are themselves influenced significantly by monetary policy and inflation. Furthermore, significantly expanding T-bill quantities can lead to funding risks, in line with what we have discussed above – growing bill supply pressures system liquidity. It can also lead to “fiscal dominance,” where the government’s liabilities are so high and the need to fund them at sustainable interest rates makes it politically and fiscally risky for the Federal Reserve to raise rates, even if economic conditions warrant.