Market Movers: Price Discovery
Market Movers highlights key activities and developments before the U.S. market opens each morning.
Market Movers highlights key activities and developments before the U.S. market opens each morning.

Bob Savage
Time to Read: 10 minutes
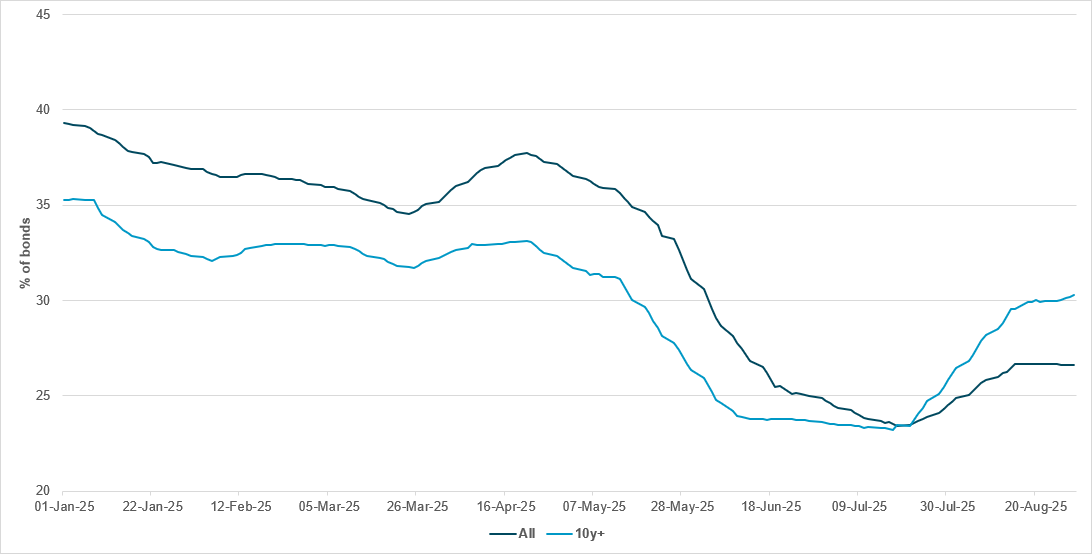
SHORT UTILIZATION RISING IN DEVELOPED MARKET EUROPEAN SOVEREIGN DEBT
Source: BNY
The combination of political risk and elevated inflation is creating significant challenges for European economies this morning, with borrowing costs on 30y bonds in both France and the U.K. rising to multi-decade highs, highlighting growing market unease. While the sources of political uncertainty differ between the two countries, asset allocation behavior is beginning to shift in response. Over the past few weeks, short utilization at the long end of developed European sovereign debt curves has moved above aggregate levels for the first time this year, signaling a notable change in positioning and increasing concerns around duration risk. Although inflation expectations at the front end, particularly for the Eurozone, remain relatively well-anchored, longer-term dynamics are proving far more problematic. With global stagflation risks persisting and fiscal deficits remaining structurally elevated, term premiums are clearly poised to rise further from here. Current levels remain below the peaks recorded earlier in the year and even during the April stress episode, but the direction of travel is clear. Investors and policymakers alike may need to act quickly, as sustained upward pressure on funding costs risks amplifying vulnerabilities and increasing the potential for broader financial instability across Western Europe.
Bonds are back in the spotlight today, leading the market worry, with EU, U.K. and U.S. yields all notably higher. Driving the move were fiscal and political worries, overlaid with doubts over central banks’ ability to fix the current economic illness of stall-speed growth and sticky inflation. Yesterday, China’s RatingDog PMI for manufacturing rose to 50.5, its highest level since March, led by orders but reflecting higher prices. The European manufacturing PMI also rose into expansion territory, its highest level since June 2022, with new orders up along with prices. August Eurozone inflation rose to 2.1% y/y, which was higher than expected, and reflects the underlying problem for the ECB. These economic data reflect another worry, that the current price discovery for bonds globally is shifting to a multi-polar world where fragmentation and regional politics dominate over capital flows. The effect of higher yields on stocks is negative, and it is not supporting FX. In fact, the worries about EU and U.K. bonds have helped USD more than anything else, making the rush for dollar alternatives more confusing. The balancing act of risks for the start of September in U.S. markets will revolve around bonds and stocks, as they battle for asset allocation at the right price. USD gains over the day seem limited: with hedging risks and the U.S. ISM report mixed with a significant T-bill sale, there is no escaping the shift in mood or the seasonality of bonds today. September has delivered difficult returns for fixed income over the last ten years, and we are starting to see that play out again.
U.S. Treasury Secretary Scott Bessent said he is confident the Supreme Court will uphold President Trump’s use of the 1977 International Emergency Economic Powers Act to impose broad tariffs, though the administration has backup options if it does not. His comments followed a 7-4 ruling by the U.S. Court of Appeals for the Federal Circuit that declared most of Trump’s tariffs illegal but left them in place until October 14 pending appeal. The challenged tariffs include “reciprocal” levies imposed in April and February measures against China, Canada and Mexico to curb fentanyl imports. Bessent said alternative authorities, such as Section 338 of the 1930 Smoot-Hawley Tariff Act, could be used, though less effectively, to impose temporary tariffs of up to 50% on discriminatory trading partners. S&P Mini -0.525% to 6438.75, DXY +0.556% to 98.314, 10y UST +4.7bp to 4.275%.
The ECB’s Isabel Schnabel said borrowing costs should remain unchanged, warning that inflation risks are tilted to the upside. She told Reuters that Europe’s economy is holding up despite U.S. trade disruption, but tariffs, fast-rising U.S. food prices and expansionary fiscal policy could push inflation above projections. Schnabel said policy is already “mildly accommodative” and ruled out further rate cuts, noting that risks to inflation expectations are not to the downside after years of high price growth. Her remarks come ahead of the September 11 policy meeting, where rates are expected to be held. She also warned that any erosion of Federal Reserve independence could drive up global borrowing costs and disrupt financial markets. Her comments came as preliminary Eurozone inflation data for August showed price gains of 2.1% y/y vs. 2.0% y/y in July. Food, alcohol and tobacco recorded the highest annual rate at 3.2%, easing from 3.3% in July, followed by services at 3.1%, down from 3.2%. Non-energy industrial goods remained stable at 0.8%. Energy prices continued to decline but at a slower pace, falling 1.9% compared with -2.4% in July. Euro Stoxx 50 -0.459% to 5342.44, EURUSD -0.496% to 1.1653, BBG AGG Euro Government High Grade EUR -2.5bp to 2.86%.
Australia’s second-biggest pension fund, Australian Retirement Trust ($330bn under management), has cut exposure to US Treasurys amid concerns Washington’s fiscal policies will fuel inflation. Senior portfolio manager Jimmy Louca said the fund is underweight U.S. bonds, seeing better value in U.K. gilts and Australian government debt, where fiscal consolidation is more evident. Despite the Fed’s easing cycle, ART views the U.S. policy mix of heavy fiscal spending and accommodative monetary policy as structurally inflationary. The fund has also exited Treasury steepener trades and turned bearish on the dollar, favoring currencies such as the yen and gold. Growing worries over Fed independence after Trump’s attempts to oust Governor Lisa Cook have added to investor caution. ASX -0.426% to 4956.55, AUDUSD -0.519% to 0.6518, 10y ACGB +4bp to 4.358%.
China’s outstanding margin financing has reached a new record high of ¥2.29tn ($320bn), surpassing the previous peak set a decade ago, as investors ramp up leveraged bets to join a liquidity-fueled stock market rally. Since early August, the balance has broken through key thresholds of ¥20tn, ¥21tn and ¥22tn in quick succession, with cumulative growth exceeding ¥3tn. The financing balance alone rose to a historic high of ¥2.29tn, accounting for most of the increase. Margin trading turnover on September 1 was ¥323.9bn, the sixth straight day above ¥300bn and the 14th consecutive day above ¥200bn. Despite record balances, margin trading accounted for 11.66% of total A-share turnover and 2.42% of free-float market value, both well below 2015 peaks. CSI 300 -0.735% to 4490.45, USDCNY +0.139% to 7.1476, 10y CGB -1.1bp to 1.77%.
U.S. August ISM manufacturing expected to improve from 48.0 to 49.0.
U.S. July construction spending forecast to post a third monthly decline, at -0.1% m/m from -0.4% in June.
U.S. Treasury sells $82bn in 13-week bills, $73bn in 26-week bills, $50bn in 52-week bills and $85bn in 6-week bills.
Mood: Investor sentiment has continued to normalize, with increasing appetite for equities and easing demand for core sovereign bonds. iFlow Mood is in the neutral zone.
FX: HUF, CZK, INR and NZD posted the most inflows, while CLP and IDR were most sold. Overall, G10 currencies were better bid but moderately so, LatAm currencies were biased toward selling, and there were light and mixed flows in the APAC and EMEA regions.
FI: Notable flows included significant outflows into Danish government bonds, against buying in U.S. Treasurys and Philippines government bonds, followed by U.K. gilts and Eurozone government bonds.
Equities: European, U.K., Canadian and Czech equities were significantly sold vs. strong buying in Colombia, followed by New Zealand and Sweden. Within DM EMEA, the health care sector posted the most buying, while the financials sector was most sold.
“The bitterness of poor quality remains long after the sweetness of low price is forgotten.” – Benjamin Franklin
“Price is what you pay. Value is what you get.” – Warren Buffett
France’s budget deficit was €142.04bn in July, vs. €100.4bn in June, as borrowing costs on the 30y OAT rose to 4.513%, the highest since 2009. Budget revenues from January to July 2025 totaled €198.2bn, up 6.0% y/y from €186.9bn in the same period of 2024. Fiscal revenues rose 6.4% y/y to €176.9bn, with the income tax take increasing by 6.6% to €39.5bn, corporate tax up 7.8% to €28.6bn, VAT up 2.2% to €59.1bn and energy product taxes rising 2.9% to €9.2bn. Other fiscal revenues surged 12.9% to €40.6bn. Non-tax revenues fell 1.3% to €16.2bn. The master budget revenue grew 5.7% to €193.1bn, while the cooperation fund expanded 18.8% to €5.0bn. Measured against its targets, revenue progress is at 52.6% of the 2025 forecast of €376.7bn. CAC40 +0.003% to 7708.13, EURUSD -0.496% to 1.1653, 10y OAT +3.7bp to 3.575%.
Italy’s July producer prices for industry rose 0.5% m/m and 1.6% y/y, slowing from +2.4% in June. Domestic market prices increased by 0.6% m/m and 2.4% y/y, though excluding energy they fell 0.2% m/m and grew 0.6% y/y. Foreign market prices edged up 0.1% m/m and were mixed y/y (+0.4% in the euro area, -0.2% outside). Over May-July, industrial producer prices decreased by 1.8% from the prior three months. The strongest annual gains were in pharmaceuticals (+2.6% domestic) and transport equipment (+4.4% euro area exports), while coke and refined petroleum products fell sharply (-7.4% domestic, -9.9% euro area). Construction prices rose modestly, with residential and non-residential buildings up 0.1% m/m and 1.0% y/y, while roads and railways were flat y/y. FTSEMIB -0.655% to 42131.97, EURUSD -0.496% to 1.1653, 10y BTP +4bp to 3.649%.
Italy’s services producer prices fell 0.1% q/q but rose 3.3% y/y in Q2 2025, easing from +4.0% in Q1. Business-to-business prices were broadly stable, with gains in rental, travel agencies and business support services (+1.7% q/q, +5.2% y/y) and information and communication (+0.9% q/q, +4.2% y/y). Professional, scientific and technical services were flat q/q but up 3.4% y/y, down from +4.2% previously. Transport and storage prices dropped 1.1% q/q, led by air freight (-6.9%), though road freight rose 0.6% and postal services 1.5%; annual growth slowed to 1.0%. Across the total market (business and consumer), prices rose 0.8% q/q and 3.4% y/y, down from +3.8% in Q1.
Spain’s registered unemployment rose by 21,905 in August to 2,426,511, though this remained the lowest August level since 2007. In seasonally adjusted terms, jobless numbers fell by 6,075, while on a y/y basis unemployment dropped by 145,610 or 5.7%. Female unemployment stood at 1,471,731 after an 11,748 rise, its lowest August level since 2008, while male joblessness rose 10,157 to 954,780. Youth unemployment increased by 3,485 to remain below 170,000, marking 52 months of consecutive y/y declines. By sector, unemployment fell in agriculture and among those without prior employment, but rose in construction, industry and services. Five regions registered falls, led by Castilla-La Mancha and the Canary Islands, while Catalonia, Madrid and the Basque Country posted the largest increases.
Hungary’s GDP grew 0.2% y/y in Q2 2025 (seasonally and calendar-adjusted), while output rose 0.4% q/q. Construction expanded by 4.3% y/y and services grew 1.3%, led by information and communication (+6.3%) and arts and recreation (+6.5%). Industry contracted by 3.3%, mainly due to weaker manufacturing, while agriculture fell 11.4%. Household consumption rose 4.5% y/y, with durable goods up 6.2% and services 4.6% higher. Government consumption increased by 9.8%, while gross fixed capital formation shrank by 7.0%, weighing on investment. Domestic use grew 3.8%. External trade posted a surplus of HUF 1,183bn, but exports declined 0.9% as imports rose 4.0%, subtracting 3.4 percentage points from GDP growth. Consumption added 3.7 percentage points, while investment cut 0.3 percentage points. Budapest SI -0.155% to 103552.3, EURHUF +0.243% to 396.14, 10y HGB +2bp to 7.11%.
Australia’s current account balance rose by $0.4bn q/q in Q2 2025 to a deficit of $13.7bn, as a $1.2bn rise in net primary income was offset by a $1.2bn fall in the goods and services surplus. The net primary income deficit narrowed to its lowest since September 2021 on stronger investment inflows, while the goods and services surplus was hit by record imports of non-monetary gold and higher travel services. Imports rose 0.8%, driven by a 3.4% increase in services, while goods imports were steady. Exports fell 0.9% as lower iron ore and coal prices dragged down goods exports, partly offset by a 3.6% rise in services exports. Australia’s terms of trade declined by 1.1% q/q and 2.4% y/y. ASX -0.426% to 4956.55, AUDUSD -0.519% to 0.6518, 10y ACGB +4bp to 4.358%.
New Zealand Q2 merchandise (goods) terms of trade rose 4.1% q/q. Export prices for goods rose 0.2% q/q, and import prices fell 3.7% q/q. Exports of goods and services rose 9.9% y/y to $28.9bn, while imports increased 3.2% y/y to $27.6bn, bringing two-way trade to $56.4bn. Goods exports climbed 12% to $21.4bn, and services exports grew 5.4% to $7.5bn, driven by business, transport and travel services. Goods imports edged up 0.6% to $19.1bn, while services imports rose 9.5% to $8.5bn, led by telecommunications, transport and cultural services. Compared with March, merchandise terms of trade improved by 4.1%, as export prices rose 0.2% and import prices fell 3.7%. The value of goods exports fell 4.8% on weaker volumes, while import values declined 1.2% despite higher volumes. Services terms of trade eased by 0.4%, as both export and import prices fell. NZX 50 +0.48% to 13133.16, NZDUSD -0.628% to 0.5863, 10y NZGB +4.6bp to 4.418%.
South Korea’s August CPI eased more than expected from 2.1% to 1.7% y/y, while the core ex-food and energy measure plunged to 1.3% y/y from 2.0% y/y. Core CPI excluding food and energy stood at 112.84, down 0.6% m/m and up 1.3% y/y. By category, food and non-alcoholic beverages surged 2.6% m/m and 4.9% y/y, while furnishings rose 0.3% m/m and 3.7% y/y, and restaurants and hotels gained 0.2% m/m and 3.1% y/y. Housing, water, electricity, gas and fuels increased by 0.2% m/m and 1.3% y/y, while transport edged up 0.4% m/m and 0.1% y/y. The sharpest decline came in communication, which fell 13.3% m/m and y/y. Most other categories, including clothing, education, health and miscellaneous goods, showed modest rises. KOSPI +0.936% to 3172.35, USDKRW +0.033% to 1393.9, 10y KTB +3.4bp to 2.847%.
Malaysia August PMI improved to 49.9 (July 49.7). The latest data signaled improved trends across Malaysia’s manufacturing sector at the midpoint of the third quarter of 2025. There was a rise in production levels for the first time since May 2024, as new order intakes rose for the first time in six months. While the respective rates of growth were only marginal, the expansion in demand was the strongest in exactly three years. August data also showed export demand remaining positive for the second month running, while purchasing activity accelerated at a faster pace. That said, some firms raised concerns over how long this recovery will continue, as there was a further contraction in employment levels in the latest survey period. The degree of confidence in the 12-month outlook for production also waned from July and was the lowest in over four years. KLCI -0.227% to 1571.54, USDMYR +0.088% to 4.2285, 10y MGB -0.1bp to 3.39%.