Market Movers: Mixed Signals
Market Movers highlights key activities and developments before the U.S. market opens each morning.
Market Movers highlights key activities and developments before the U.S. market opens each morning.

Bob Savage
Time to Read: 13 minutes
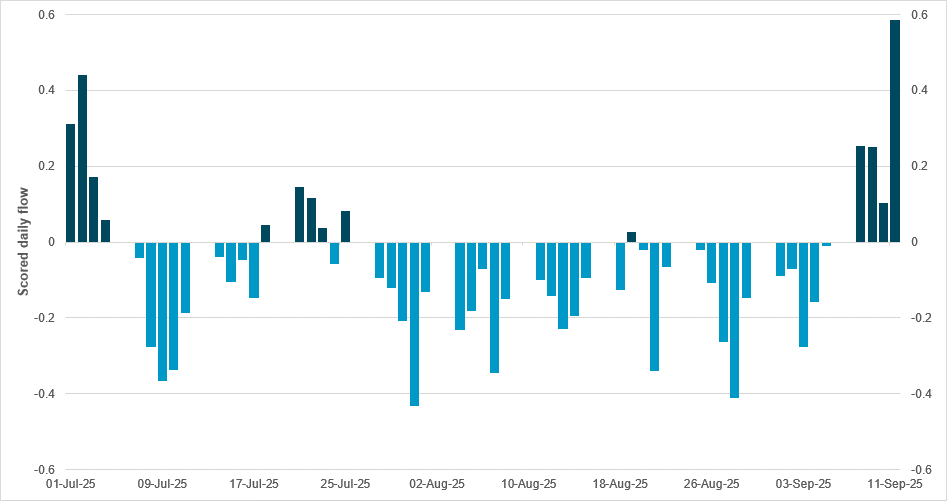
Latin American currencies see surge flow as carry interest rises pre-Fed
Source: BNY
The FOMC is expected to cut rates this week, drawing renewed attention to the dollar-funded carry trade. While the dollar has maintained its role as a funding currency, Latin America has consistently offered both real and nominal yield advantages, even during episodes of “U.S. exceptionalism” in asset allocation. This year, monetary easing has dominated across the region, but idiosyncratic risks, particularly tariffs on exports to the U.S., have weighed on currency performance. Historically, we have argued that real rates provide a foundation for duration trades, but currency risk should be hedged. With the Fed now poised for material easing, hedging activity appears to be diminishing, opening up the possibility of a stronger run for LatAm FX in the weeks ahead. Recent inflows have favored COP, PEN and CLP. CLP is the standout, benefiting from copper market consolidation and improved terms of trade, while remaining the region’s most underheld currency. COP and PEN are less directly exposed to industrial commodity demand, with mixed real rate records, yet investor appetite for currencies linked to tangible assets – whether hard commodities or agricultural products – is gaining momentum. Strong performance in global soft commodity prices, driven by persistent food inflation, is further supporting the region. Meanwhile, MXN is the only currency seeing modest net selling, and BRL continues to attract limited interest, as Mexico and Brazil remain the most vulnerable to tariff-related volatility.
Risk sentiment has been mixed across markets, as the economic news has clashed with policy hopes. The main driver remains Fed easing sentiment, but across the world, data and policy are sending out conflicted trading signals. China’s probe into Nvidia contrasts with progress in the Madrid trade talks and TikTok deal hopes. Chinese bonds have sold off, while shares have rallied. South Korea is pushing for a larger bilateral swap line and more U.S. trade, while pulling back on larger capital gains taxes. Fitch’s downgrade of France on Friday has had only a muted effect on OAT yields, which are down but lagging the EU, while Italy has led a rally with better budget news. Turkish assets rallied after the country’s courts delayed a ruling on the opposition CHP party until October 24. China’s retail sales and industrial production data undershot expectations, but ongoing stimulus continues to support markets; meanwhile Indonesia is pushing for new economic stimulus and IDR has held below the key 16,500 level to the USD. India is seeking more easing of FDI rules, but both WPI and CPI have proved sticky and shares are flat. Investors face a series of mixed signals, as do central bankers, with the week ahead filled with their decisions. Expectations for the Bank of Canada and Fed are for modest easing; Norges Bank may join in, but the Bank of England is expected to wait before cutting and the Bank of Japan to wait before hiking. The divergent decisions are likely to leave markets wanting more information ahead, with little chance that today will be the tipping point for opening new flows of money. The focus for the day in the U.S. will be on progress in Congress toward a continuing resolution on funding the government, along with the New York Empire Fed manufacturing report and the squeeze on overnight money ahead of tax payments today. The weak “equities up, dollar down” correlation held overnight; however, the key may be in yield curve steepening, with the focus on bills, budgets and growth, as the tech sector dominates. We are also watching for some shift in models, as trend, carry and value are all neutral in our iFlow metrics. Mixed signals are an opportunity for investors as they position ahead of central bank meetings, with sector rotation and economic unevenness providing a floor for volatility.
Germany’s municipal elections in North Rhine-Westphalia – Germany’s most populous state – saw Chancellor Friedrich Merz’s CDU lead with 33% of the vote, while the SPD followed with around 22%, both slightly down from five years ago. The far-right AfD surged, nearly tripling its share to 15% from 5.1%, placing third and making significant gains in western regions beyond its eastern strongholds. In Gelsenkirchen, the AfD candidate advanced to a mayoral runoff. The results highlighted AfD’s growing appeal among working-class voters in industrial cities hit by coal and steel decline. While the elections carry no direct national impact, they were viewed as a gauge of sentiment four months into Merz’s chancellorship, with conservatives warning that issues like migration, housing and welfare fairness need urgent answers. DAX +0.63% to 23847.37, EURUSD +0.026% to 1.1737, 10y Bund -1.5bp to 2.7%.
China’s factory output and retail sales missed expectations in August. Retail sales dropped to 3.4% y/y, 4.6% YTD y/y vs. 3.7% y/y and 4.8% YTD y/y in July, dragged down by -8% y/y for petroleum and related products, plus a sharp reduction in food spending growth (5.8% y/y vs. 8.6% y/y in July). Retail sales ex-auto fell to 3.7% y/y from 4.3% y/y in July. Industrial production plunged to 5.2% y/y, the lowest since August 2024 from 5.7% y/y or 6.2% YTD y/y from 6.3% YTD y/y. High tech sector production was mixed, with 3D printing devices +40.4% y/y (July: 24.2%), industrial robots +14.4% y/y (July: 24% y/y), new energy vehicles +22.7% y/y (July: 17.1% y/y) and integrated circuits +3.2% (July: 15.0% y/y). Fixed asset investment decelerated to 0.5% YTD y/y from 1.6% YTD y/y in July, with infrastructure investment at 2.0% YTD y/y (July: 3.2%). The property investment contraction deepened to -12.9% YTD y/y from 12% in July. CSI 300 +0.245% to 4533.06, USDCNY -0.034% to 7.1226, 10y CGB -0.1bp to 1.801%.
Thailand is considering a tax on physical gold trading settled in baht to slow the currency’s rally, which has put exports and tourism under pressure. The Bank of Thailand and Ministry of Finance are discussing a levy that may exclude trades in U.S. dollars, futures exchanges or bullion shops. Gold exports surged 69% y/y in January-July 2025 to THB 254bn, with a sharp rise in shipments to Cambodia drawing scrutiny, while global bullion prices have risen nearly 40% this year. The baht has gained 7% in 2025, hitting a four-year high and prompting calls for stronger central bank action. Officials will meet gold traders to review reporting practices, with any tax decision pending the new cabinet’s approval. SET +0.33% to 1297.89, USDTHB +0.631% to 31.912, 10y TGN +0.9bp to 1.261%.
U.S. September NY Empire Manufacturing index forecast to ease from 11.9 to 5.0.
Canada July manufacturing sales are expected at 1.8% m/m vs. 0.3% m/m, while wholesale sales ex petroleum are seen at 1.3% m/m vs. 0.7% m/m.
U.S. Treasury sells $82bn in 13-week bills and $73bn in 26-week bills.
Mood: iFlow Mood has continued to normalize, with steady equity inflows against easing demand for core sovereign bonds. iFlow Mood, at -0.09, is at its narrowest since the end of July 2025.
FX: G10 flows were mixed, with light USD and EUR outflows against NOK, CAD, GBP and JPY inflows. Elsewhere, TRY, MYR and SGD posted the most outflows, against most inflows into HUF, followed by KRW, HKD, PEN and CZK.
FI: Strong demand continued in Eurozone government bonds, U.K. gilts and Colombia government bonds, followed by U.S. Treasurys. Polish and Indonesian government bonds were most sold. Chinese government bonds recorded renewed demand, after selling bias over the past month.
Equities: Asset allocation out of developed markets into emerging markets continued. Notable selling in Switzerland, followed by the U.S. and Europe. Brazil and South Africa equities drew significant inflows, followed by Taiwan, South Korea and Israel.
“Don’t let mixed signals fool you. Indecision is a decision.” – Nitya Prakash
“Organizing is what you do before you do something, so that when you do it, it is not all mixed up.” – A.A. Milne
Canada’s August 2025 home sales rose 1.1% m/m, marking the fifth consecutive monthly gain and the strongest August since 2021, with activity up 12.5% since March. Unlike earlier months, which were led by the Greater Toronto area, sales there dipped slightly but were offset by increases in Montreal, Greater Vancouver and Ottawa. Actual sales were 1.9% higher y/y, while new listings climbed 2.6% m/m, easing the sales-to-new listings ratio to 51.2% from 52% in July, below the long-term average of 54.9%. The MLS® Home Price Index was flat at -0.1% m/m and down 3.4% y/y, while the national average sale price rose 1.8% y/y. Active listings stood at 195,453, up 8.8% y/y and in line with long-term norms. TSX 60 Future 0.121% to 1732.3, USDCAD -0.073% to 1.3834, 10y CGB +2.7bp to 3.188%.
The euro area recorded a trade in goods surplus of €12.4bn in July 2025, down from €18.5bn a year earlier. Exports totaled €251.5bn, up 0.4% y/y, while imports rose 3.1% to €239.1bn. Compared with June 2025, the surplus widened from €8.0bn, supported by stronger balances in chemicals (€17.4bn vs. €15.4bn) and machinery and vehicles (€18.5bn vs. €13.7bn). However, on an annual basis, the surplus declined mainly due to a reduced chemicals balance (€17.4bn vs. €23.8bn). For January-July 2025, the euro area posted a €106.9bn surplus, down from €120.4bn a year earlier, as exports grew 3.5% to €1,739.3bn and imports rose 4.7% to €1,632.4bn. The EU as a whole registered a €12.1bn surplus in July, compared with €15.9bn in July 2024. Euro Stoxx 50 +0.958% to 5442.37, EURUSD +0.026% to 1.1737, BBG AGG Euro Government High Grade EUR -2.7bp to 2.911%.
The euro area job vacancy rate stood at 2.2% in Q2 2025, down from 2.4% in Q1 and 2.6% in Q2 2024. The EU rate was 2.1%, also lower than 2.2% in Q1 and 2.4% a year earlier. In the euro area, vacancies were 2.0% in industry and construction and 2.4% in services, while in the EU the figures were 1.8% and 2.3%, respectively. Among member states, the highest rates were in the Netherlands (4.2%) and Belgium (3.9%), and the lowest in Romania (0.6%), Spain and Poland (both 0.8%). Compared with Q2 2024, rates rose in five countries, were stable in three, and decreased in 19, with the largest falls in Greece (-0.9 percentage points) and Finland (-0.7 percentage points).
Germany’s wholesale selling prices rose 0.7% y/y in August 2025, following increases of 0.5% in July and 0.9% in June, but declined 0.6% m/m. The annual rise was mainly driven by food, beverages and tobacco (+4.2%), with sharp increases for coffee, tea, cocoa and spices (+17.7%), sugar, confectionery and bakery products (+14.5%), meat (+9.6%), live animals (+8.9%) and dairy, eggs, oils and fats (+7.4%). Prices of non-ferrous ores, metals and semi-finished products surged 21.1% y/y and 1.6% m/m. By contrast, wholesale prices for solid fuels and mineral oil products fell 6.9% y/y and 4.2% m/m, while scrap materials (-10.4% y/y), IT equipment (-4.9% y/y) and iron and steel (-4.6% y/y) also declined. DAX +0.63% to 23847.37, EURUSD +0.026% to 1.1737, 10y Bund -1.5bp to 2.7%.
Italy’s July 2025 exports rose 1.2% m/m, driven by a 2.4% increase to extra-EU markets, while imports grew 0.7%. On a quarterly basis, exports fell 1.5% and imports 1.8%. Annually, exports increased 7.3% in value and 6.9% in volume, with extra-EU sales up 9.9% and EU sales up 4.8%. Imports rose 6.1% y/y in value and 1.1% in volume, led by a 13.1% surge from extra-EU markets. Export growth was supported by transport equipment excluding vehicles (+45.6%), pharmaceuticals (+28.5%), metals (+7.0%) and food, beverages and tobacco (+6.1%), while vehicles (-5.3%) and electrical equipment (-3.8%) declined. Major contributions came from the U.S. (+24.1%), ASEAN (+37.4%), Spain (+13.8%) and Switzerland (+9.5%). The trade surplus widened to €7.9bn from €6.8bn a year earlier, with the energy deficit narrowing. Import prices rose 0.3% m/m but fell 3.0% y/y. FTSEMIB +1.079% to 43025.87, EURUSD +0.026% to 1.1737, 10y BTP -2.9bp to 3.494%.
Switzerland’s Producer and Import Price Index fell 0.6% m/m in August 2025 to 105.5 points (December 2020=100), with prices down 1.8% y/y. The Producer Price Index dropped 0.8% m/m and 1.3% y/y, driven mainly by falls in pharmaceutical preparations, basic pharmaceuticals and electricity, though prices for paints and varnishes and for food products rose. The Import Price Index decreased by 0.4% m/m and 2.7% y/y, with lower prices for pharmaceuticals, chemicals, rubber and plastics, metals and paper products, while petroleum, natural gas and flat glass rose. Manufactured goods for domestic sale held steady m/m and increased 0.5% y/y, whereas exports fell 1.5% m/m and 2.2% y/y. Energy prices rose slightly for imports but contracted for domestic supply. SMI +0.077% to 12203.21, EURCHF -0.033% to 0.93437, 10y Swiss GB -0.9bp to 0.255%.
Norway’s August 2025 exports totaled NOK 143.4bn, down 5.2% y/y, with crude oil falling 11.3% and natural gas down 16.3%, while mainland exports rose 10.7% to NOK 63.1bn. Imports declined 9.4% y/y to NOK 83.3bn, reflecting a sharp drop in ships and oil platforms. The overall trade balance registered a surplus of NOK 60.1bn, up 1.4% y/y, while the mainland trade deficit narrowed 37.9% to NOK 20.2bn. Year-to-date exports reached NOK 1.211tn, up 2.3% y/y, with natural gas rising 20.5% and crude oil down 19.3%. Imports in the same period increased 2.2% to NOK 720.7bn, resulting in a cumulative trade surplus of NOK 490.6bn, up 2.6% y/y. OSE +0.463% to 1662.28, EURNOK -0.118% to 11.5474, 10y NGB -0.5bp to 3.993%
Norway’s construction cost index for residential buildings rose 4.8% y/y in August 2025, reaching 153.9, with a marginal 0.1% increase from July. Labor costs fell 0.5% m/m but remained up 3.9% y/y at 134.6. Material costs increased 0.7% m/m and 6.0% y/y, pushing the index to 184.2. Detached houses of wood recorded a 5.1% annual rise, with material costs up 7.1% and other building work up 5.7%. Multi-dwelling houses saw costs rise 4.2% y/y, with material costs up 4.0%. Overall, cost growth in August was primarily driven by higher material prices, offsetting a decline in labor costs.
According to Rightmove, the U.K.’s September average new seller asking price rose 0.4% m/m, or £1,517, to £370,257, though values were 0.1% lower y/y after subdued summer growth. The downturn was led by London and the south, where stock rose 9% versus 2% elsewhere, and homes took five days longer to secure buyers. Sales agreed were up 4% y/y nationally, including 3% in the south and 5% across the rest of Great Britain. Rightmove data showed no immediate impact from property tax rumors, though risks remain for higher-value markets, with 59% of London sales exceeding £500,000. Improved affordability, supported by reduced two-year mortgage rates at 4.52% from 5.03% in August 2024, alongside sensible pricing and wider choice, has underpinned stronger buyer activity. FTSE 100 -0.005% to 9282.79, GBPUSD +0.251% to 1.359, 10y gilt -2.3bp to 4.648%.
New Zealand August Performance Services Index (PSI) eased from 48.9 to 47.5. For the sub-index results, both activity/sales (46.2) and new orders/business (47.8) slipped vs. July. Employment (48.3) was higher than in July, although still in long-term contraction. Service sector businesses reported widespread pressures from inflation, high interest rates, cost-of-living impacts and weak consumer confidence, all contributing to reduced demand and spending. Other concerns included seasonal slowdowns, rising operating costs, supply chain disruptions and government policy uncertainty. NZX 50 -0.148% to 13208.31, NZDUSD +0.118% to 0.5961, 10y NZGB +4.2bp to 4.316%.
China August new home prices and used home prices extended their downtrend, declining by -0.3% m/m and -0.58% m/m, respectively, from -0.31% and -0.55% in July. Year on year, new home prices were down -2.95% (July -3.37%) and used home prices -5.51% (July: -5.85% y/y). Looking into the breakdown, new Tier 1, Tier-2 and Tier-3 home prices were down -0.1% m/m, -0.3% m/m and -0.4% m/m, respectively. Tier 1, Tier-2 and Tier-3 used home prices for posted sharper m/m declines, at -1% m/m, -0.6% m/m and -0.5% m/m, respectively. China’s NBS emphasized that the national economy was generally stable, with steady progress made in transformation and upgrading and new achievements scored in high-quality development. It advised investors to be aware that there are many unstable and uncertain factors in the external environment, and that national economic development is still confronted by multiple risks and challenges. CSI 300 +0.245% to 4533.06, USDCNY -0.034% to 7.1226, 10y CGB -0.1bp to 1.801%.
South Korea has abandoned a controversial plan to lower the capital gains tax threshold for stock investors. Elsewhere, the country will release a record 172,000 tons of major food items and expand discount programs worth ₩90bn ($64.5mn) to help stabilize living costs and boost household consumption ahead of the Chuseok holiday next month. Under the plan, the government will supply 1.6 times the usual volume of major food items before the holiday and offer discounts of up to 50% on popular Chuseok gift sets, such as fruits and premium Korean beef, known as “hanwoo.” It will also operate about 2,700 direct-to-consumer markets nationwide to expand access to affordable goods. KOSPI +0.347% to 3407.31, USDKRW -0.399% to 1388, 10y KTB +0.3bp to 2.815%.
India’s wholesale price inflation stood at 0.52% y/y in August 2025, reversing July’s 0.58% decline. The all-commodities index rose to 155.2 from 154.4, driven by higher prices of food products, other manufacturing, non-food articles and mineral products. Primary articles fell 2.1% y/y, while fuel and power contracted by 3.2% y/y. Manufactured product prices rose 2.6% y/y, reflecting increases among food products, textiles, electrical equipment and transport equipment. The WPI Food Index rose to 193.5, with inflation turning positive at 0.21% y/y from -2.15% in July. On a monthly basis, WPI increased 0.52%, led by a 1.6% rise in primary articles but offset by a 0.7% fall in fuel and power. The external debt-to-GDP ratio was reported at 30.0%. SENSEX -0.107% to 81817.28, USDINR -0.126% to 88.1675, 10y INGB -0.6bp to 6.481%.
Philippines’ July cash remittances rose 3.0% y/y to $3.18bn from $3.08bn, with land-based overseas Filipinos contributing $2.59bn (+3.0%) and sea-based workers $585mn (+3.1%). Cumulative January-July cash remittances grew 3.1% to $19.93bn from $19.33bn a year earlier. The U.S. remained the top source of remittances, followed by Singapore and Saudi Arabia. Personal remittances, which include cash sent through banks and informal channels and in-kind transfers, increased 3.1% to $3.53bn in July from $3.43bn, while cumulative January-July personal remittances also rose 3.1% to $22.21bn from $21.53bn. These inflows underscore steady growth across both land-based and sea-based worker contributions. PSEi -0.848% to 6057.43, USDPHP +0.125% to 57.191, 10y PHGB +0.2bp to 5.905%.
Indonesia’s external debt stood at $432.5bn in July 2025, down from $434.1bn in June, with annual growth slowing to 4.1% y/y from 6.3% in June. Government external debt rose 9.0% y/y to $211.7bn, easing from 10.0% in June, with funds mainly directed to health services (23.1%), education (17.0%), administration and defense (15.9%), construction (12.1%) and transport and warehousing (8.9%). Private external debt remained stable at USD195.6bn, contracting 0.3% y/y, as non-financial corporations’ debt fell 1.2% and financial corporations’ debt grew 3.6%. Long-term borrowings dominated, accounting for 99.9% of government debt and 85.5% of total external debt. The external debt-to-GDP ratio declined to 30.0% in July from 30.5% in June. JCI +0.933% to 7927.336, USDIDR +0.196% to 16410, 10y IDGB +0.4bp to 6.335%.